# Commodities Report: Corn Futures,Dec-2025 soar by 5.39%
## Daily Performance Highlights
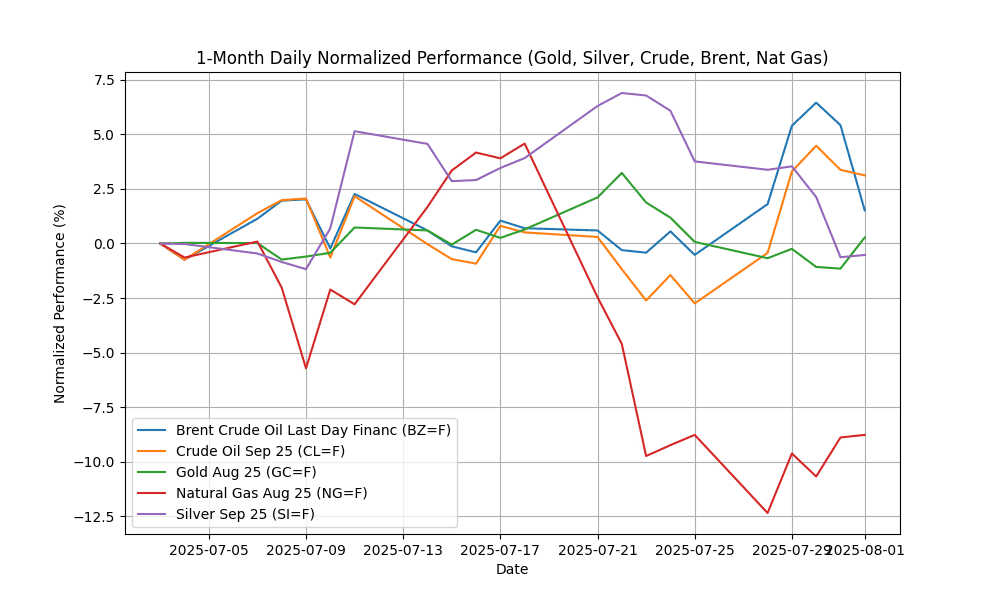
Gold Aug 25 (GC=F): Price $3340.90, Daily Change 1.45%
Crude Oil Sep 25 (CL=F): Price $69.09, Daily Change -0.25%
Largest Gainer: Corn Futures,Dec-2025 (ZC=F) (5.39%)
## 1-Month Daily Normalized Performance Chart
## Commodities News Summary
In today’s commodities market, oil prices exhibited stability amid mixed sentiments regarding potential tariff impacts and ongoing supply threats from Russia. Market participants are closely monitoring the implications of recent tariff hikes ordered by President Trump, which have raised concerns over trade dynamics and their effect on oil demand.
Gold prices are poised for a weekly decline, driven by a strengthening U.S. dollar and the ongoing tariff discussions. The market is reacting to the broader economic implications of these tariffs, which have created uncertainty among investors.
In the metals sector, Codelco reported a tragic incident at its El Teniente mine, where one worker was killed and several others injured due to a seismic event. This news may impact copper supply sentiment, although immediate price reactions were not reported.
Natural gas markets are expected to see significant changes as demand grows, particularly in the Eastern U.S. The Annual Energy Outlook 2025 indicates that natural gas from the Appalachian Basin will increasingly support rising LNG export demands in the Gulf Coast region, reflecting a shift in regional production dynamics.
Additionally, crude oil production on federal lands has reached a record high of 1.7 million barrels per day, largely driven by activity in New Mexico’s Permian Basin. This increase highlights the ongoing expansion of U.S. crude output amid evolving market conditions.
Overall, market sentiment is characterized by caution as traders navigate the complexities of tariffs, energy trade dynamics, and supply disruptions across various commodities.
## Group Performance and Charts
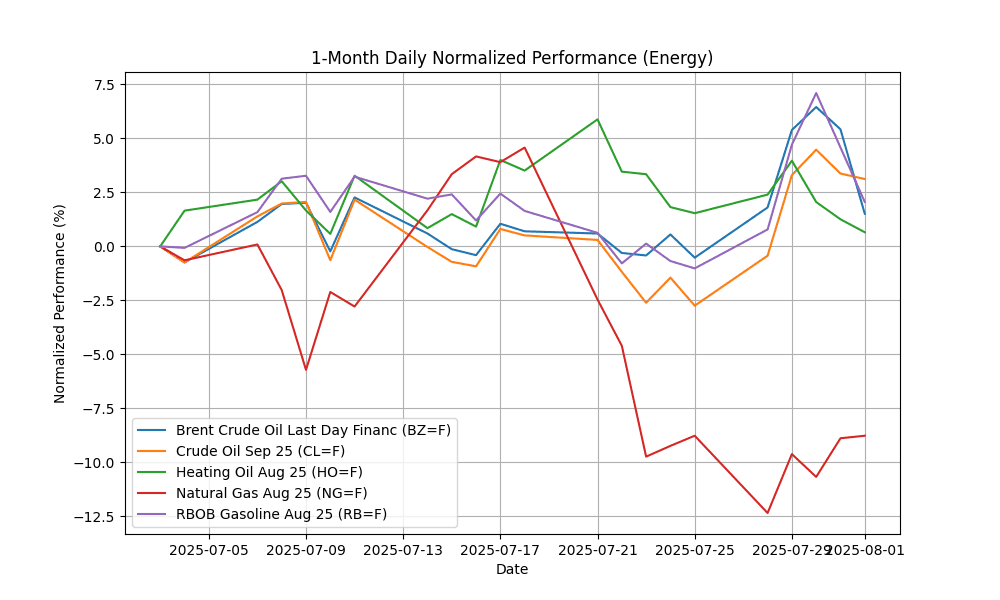
### Energy
| Name | Symbol | Price | Daily (%) | 5D (%) | 1W (%) | 1M (%) | 3M (%) | 6M (%) | YTD (%) | 12M (%) | MA50 | MA100 | MA200 | RSI | MACD |
|---|---|---|---|---|---|---|---|---|---|---|---|---|---|---|---|
| Brent Crude Oil Last Day Financ | BZ=F | 69.84 | -3.71 | 2.05 | 2.05 | 1.06 | 13.95 | -9.02 | -6.43 | -12.17 | 68.86 | 68.06 | 71.27 | 50.30 | 0.65 |
| Crude Oil Sep 25 | CL=F | 69.09 | -0.25 | 6.03 | 6.03 | 2.43 | 18.53 | -4.74 | -3.67 | -9.46 | 66.57 | 65.21 | 68.06 | 56.85 | 0.54 |
| Heating Oil Aug 25 | HO=F | 2.39 | -0.59 | -0.87 | -0.87 | -1.09 | 19.67 | -3.99 | 2.79 | -0.88 | 2.32 | 2.23 | 2.27 | 48.84 | 0.02 |
| Natural Gas Aug 25 | NG=F | 3.11 | 0.13 | 0.00 | 0.00 | -10.84 | -14.33 | 2.17 | -14.40 | 58.03 | 3.44 | 3.53 | 3.47 | 41.70 | -0.11 |
| RBOB Gasoline Aug 25 | RB=F | 2.16 | -2.41 | 3.11 | 3.11 | 1.85 | 7.04 | 6.17 | 8.03 | -9.83 | 2.14 | 2.13 | 2.08 | 50.64 | 0.01 |
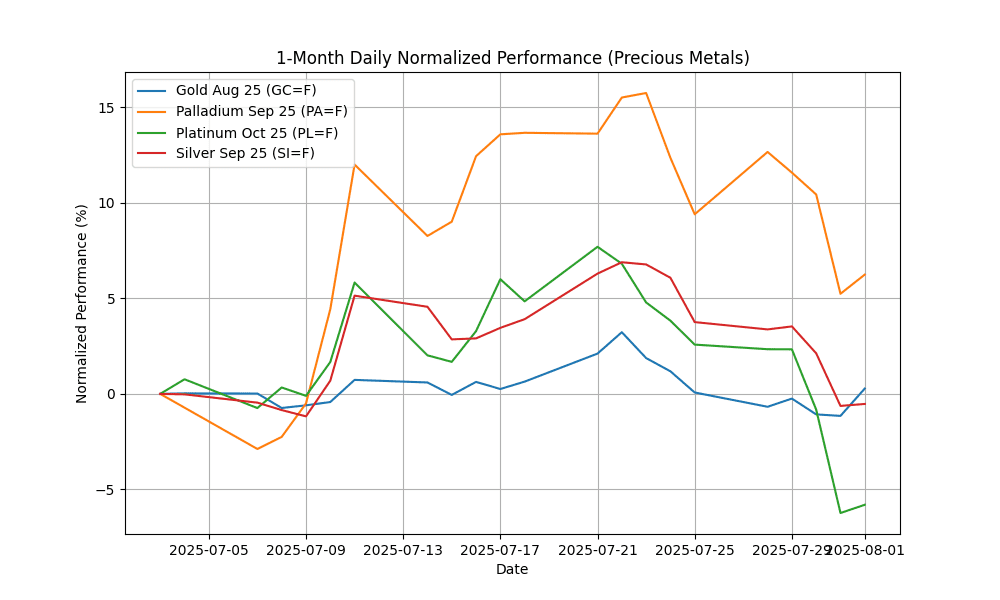
### Precious Metals
| Name | Symbol | Price | Daily (%) | 5D (%) | 1W (%) | 1M (%) | 3M (%) | 6M (%) | YTD (%) | 12M (%) | MA50 | MA100 | MA200 | RSI | MACD |
|---|---|---|---|---|---|---|---|---|---|---|---|---|---|---|---|
| Gold Aug 25 | GC=F | 3340.90 | 1.45 | 0.21 | 0.21 | -0.21 | 3.37 | 18.79 | 27.07 | 37.20 | 3341.52 | 3259.25 | 2998.89 | 50.41 | -3.36 |
| Palladium Sep 25 | PA=F | 1207.50 | 0.95 | -2.89 | -2.89 | 4.36 | 27.52 | 13.18 | 33.74 | 35.40 | 1127.09 | 1037.40 | 1012.22 | 50.10 | 33.30 |
| Platinum Oct 25 | PL=F | 1292.30 | 0.46 | -8.18 | -8.18 | -9.06 | 34.21 | 25.08 | 44.55 | 33.86 | 1294.90 | 1135.04 | 1051.85 | 39.84 | 10.32 |
| Silver Sep 25 | SI=F | 36.59 | 0.10 | -4.13 | -4.13 | 0.45 | 14.38 | 13.89 | 26.43 | 29.15 | 36.44 | 34.62 | 33.10 | 42.23 | 0.28 |
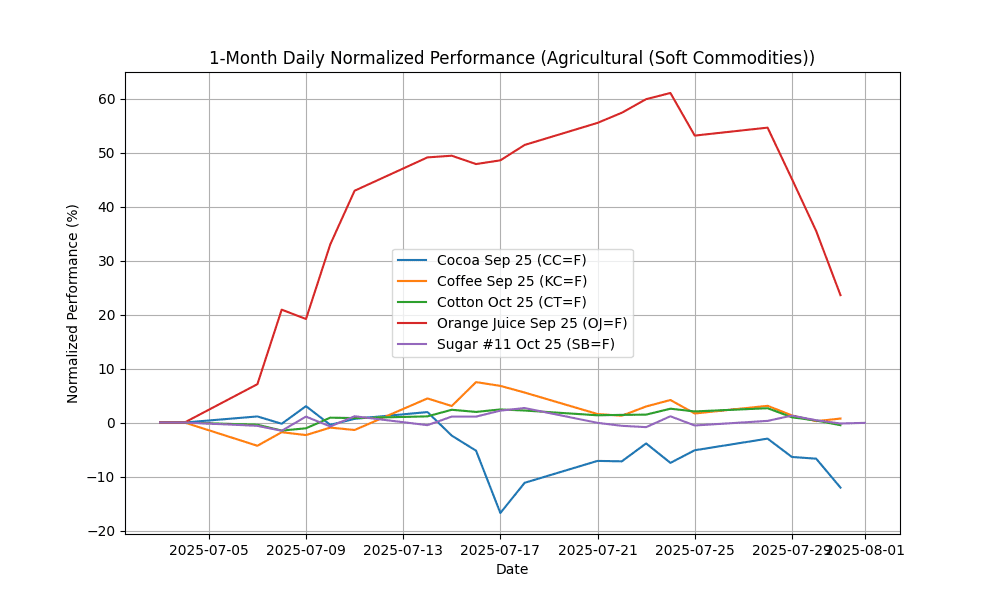
### Agricultural (Soft Commodities)
| Name | Symbol | Price | Daily (%) | 5D (%) | 1W (%) | 1M (%) | 3M (%) | 6M (%) | YTD (%) | 12M (%) | MA50 | MA100 | MA200 | RSI | MACD |
|---|---|---|---|---|---|---|---|---|---|---|---|---|---|---|---|
| Cocoa Sep 25 | CC=F | 7722.00 | -5.74 | -7.29 | -7.29 | -13.27 | -15.39 | -29.72 | -33.86 | 2.12 | 9116.36 | 8947.76 | 9247.44 | 38.65 | -292.26 |
| Coffee Sep 25 | KC=F | 294.80 | 0.48 | -0.92 | -0.92 | -1.06 | -25.44 | -21.98 | -7.80 | 29.72 | 321.11 | 352.68 | 339.90 | 41.82 | -6.27 |
| Cotton Oct 25 | CT=F | 65.34 | -0.85 | -2.49 | -2.49 | -2.14 | -6.90 | -0.82 | -4.47 | -2.30 | 65.93 | 66.24 | 67.36 | 42.15 | 0.08 |
| Orange Juice Sep 25 | OJ=F | 260.15 | -8.77 | -19.30 | -19.30 | 31.32 | -8.04 | -45.20 | -47.71 | -38.17 | 272.66 | 268.57 | 365.49 | 39.74 | 10.89 |
| Random Length Lumber Futures | LBS=F | N/A | N/A | N/A | N/A | N/A | N/A | N/A | N/A | N/A | N/A | N/A | N/A | N/A | N/A |
| Sugar #11 Oct 25 | SB=F | 16.37 | 0.12 | 0.49 | 0.49 | 5.07 | -4.83 | -15.40 | -15.01 | -11.51 | 16.41 | 17.37 | 18.87 | 49.15 | 0.01 |
### Grains & Oilseeds
| Name | Symbol | Price | Daily (%) | 5D (%) | 1W (%) | 1M (%) | 3M (%) | 6M (%) | YTD (%) | 12M (%) | MA50 | MA100 | MA200 | RSI | MACD |
|---|---|---|---|---|---|---|---|---|---|---|---|---|---|---|---|
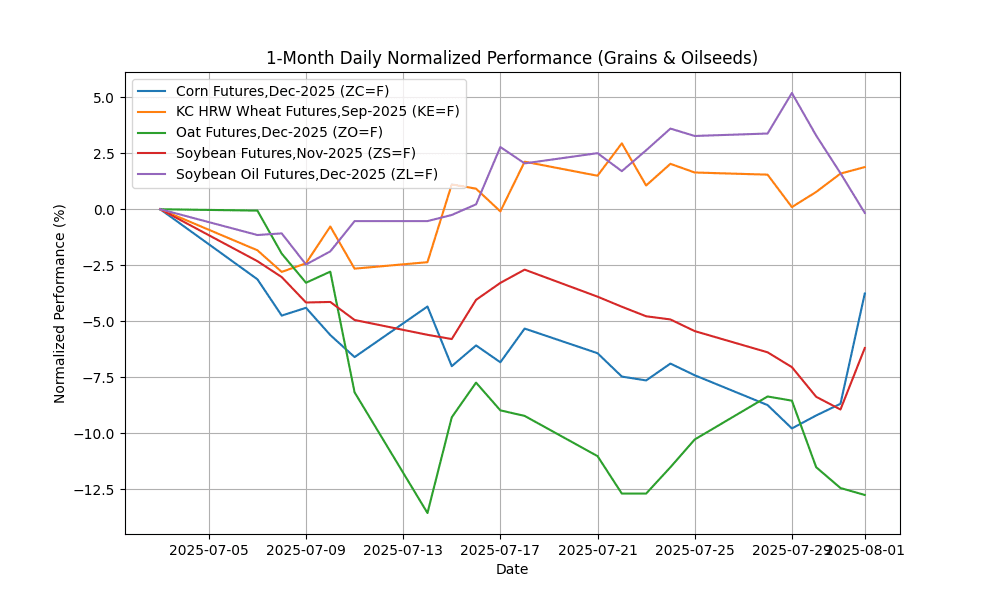
| Corn Futures,Dec-2025 | ZC=F | 415.25 | 5.39 | 3.94 | 3.94 | -3.26 | -9.97 | -13.85 | -9.43 | 8.70 | 422.91 | 441.88 | 445.86 | 54.65 | -6.73 |
| KC HRW Wheat Futures,Sep-2025 | KE=F | 527.75 | 0.29 | 0.24 | 0.24 | 0.96 | -0.14 | -8.89 | -5.63 | -4.82 | 528.17 | 538.50 | 551.56 | 52.47 | 0.20 |
| Oat Futures,Dec-2025 | ZO=F | 352.00 | -0.35 | -2.76 | -2.76 | -12.11 | -2.56 | 1.29 | 6.51 | 9.15 | 372.26 | 365.63 | 360.18 | 40.86 | -5.30 |
| Soybean Futures,Nov-2025 | ZS=F | 990.75 | 3.02 | -0.80 | -0.80 | -5.69 | -5.53 | -4.92 | -0.75 | -3.06 | 1031.74 | 1029.71 | 1018.47 | 42.80 | -15.25 |
| Soybean Oil Futures,Dec-2025 | ZL=F | 54.61 | -1.75 | -3.33 | -3.33 | -0.82 | 11.27 | 18.43 | 37.28 | 27.39 | 52.44 | 49.44 | 46.54 | 49.28 | 0.96 |
### Livestock & Meat
| Name | Symbol | Price | Daily (%) | 5D (%) | 1W (%) | 1M (%) | 3M (%) | 6M (%) | YTD (%) | 12M (%) | MA50 | MA100 | MA200 | RSI | MACD |
|---|---|---|---|---|---|---|---|---|---|---|---|---|---|---|---|
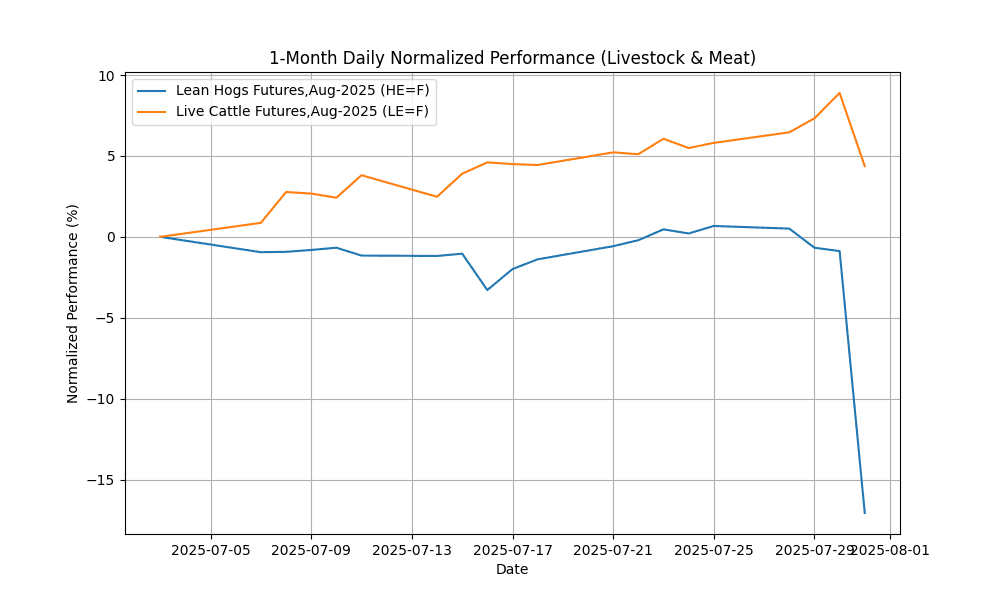
| Lean Hogs Futures,Aug-2025 | HE=F | 89.55 | -16.33 | -17.62 | -17.62 | -18.33 | -3.66 | 6.39 | 10.15 | -3.86 | 105.71 | 97.63 | 90.39 | 17.80 | -1.06 |
| Live Cattle Futures,Aug-2025 | LE=F | 223.40 | -4.15 | -1.36 | -1.36 | 5.15 | 5.83 | 9.19 | 15.24 | 20.89 | 221.61 | 215.08 | 204.11 | 49.33 | 2.16 |
### Industrial (Base Metals)
| Name | Symbol | Price | Daily (%) | 5D (%) | 1W (%) | 1M (%) | 3M (%) | 6M (%) | YTD (%) | 12M (%) | MA50 | MA100 | MA200 | RSI | MACD |
|---|---|---|---|---|---|---|---|---|---|---|---|---|---|---|---|
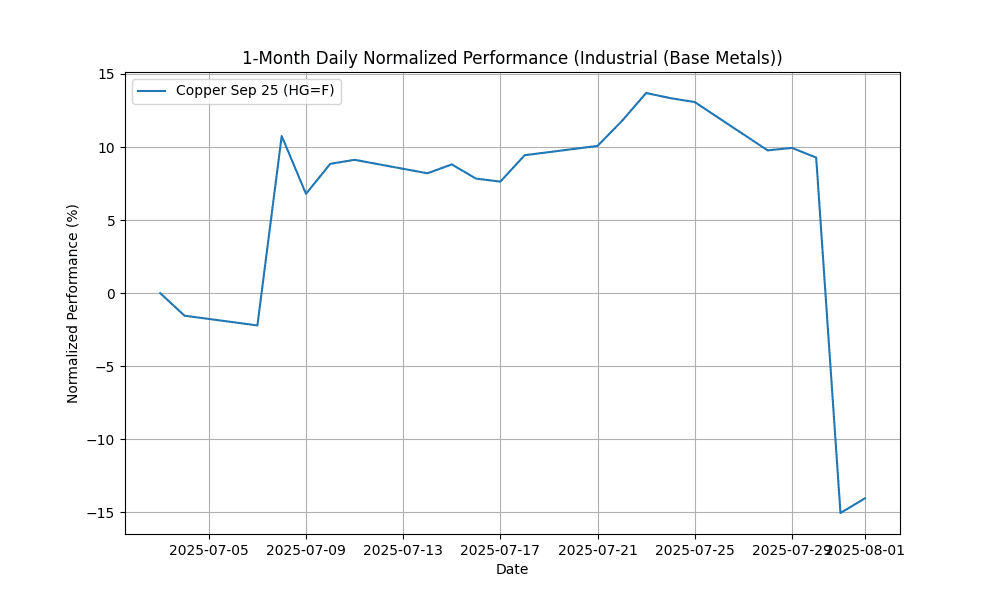
| Copper Sep 25 | HG=F | 4.38 | 1.18 | -23.98 | -23.98 | -14.91 | -5.32 | 2.80 | 9.92 | 7.75 | 5.10 | 4.92 | 4.61 | 26.60 | -0.03 |
## Technical Indicators Summary
## Oversold
– Copper Sep 25 (HG=F): RSI of 26.60.
– Lean Hogs Futures,Aug-2025 (HE=F): RSI of 17.80.
## Bullish
– Brent Crude Oil Last Day Financ (BZ=F): positive MACD of 0.65.
– Cotton Oct 25 (CT=F): positive MACD of 0.08.
– Crude Oil Sep 25 (CL=F): positive MACD of 0.54.
– Heating Oil Aug 25 (HO=F): positive MACD of 0.02.
– KC HRW Wheat Futures,Sep-2025 (KE=F): positive MACD of 0.20.
– Live Cattle Futures,Aug-2025 (LE=F): positive MACD of 2.16.
– Orange Juice Sep 25 (OJ=F): positive MACD of 10.89.
– Palladium Sep 25 (PA=F): positive MACD of 33.30.
– Platinum Oct 25 (PL=F): positive MACD of 10.32.
– RBOB Gasoline Aug 25 (RB=F): positive MACD of 0.01.
– Silver Sep 25 (SI=F): positive MACD of 0.28.
– Soybean Oil Futures,Dec-2025 (ZL=F): positive MACD of 0.96.
– Sugar #11 Oct 25 (SB=F): positive MACD of 0.01.
## Bearish
– Cocoa Sep 25 (CC=F): negative MACD of -292.26.
– Coffee Sep 25 (KC=F): negative MACD of -6.27.
– Copper Sep 25 (HG=F): negative MACD of -0.03.
– Corn Futures,Dec-2025 (ZC=F): negative MACD of -6.73.
– Gold Aug 25 (GC=F): negative MACD of -3.36.
– Lean Hogs Futures,Aug-2025 (HE=F): negative MACD of -1.06.
– Natural Gas Aug 25 (NG=F): negative MACD of -0.11.
– Oat Futures,Dec-2025 (ZO=F): negative MACD of -5.30.
– Soybean Futures,Nov-2025 (ZS=F): negative MACD of -15.25.


