# Commodities Report: Corn Futures,Dec-2025 soar by 5.97%
## Daily Performance Highlights
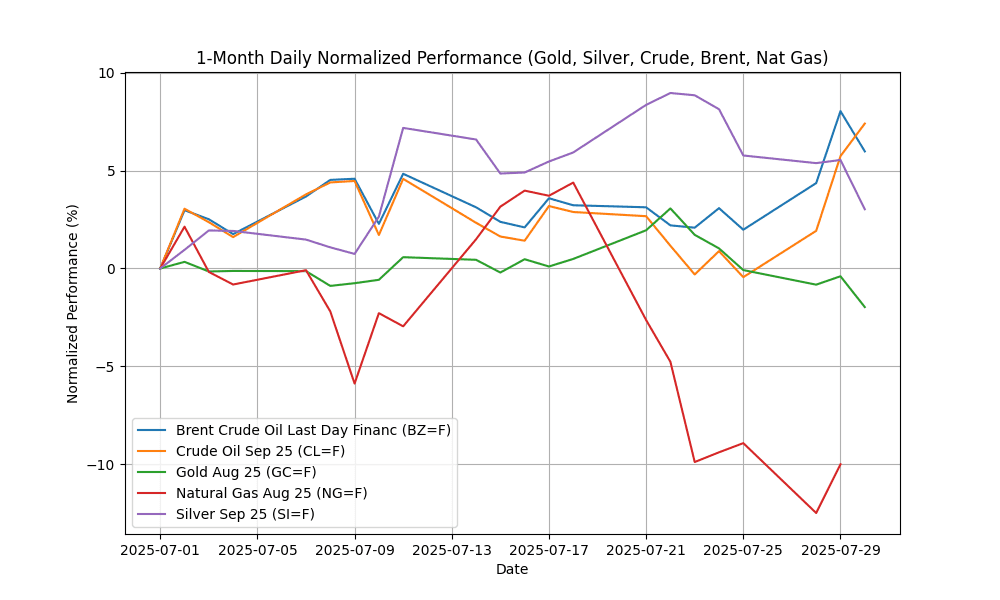
Gold Aug 25 (GC=F): Price $3270.90, Daily Change -1.58%
Crude Oil Sep 25 (CL=F): Price $70.30, Daily Change 1.57%
Largest Gainer: Corn Futures,Dec-2025 (ZC=F) (5.97%)
## 1-Month Daily Normalized Performance Chart
## Commodities News Summary
In today’s commodities market, significant developments have influenced prices and sentiment across various sectors.
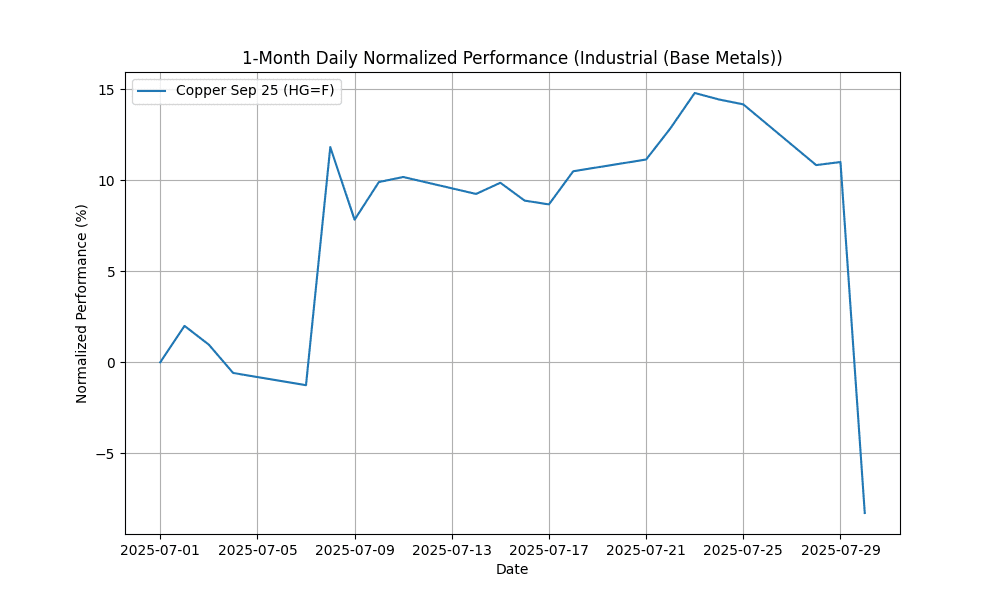
A notable shift occurred in the copper market after President Trump announced a scaled-back tariff on copper imports, leading to a sharp decline in U.S. copper prices. This unexpected move has raised concerns about market stability and future pricing dynamics.
In the crude oil sector, Brazilian oil shipments to the U.S. are set to resume following a tariff exemption, which could enhance supply and potentially impact prices. Meanwhile, Chevron has reportedly been granted a restricted U.S. license to operate in Venezuela, signaling a possible increase in Venezuelan oil production and further influencing global oil supply.
Natural gas markets are experiencing a notable trend, with a projected increase in flows from the Appalachian Basin to the Gulf Coast, driven by growing liquefied natural gas (LNG) demand. The first half of 2025 saw a decline in natural gas price volatility, indicating a return to more stable market conditions as inventories normalize.
Additionally, the U.S.-Canada energy trade remains robust, valued at approximately $151 billion in 2024, primarily due to U.S. imports from Canada. This steady trade underscores the interdependence of North American energy markets.
Overall, the commodities landscape is marked by volatility and strategic shifts, particularly in copper and oil, while natural gas appears to be stabilizing after a period of fluctuation. Market participants are closely monitoring these developments as they navigate the evolving economic landscape.
## Group Performance and Charts
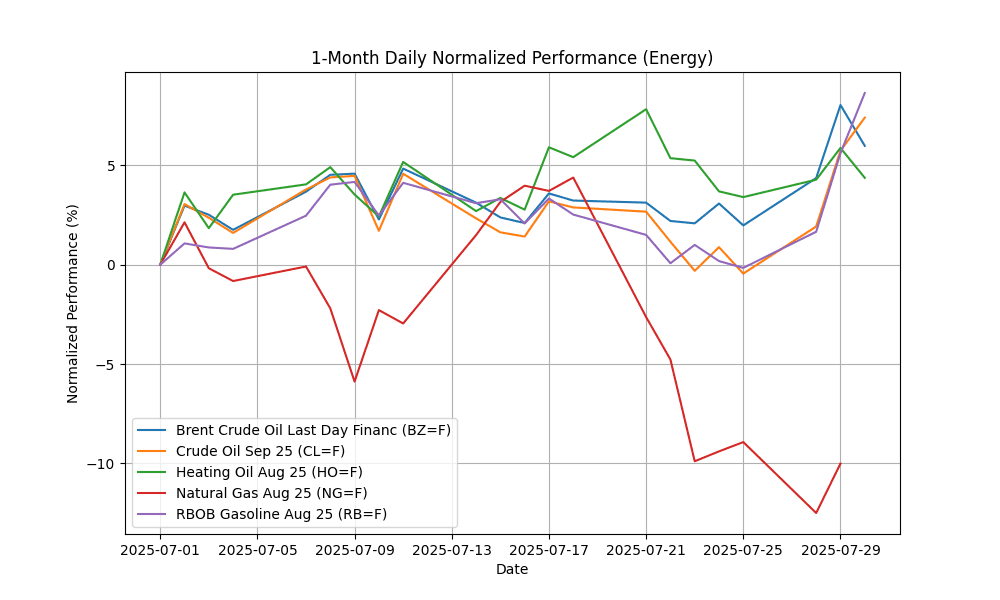
### Energy
| Name | Symbol | Price | Daily (%) | 5D (%) | 1W (%) | 1M (%) | 3M (%) | 6M (%) | YTD (%) | 12M (%) | MA50 | MA100 | MA200 | RSI | MACD |
|---|---|---|---|---|---|---|---|---|---|---|---|---|---|---|---|
| Brent Crude Oil Last Day Financ | BZ=F | 71.13 | -1.90 | 3.93 | 3.82 | 5.21 | 14.49 | -7.33 | -4.70 | -9.54 | 68.57 | 68.00 | 71.30 | 56.64 | 0.46 |
| Crude Oil Sep 25 | CL=F | 70.30 | 1.57 | 7.89 | 7.74 | 7.97 | 18.67 | -3.07 | -1.98 | -5.93 | 66.29 | 65.16 | 68.10 | 61.31 | 0.36 |
| Heating Oil Aug 25 | HO=F | 2.43 | -1.42 | 0.94 | -0.82 | 3.54 | 20.72 | -2.24 | 4.66 | 3.94 | 2.31 | 2.23 | 2.27 | 53.40 | 0.03 |
| Mont Belvieu LDH Propane (OPIS) | B0=F | N/A | N/A | N/A | N/A | N/A | N/A | N/A | N/A | N/A | N/A | N/A | N/A | N/A | N/A |
| Natural Gas Aug 25 | NG=F | 3.07 | 2.84 | -1.19 | -0.13 | -11.08 | -11.67 | 0.95 | -15.41 | 44.54 | 3.46 | 3.57 | 3.46 | 39.26 | -0.11 |
| RBOB Gasoline Aug 25 | RB=F | 2.28 | 2.87 | 8.82 | 7.58 | 9.72 | 11.36 | 12.06 | 14.01 | -4.40 | 2.14 | 2.13 | 2.08 | 65.99 | 0.01 |
### Precious Metals
| Name | Symbol | Price | Daily (%) | 5D (%) | 1W (%) | 1M (%) | 3M (%) | 6M (%) | YTD (%) | 12M (%) | MA50 | MA100 | MA200 | RSI | MACD |
|---|---|---|---|---|---|---|---|---|---|---|---|---|---|---|---|
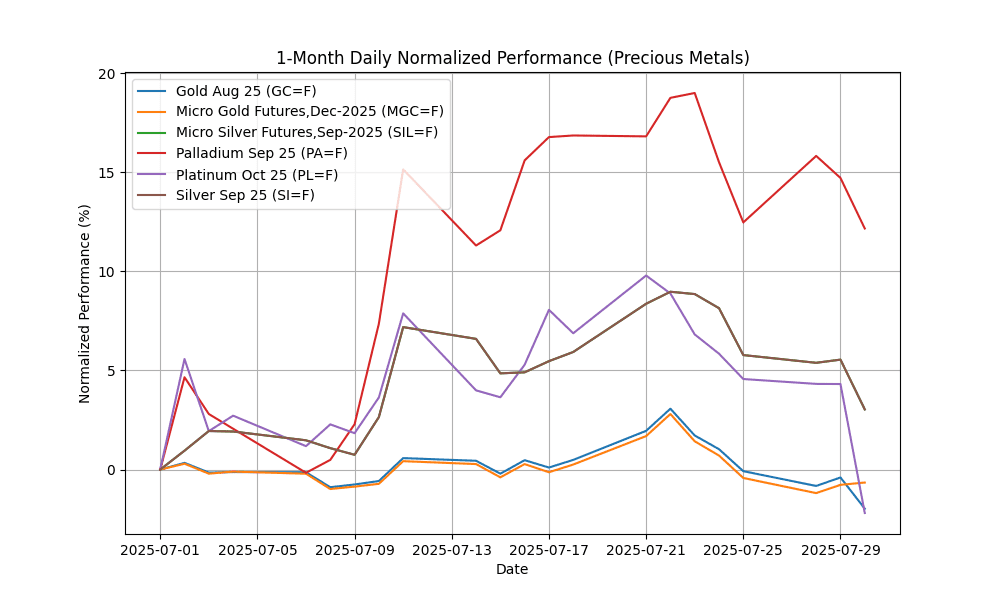
| Gold Aug 25 | GC=F | 3270.90 | -1.58 | -1.89 | -3.63 | -0.71 | 1.90 | 16.30 | 24.41 | 36.00 | 3340.13 | 3250.70 | 2992.14 | 40.24 | -2.39 |
| Micro Gold Futures,Dec-2025 | MGC=F | 3327.90 | 0.12 | -0.23 | -2.05 | 0.61 | 3.28 | 18.33 | 26.01 | 38.37 | 3345.05 | 3255.27 | 2996.03 | 46.71 | 0.88 |
| Micro Silver Futures,Sep-2025 | SIL=F | 37.18 | -2.37 | -2.59 | -5.34 | 3.70 | 15.51 | 15.72 | 28.47 | 31.08 | 36.30 | 34.54 | 33.05 | 47.15 | 0.55 |
| Palladium Sep 25 | PA=F | 1240.00 | -2.22 | -0.27 | -5.75 | 12.51 | 31.96 | 16.22 | 37.34 | 41.23 | 1118.73 | 1032.07 | 1010.55 | 55.23 | 46.97 |
| Platinum Oct 25 | PL=F | 1316.40 | -6.24 | -6.47 | -8.44 | -1.32 | 36.44 | 27.41 | 47.25 | 36.41 | 1285.17 | 1128.18 | 1048.65 | 42.47 | 28.00 |
| Silver Sep 25 | SI=F | 37.17 | -2.39 | -2.60 | -5.35 | 3.69 | 15.49 | 15.71 | 28.46 | 31.06 | 36.30 | 34.54 | 33.05 | 47.11 | 0.55 |
### Agricultural (Soft Commodities)
| Name | Symbol | Price | Daily (%) | 5D (%) | 1W (%) | 1M (%) | 3M (%) | 6M (%) | YTD (%) | 12M (%) | MA50 | MA100 | MA200 | RSI | MACD |
|---|---|---|---|---|---|---|---|---|---|---|---|---|---|---|---|
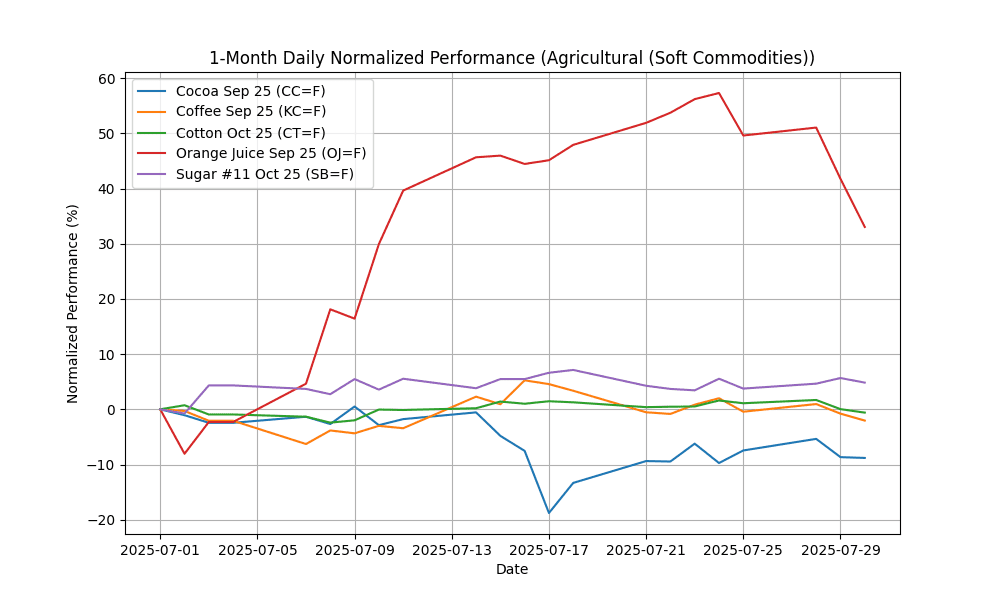
| Cocoa Sep 25 | CC=F | 8207.00 | -0.16 | -1.46 | -2.76 | -12.28 | -8.54 | -25.30 | -29.70 | 0.87 | 9179.70 | 8953.48 | 9246.99 | 44.15 | -262.64 |
| Coffee Sep 25 | KC=F | 292.75 | -1.26 | -1.61 | -2.85 | -4.56 | -26.02 | -22.52 | -8.44 | 26.84 | 322.59 | 353.62 | 339.73 | 40.33 | -6.41 |
| Cotton Oct 25 | CT=F | 65.88 | -0.63 | -1.69 | -1.11 | -0.60 | 0.41 | 0.00 | -3.68 | -3.33 | 65.95 | 66.25 | 67.39 | 45.83 | 0.19 |
| Orange Juice Sep 25 | OJ=F | 286.65 | -6.15 | -11.07 | -14.83 | 31.70 | 4.73 | -39.61 | -42.38 | -32.61 | 272.75 | 268.77 | 366.68 | 48.03 | 16.03 |
| Random Length Lumber Futures | LBS=F | N/A | N/A | N/A | N/A | N/A | N/A | N/A | N/A | N/A | N/A | N/A | N/A | N/A | N/A |
| Sugar #11 Oct 25 | SB=F | 16.46 | -0.78 | 1.04 | 1.35 | 6.33 | -4.08 | -14.94 | -14.54 | -13.91 | 16.46 | 17.42 | 18.93 | 50.75 | 0.02 |
### Grains & Oilseeds
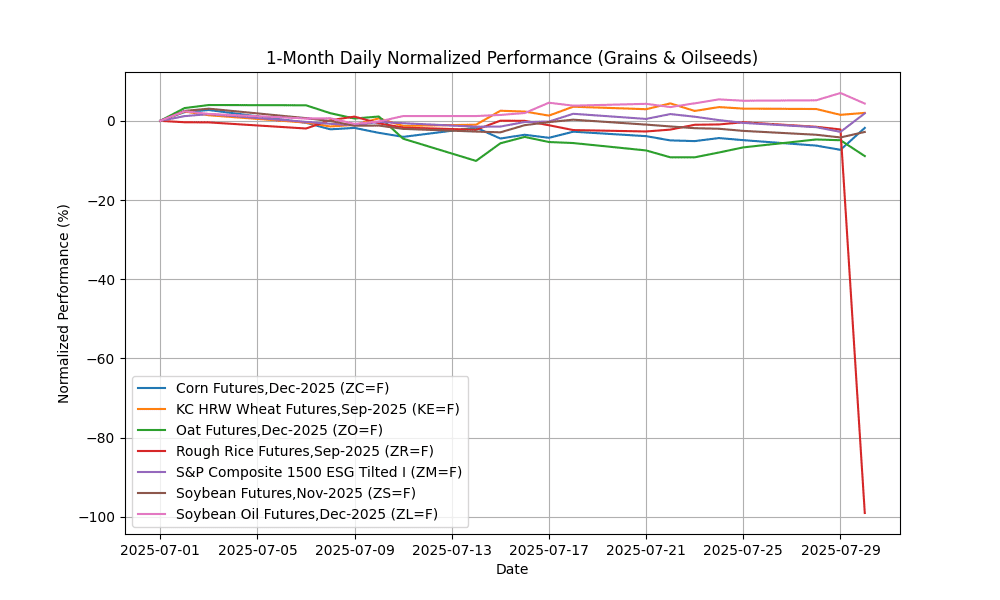
| Name | Symbol | Price | Daily (%) | 5D (%) | 1W (%) | 1M (%) | 3M (%) | 6M (%) | YTD (%) | 12M (%) | MA50 | MA100 | MA200 | RSI | MACD |
|---|---|---|---|---|---|---|---|---|---|---|---|---|---|---|---|
| Corn Futures,Dec-2025 | ZC=F | 412.50 | 5.97 | 3.25 | 3.51 | -1.90 | -11.15 | -14.42 | -10.03 | 6.11 | 425.18 | 443.13 | 446.04 | 51.29 | -7.27 |
| KC HRW Wheat Futures,Sep-2025 | KE=F | 521.00 | 0.48 | -1.04 | -0.48 | 2.96 | 0.97 | -10.06 | -6.84 | -5.32 | 528.25 | 539.12 | 552.26 | 48.55 | -0.55 |
| Oat Futures,Dec-2025 | ZO=F | 353.50 | -4.20 | -2.35 | 0.35 | -8.60 | -3.15 | 1.73 | 6.96 | 8.44 | 372.37 | 365.81 | 360.40 | 41.69 | -4.50 |
| S&P Composite 1500 ESG Tilted I | ZM=F | 274.30 | 4.81 | 2.43 | 0.85 | 1.11 | -4.26 | -8.90 | -10.83 | -22.07 | 280.90 | 286.81 | 292.24 | 52.30 | -3.00 |
| Soybean Futures,Nov-2025 | ZS=F | 996.00 | 1.45 | -0.28 | -0.97 | -2.76 | -4.25 | -4.41 | -0.23 | -3.04 | 1035.34 | 1030.57 | 1018.85 | 40.77 | -12.17 |
| Soybean Oil Futures,Dec-2025 | ZL=F | 56.11 | -2.49 | -0.67 | -0.05 | 6.86 | 13.68 | 21.69 | 41.05 | 31.25 | 52.21 | 49.18 | 46.42 | 59.27 | 1.26 |
### Livestock & Meat
| Name | Symbol | Price | Daily (%) | 5D (%) | 1W (%) | 1M (%) | 3M (%) | 6M (%) | YTD (%) | 12M (%) | MA50 | MA100 | MA200 | RSI | MACD |
|---|---|---|---|---|---|---|---|---|---|---|---|---|---|---|---|
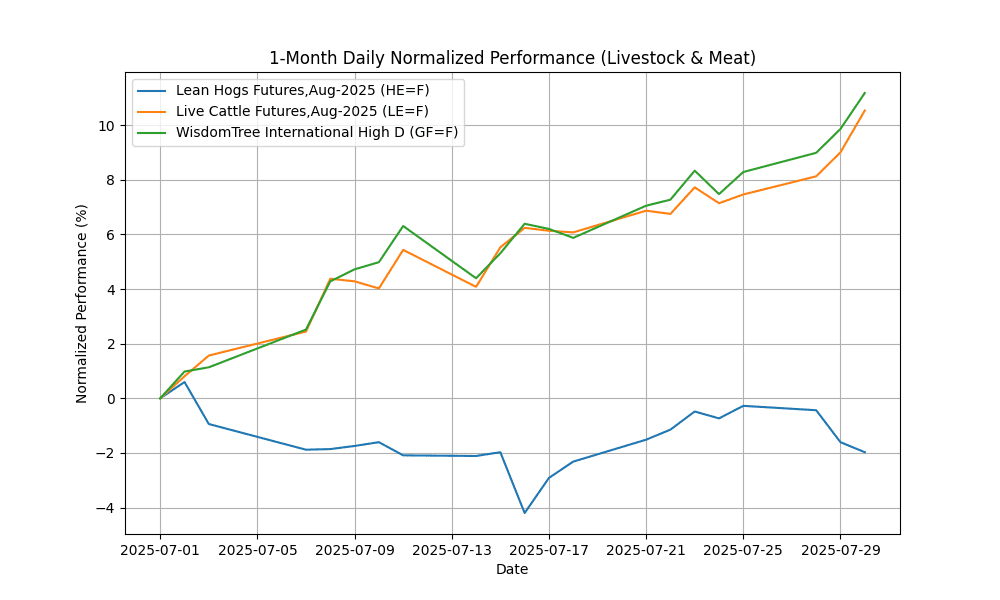
| Lean Hogs Futures,Aug-2025 | HE=F | 106.85 | -0.37 | -1.70 | -1.50 | -2.95 | 15.64 | 26.94 | 31.43 | 17.16 | 105.91 | 97.61 | 90.36 | 48.72 | 0.40 |
| Live Cattle Futures,Aug-2025 | LE=F | 232.95 | 1.40 | 2.86 | 2.61 | 3.13 | 11.11 | 13.86 | 20.17 | 24.11 | 221.40 | 214.84 | 203.94 | 69.56 | 2.59 |
| WisdomTree International High D | GF=F | 340.23 | 1.20 | 2.67 | 2.62 | 9.51 | 16.03 | 23.39 | 29.35 | 32.40 | 312.08 | 300.30 | 280.79 | 76.33 | 7.25 |
### Industrial (Base Metals)
| Name | Symbol | Price | Daily (%) | 5D (%) | 1W (%) | 1M (%) | 3M (%) | 6M (%) | YTD (%) | 12M (%) | MA50 | MA100 | MA200 | RSI | MACD |
|---|---|---|---|---|---|---|---|---|---|---|---|---|---|---|---|
| Copper Sep 25 | HG=F | 4.63 | -17.37 | -19.67 | -20.10 | -7.95 | 1.07 | 8.63 | 16.16 | 13.96 | 5.09 | 4.92 | 4.61 | 29.81 | 0.09 |
## Technical Indicators Summary
## Overbought
– WisdomTree International High D (GF=F): RSI of 76.33.
## Oversold
– Copper Sep 25 (HG=F): RSI of 29.81.
– Rough Rice Futures,Sep-2025 (ZR=F): RSI of 4.58.
## Bullish
– Brent Crude Oil Last Day Financ (BZ=F): positive MACD of 0.46.
– Copper Sep 25 (HG=F): positive MACD of 0.09.
– Cotton Oct 25 (CT=F): positive MACD of 0.19.
– Crude Oil Sep 25 (CL=F): positive MACD of 0.36.
– Heating Oil Aug 25 (HO=F): positive MACD of 0.03.
– Lean Hogs Futures,Aug-2025 (HE=F): positive MACD of 0.40.
– Live Cattle Futures,Aug-2025 (LE=F): positive MACD of 2.59.
– Micro Gold Futures,Dec-2025 (MGC=F): positive MACD of 0.88.
– Micro Silver Futures,Sep-2025 (SIL=F): positive MACD of 0.55.
– Orange Juice Sep 25 (OJ=F): positive MACD of 16.03.
– Palladium Sep 25 (PA=F): positive MACD of 46.97.
– Platinum Oct 25 (PL=F): positive MACD of 28.00.
– RBOB Gasoline Aug 25 (RB=F): positive MACD of 0.01.
– Silver Sep 25 (SI=F): positive MACD of 0.55.
– Soybean Oil Futures,Dec-2025 (ZL=F): positive MACD of 1.26.
– Sugar #11 Oct 25 (SB=F): positive MACD of 0.02.
– WisdomTree International High D (GF=F): positive MACD of 7.25.
## Bearish
– Cocoa Sep 25 (CC=F): negative MACD of -262.64.
– Coffee Sep 25 (KC=F): negative MACD of -6.41.
– Corn Futures,Dec-2025 (ZC=F): negative MACD of -7.27.
– Gold Aug 25 (GC=F): negative MACD of -2.39.
– KC HRW Wheat Futures,Sep-2025 (KE=F): negative MACD of -0.55.
– Natural Gas Aug 25 (NG=F): negative MACD of -0.11.
– Oat Futures,Dec-2025 (ZO=F): negative MACD of -4.50.
– Rough Rice Futures,Sep-2025 (ZR=F): negative MACD of -113.93.
– S&P Composite 1500 ESG Tilted I (ZM=F): negative MACD of -3.00.
– Soybean Futures,Nov-2025 (ZS=F): negative MACD of -12.17.


