## Daily Performance Highlights
Gold Aug 25 (GC=F): Price $N/A, Daily Change N/A%
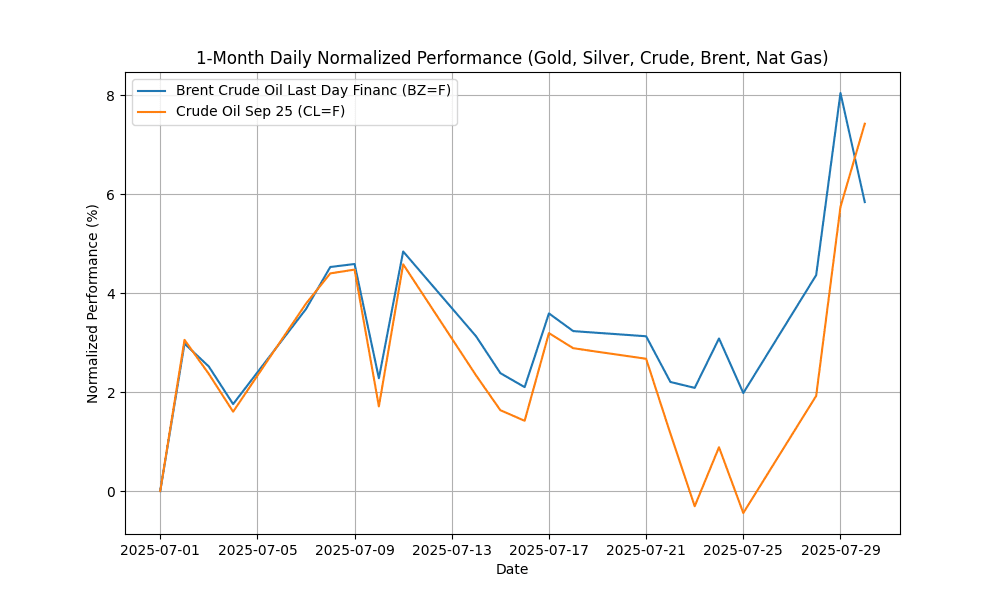
Crude Oil Sep 25 (CL=F): Price $70.31, Daily Change 1.59%
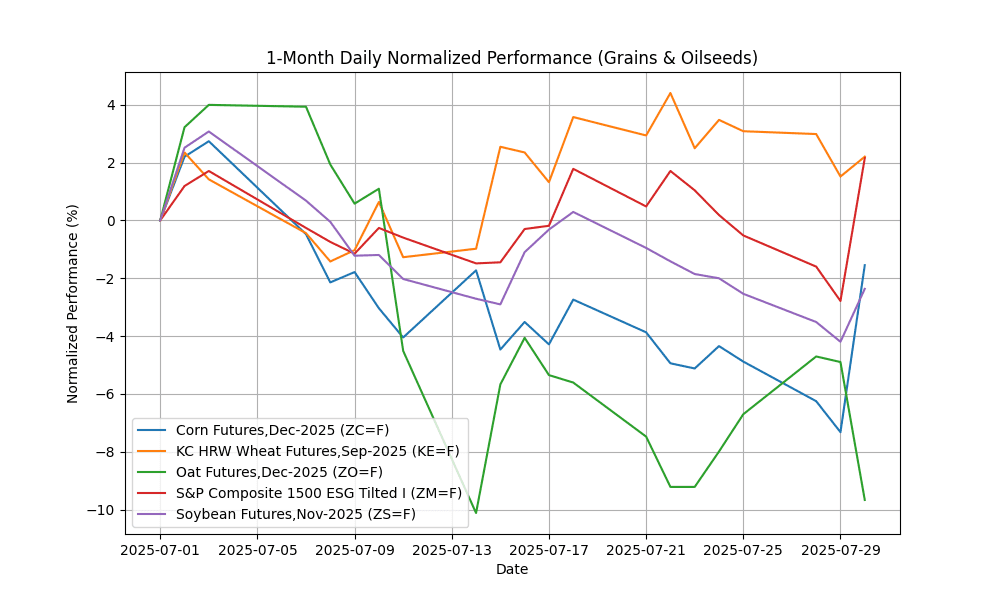
Largest Gainer: Corn Futures,Dec-2025 (ZC=F) (6.23%)
## 1-Month Daily Normalized Performance Chart
## Commodities News Summary
In recent commodities news, crude oil prices experienced a modest uptick as investors reacted to geopolitical developments, particularly former President Trump’s comments regarding tariffs and Russia. The market is also closely monitoring the implications of a newly granted restricted U.S. license for Chevron to operate in Venezuela, which could influence supply dynamics.
U.S. jet fuel demand has surged to its highest level since December 2017, indicating robust recovery in the aviation sector. This increase may further support crude oil prices as demand for refined products rises. In related news, onshore crude oil production from federal lands has reached a record high of 1.7 million barrels per day in 2024, primarily driven by activity in New Mexico’s Permian Basin.
Natural gas markets are showing signs of stabilization, with average price volatility declining in the first half of 2025. This trend reflects a return to typical seasonal patterns and is attributed to improved storage levels nearing the five-year average, following a period of significant fluctuations.
In agricultural markets, the ongoing trade tensions, particularly the announcement of a 25% tariff on Indian imports starting August 1, may create ripples in commodity pricing and trade flows. Overall, the market sentiment remains cautious but optimistic, with a focus on how these developments will shape future commodity prices and trade relationships.
## Group Performance and Charts
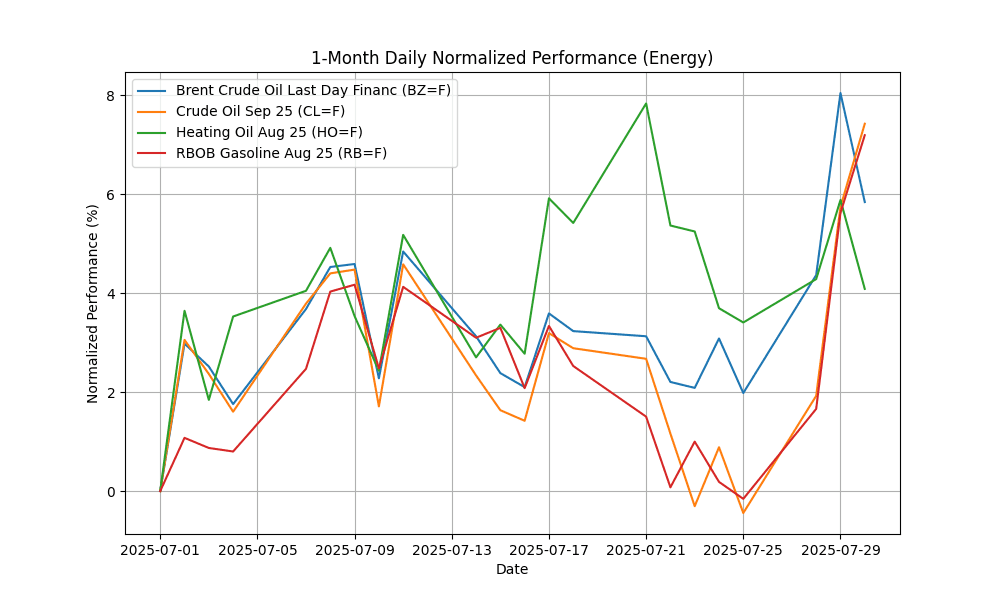
### Energy
| Name | Symbol | Price | Daily (%) | 5D (%) | 1W (%) | 1M (%) | 3M (%) | 6M (%) | YTD (%) | 12M (%) | MA50 | MA100 | MA200 | RSI | MACD |
|---|---|---|---|---|---|---|---|---|---|---|---|---|---|---|---|
| Brent Crude Oil Last Day Financ | BZ=F | 71.03 | -2.04 | 3.78 | 3.68 | 5.06 | 14.32 | -7.46 | -4.84 | -9.67 | 68.57 | 68.00 | 71.30 | 56.24 | 0.45 |
| Crude Oil Sep 25 | CL=F | 70.31 | 1.59 | 7.90 | 7.75 | 7.99 | 18.69 | -3.06 | -1.97 | -5.91 | 66.29 | 65.16 | 68.10 | 61.34 | 0.36 |
| Heating Oil Aug 25 | HO=F | 2.42 | -1.70 | 0.66 | -1.10 | 3.25 | 20.38 | -2.52 | 4.37 | 3.65 | 2.31 | 2.23 | 2.27 | 52.69 | 0.03 |
| RBOB Gasoline Aug 25 | RB=F | 2.25 | 1.49 | 7.36 | 6.13 | 8.25 | 9.87 | 10.55 | 12.49 | -5.68 | 2.14 | 2.13 | 2.08 | 63.42 | 0.01 |
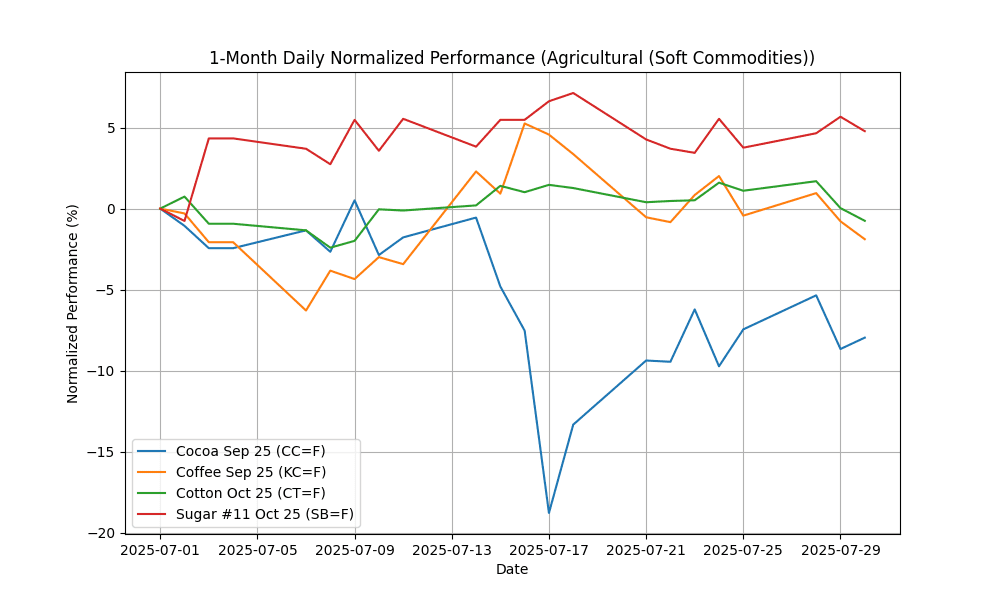
### Agricultural (Soft Commodities)
| Name | Symbol | Price | Daily (%) | 5D (%) | 1W (%) | 1M (%) | 3M (%) | 6M (%) | YTD (%) | 12M (%) | MA50 | MA100 | MA200 | RSI | MACD |
|---|---|---|---|---|---|---|---|---|---|---|---|---|---|---|---|
| Cocoa Sep 25 | CC=F | 8283.00 | 0.77 | -0.55 | -1.86 | -11.47 | -7.69 | -24.61 | -29.05 | 1.81 | 9181.22 | 8954.24 | 9247.36 | 45.25 | -256.58 |
| Coffee Sep 25 | KC=F | 293.20 | -1.11 | -1.46 | -2.70 | -4.42 | -25.90 | -22.40 | -8.30 | 27.04 | 322.60 | 353.63 | 339.74 | 40.56 | -6.37 |
| Cotton Oct 25 | CT=F | 65.78 | -0.78 | -1.84 | -1.26 | -0.75 | 0.26 | -0.15 | -3.83 | -3.48 | 65.95 | 66.25 | 67.39 | 45.15 | 0.19 |
| Sugar #11 Oct 25 | SB=F | 16.45 | -0.84 | 0.98 | 1.29 | 6.27 | -4.14 | -14.99 | -14.59 | -13.96 | 16.46 | 17.42 | 18.93 | 50.58 | 0.02 |
### Grains & Oilseeds
| Name | Symbol | Price | Daily (%) | 5D (%) | 1W (%) | 1M (%) | 3M (%) | 6M (%) | YTD (%) | 12M (%) | MA50 | MA100 | MA200 | RSI | MACD |
|---|---|---|---|---|---|---|---|---|---|---|---|---|---|---|---|
| Corn Futures,Dec-2025 | ZC=F | 413.50 | 6.23 | 3.50 | 3.76 | -1.66 | -10.93 | -14.21 | -9.81 | 6.37 | 425.20 | 443.14 | 446.04 | 51.85 | -7.19 |
| KC HRW Wheat Futures,Sep-2025 | KE=F | 522.00 | 0.68 | -0.85 | -0.29 | 3.16 | 1.16 | -9.88 | -6.66 | -5.13 | 528.27 | 539.13 | 552.26 | 49.12 | -0.47 |
| Oat Futures,Dec-2025 | ZO=F | 350.50 | -5.01 | -3.18 | -0.50 | -9.37 | -3.97 | 0.86 | 6.05 | 7.52 | 372.31 | 365.78 | 360.38 | 40.45 | -4.74 |
| S&P Composite 1500 ESG Tilted I | ZM=F | 275.00 | 5.08 | 2.69 | 1.10 | 1.36 | -4.01 | -8.67 | -10.60 | -21.88 | 280.92 | 286.81 | 292.24 | 53.06 | -2.94 |
| Soybean Futures,Nov-2025 | ZS=F | 1000.50 | 1.91 | 0.18 | -0.52 | -2.32 | -3.82 | -3.98 | 0.23 | -2.60 | 1035.42 | 1030.62 | 1018.88 | 43.00 | -11.81 |
### Livestock & Meat
| Name | Symbol | Price | Daily (%) | 5D (%) | 1W (%) | 1M (%) | 3M (%) | 6M (%) | YTD (%) | 12M (%) | MA50 | MA100 | MA200 | RSI | MACD |
|---|---|---|---|---|---|---|---|---|---|---|---|---|---|---|---|
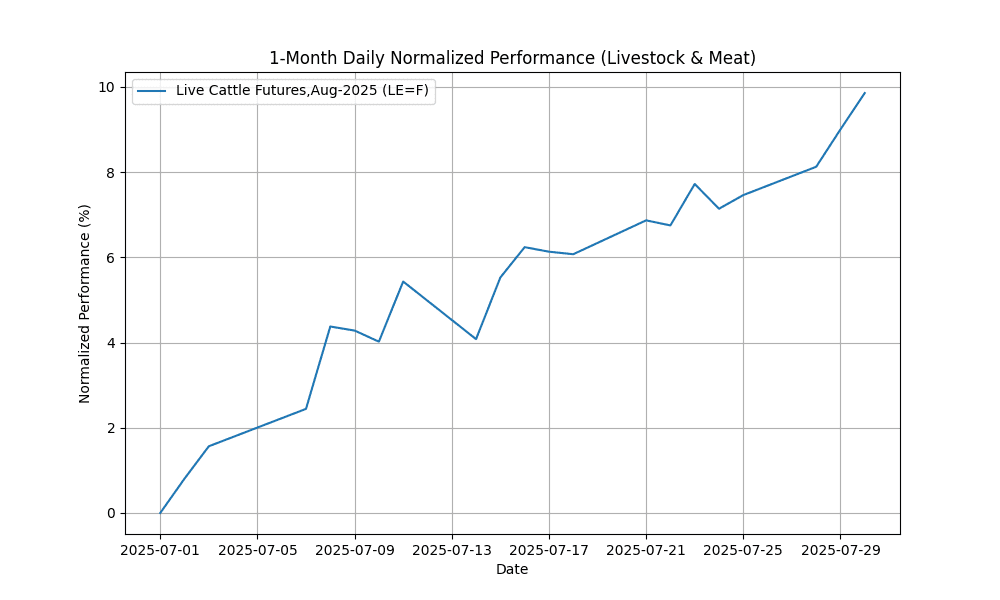
| Live Cattle Futures,Aug-2025 | LE=F | 231.52 | 0.78 | 2.23 | 1.98 | 2.50 | 10.43 | 13.16 | 19.44 | 23.35 | 221.37 | 214.83 | 203.93 | 67.72 | 2.48 |
### Precious Metals
| Name | Symbol | Price | Daily (%) | 5D (%) | 1W (%) | 1M (%) | 3M (%) | 6M (%) | YTD (%) | 12M (%) | MA50 | MA100 | MA200 | RSI | MACD |
|---|
### Industrial (Base Metals)
| Name | Symbol | Price | Daily (%) | 5D (%) | 1W (%) | 1M (%) | 3M (%) | 6M (%) | YTD (%) | 12M (%) | MA50 | MA100 | MA200 | RSI | MACD |
|---|
### Financial Futures
| Name | Symbol | Price | Daily (%) | 5D (%) | 1W (%) | 1M (%) | 3M (%) | 6M (%) | YTD (%) | 12M (%) | MA50 | MA100 | MA200 | RSI | MACD |
|---|---|---|---|---|---|---|---|---|---|---|---|---|---|---|---|
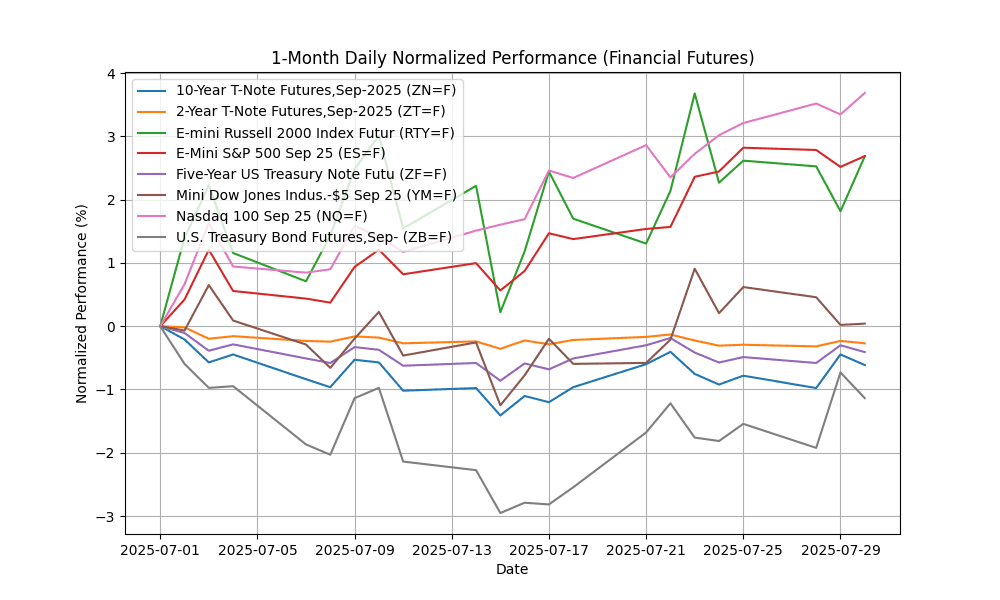
| 10-Year T-Note Futures,Sep-2025 | ZN=F | 111.17 | -0.17 | 0.17 | 0.14 | -0.85 | -0.61 | 2.14 | 2.23 | -0.35 | 110.88 | 110.96 | 110.37 | 52.12 | 0.01 |
| 2-Year T-Note Futures,Sep-2025 | ZT=F | 103.61 | -0.04 | 0.02 | -0.05 | -0.18 | -0.29 | 0.78 | 0.62 | 0.94 | 103.55 | 103.57 | 103.23 | 49.12 | 0.00 |
| E-mini Russell 2000 Index Futur | RTY=F | 2272.80 | 0.85 | 0.07 | -0.96 | 3.70 | 14.67 | -0.98 | 1.02 | 0.61 | 2177.92 | 2086.60 | 2188.38 | 58.08 | 25.59 |
| E-Mini S&P 500 Sep 25 | ES=F | 6416.75 | 0.17 | -0.13 | 0.32 | 2.61 | 14.11 | 5.76 | 8.10 | 17.25 | 6150.91 | 5868.08 | 5925.03 | 72.21 | 77.69 |
| Five-Year US Treasury Note Futu | ZF=F | 108.33 | -0.11 | 0.08 | 0.01 | -0.49 | -0.54 | 1.82 | 1.66 | 0.54 | 108.16 | 108.13 | 107.49 | 51.24 | 0.01 |
| Mini Dow Jones Indus.-$5 Sep 25 | YM=F | 44825.00 | 0.02 | -0.57 | -0.86 | 0.98 | 9.72 | 0.28 | 4.55 | 9.44 | 43596.00 | 42360.47 | 43031.40 | 57.56 | 368.17 |
| Nasdaq 100 Sep 25 | NQ=F | 23529.00 | 0.33 | 0.46 | 0.94 | 2.78 | 18.41 | 8.98 | 10.85 | 24.25 | 22393.17 | 20978.79 | 21087.98 | 72.80 | 324.17 |
| U.S. Treasury Bond Futures,Sep- | ZB=F | 114.06 | -0.41 | 0.41 | 0.63 | -1.22 | -1.56 | 0.14 | 0.19 | -5.10 | 113.45 | 114.61 | 115.38 | 53.45 | -0.00 |
## Technical Indicators Summary
10-Year T-Note Futures,Sep-2025 exhibits bullish momentum as indicated by a positive MACD of 0.01.
2-Year T-Note Futures,Sep-2025 exhibits bullish momentum as indicated by a positive MACD of 0.00.
Brent Crude Oil Last Day Financ exhibits bullish momentum as indicated by a positive MACD of 0.45.
Bearish signals are present in Cocoa Sep 25 with a negative MACD of -256.58.
Bearish signals are present in Coffee Sep 25 with a negative MACD of -6.37.
Bearish signals are present in Corn Futures,Dec-2025 with a negative MACD of -7.19.
Cotton Oct 25 exhibits bullish momentum as indicated by a positive MACD of 0.19.
Crude Oil Sep 25 exhibits bullish momentum as indicated by a positive MACD of 0.36.
E-mini Russell 2000 Index Futur exhibits bullish momentum as indicated by a positive MACD of 25.59.
The E-Mini S&P 500 Sep 25 market shows signs of overbought conditions with an RSI of 72.21. E-Mini S&P 500 Sep 25 exhibits bullish momentum as indicated by a positive MACD of 77.69.
Five-Year US Treasury Note Futu exhibits bullish momentum as indicated by a positive MACD of 0.01.
Heating Oil Aug 25 exhibits bullish momentum as indicated by a positive MACD of 0.03.
Bearish signals are present in KC HRW Wheat Futures,Sep-2025 with a negative MACD of -0.47.
Live Cattle Futures,Aug-2025 exhibits bullish momentum as indicated by a positive MACD of 2.48.
Mini Dow Jones Indus.-$5 Sep 25 exhibits bullish momentum as indicated by a positive MACD of 368.17.
The Nasdaq 100 Sep 25 market shows signs of overbought conditions with an RSI of 72.80. Nasdaq 100 Sep 25 exhibits bullish momentum as indicated by a positive MACD of 324.17.
Bearish signals are present in Oat Futures,Dec-2025 with a negative MACD of -4.74.
RBOB Gasoline Aug 25 exhibits bullish momentum as indicated by a positive MACD of 0.01.
Bearish signals are present in S&P Composite 1500 ESG Tilted I with a negative MACD of -2.94.
Bearish signals are present in Soybean Futures,Nov-2025 with a negative MACD of -11.81.
Sugar #11 Oct 25 exhibits bullish momentum as indicated by a positive MACD of 0.02.
Bearish signals are present in U.S. Treasury Bond Futures,Sep- with a negative MACD of -0.00.


