## Daily Performance Highlights
Crude Oil Sep 25 (CL=F): Price $62.53, Daily Change 0.29%
Largest Gainer: Corn Futures,Dec-2025 (ZC=F) (6.32%)
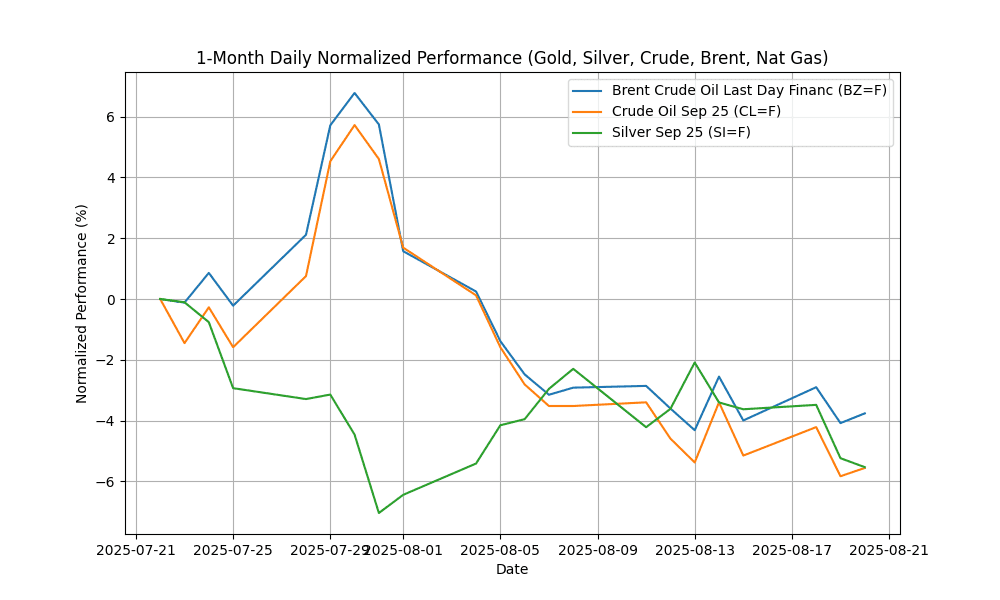
## 1-Month Daily Normalized Performance Chart
## Commodities News Summary
In today’s commodities market, oil prices showed an upward trend, buoyed by a decrease in U.S. crude inventories and speculation surrounding potential peace talks between Russia and Ukraine. The market is closely monitoring these geopolitical developments, which could further influence supply dynamics.
Gold prices remained stable amid growing uncertainty regarding interest rates, particularly as investors await insights from the upcoming Jackson Hole Economic Symposium. This event is anticipated to provide clarity on monetary policy, which could impact gold’s appeal as a safe-haven asset.
In the rare earth metals sector, China’s exports of rare earth magnets reached a six-month high in July, signaling robust demand for these critical materials, which are essential for various high-tech applications. This surge may reflect broader trends in manufacturing and technology sectors.
Meanwhile, U.S. natural gas storage levels are projected to remain above average, with forecasts indicating inventories could reach 3,872 billion cubic feet by the end of October. This marks a significant increase compared to historical averages, driven by consistent net injections earlier in the season.
Additionally, the U.S. continues to expand its role in the global energy market, exporting approximately 30% of its domestic energy production in 2024, predominantly in fossil fuels. This trend underscores the country’s growing influence in the international energy landscape.
Overall, market sentiment is shaped by geopolitical tensions, economic indicators, and evolving supply-demand dynamics across various commodities, leading to cautious optimism among investors.
## Group Performance and Charts
### Energy
| Name | Symbol | Price | Daily (%) | 5D (%) | 1W (%) | 1M (%) | 3M (%) | 6M (%) | YTD (%) | 12M (%) | MA50 | MA100 | MA200 | RSI | MACD |
|---|---|---|---|---|---|---|---|---|---|---|---|---|---|---|---|
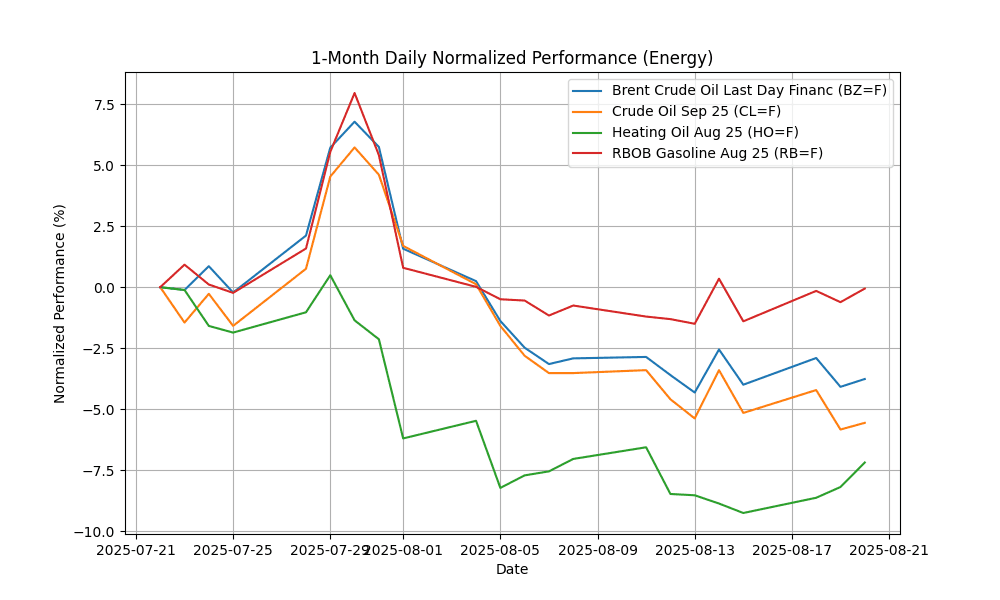
| Brent Crude Oil Last Day Financ | BZ=F | 66.01 | 0.33 | 0.24 | 0.58 | -4.62 | 2.44 | -11.31 | -11.56 | -14.49 | 69.23 | 67.36 | 70.80 | 41.95 | -0.90 |
| Crude Oil Sep 25 | CL=F | 62.53 | 0.29 | -0.43 | -0.19 | -6.95 | 2.17 | -11.18 | -12.81 | -15.55 | 66.82 | 64.61 | 67.66 | 39.47 | -1.12 |
| Heating Oil Aug 25 | HO=F | 2.28 | 1.09 | 2.28 | 1.47 | -9.31 | 7.47 | -6.44 | -1.93 | 0.55 | 2.36 | 2.23 | 2.28 | 45.31 | -0.03 |
| RBOB Gasoline Aug 25 | RB=F | 2.10 | 0.56 | 1.36 | 1.46 | -1.46 | -1.43 | 3.65 | 4.96 | -6.90 | 2.14 | 2.12 | 2.08 | 47.99 | -0.01 |
### Agricultural (Soft Commodities)
| Name | Symbol | Price | Daily (%) | 5D (%) | 1W (%) | 1M (%) | 3M (%) | 6M (%) | YTD (%) | 12M (%) | MA50 | MA100 | MA200 | RSI | MACD |
|---|---|---|---|---|---|---|---|---|---|---|---|---|---|---|---|
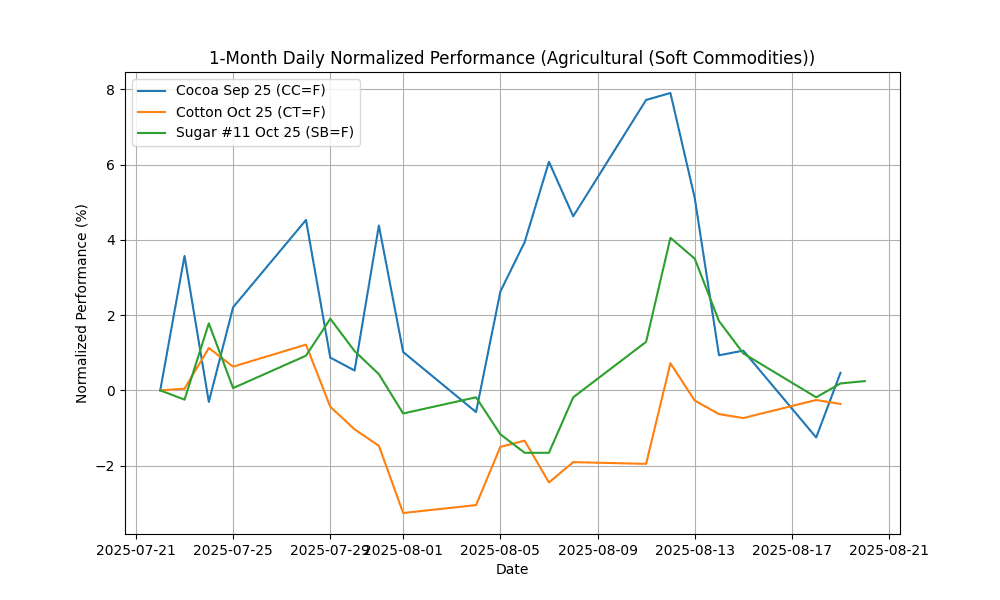
| Cocoa Sep 25 | CC=F | 8187.00 | 1.74 | -0.58 | -4.42 | 0.38 | -20.34 | -8.36 | -29.88 | -13.69 | 8740.58 | 9007.12 | 9322.72 | 44.82 | -106.10 |
| Cotton Oct 25 | CT=F | 66.35 | -0.11 | 0.38 | -0.09 | -0.29 | 1.10 | 0.41 | -3.00 | -3.56 | 65.97 | 66.18 | 67.02 | 52.43 | 0.03 |
| Sugar #11 Oct 25 | SB=F | 16.32 | 0.06 | -0.73 | -3.15 | -0.31 | -6.21 | -23.42 | -15.26 | -7.11 | 16.27 | 16.97 | 18.49 | 48.33 | 0.01 |
### Grains & Oilseeds
| Name | Symbol | Price | Daily (%) | 5D (%) | 1W (%) | 1M (%) | 3M (%) | 6M (%) | YTD (%) | 12M (%) | MA50 | MA100 | MA200 | RSI | MACD |
|---|---|---|---|---|---|---|---|---|---|---|---|---|---|---|---|
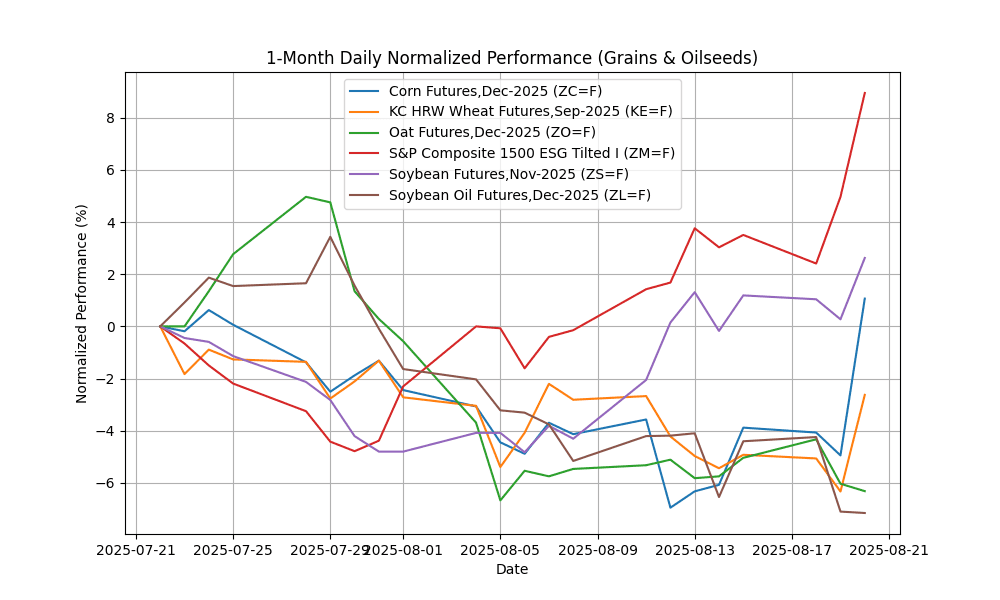
| Corn Futures,Dec-2025 | ZC=F | 403.50 | 6.32 | 5.15 | 7.89 | -0.06 | -12.85 | -17.86 | -12.00 | 7.60 | 405.49 | 431.90 | 443.85 | 57.88 | -5.85 |
| KC HRW Wheat Futures,Sep-2025 | KE=F | 519.25 | 3.95 | 2.42 | 2.47 | -1.24 | -3.84 | -14.77 | -7.15 | -4.90 | 521.30 | 529.58 | 547.03 | 52.30 | -3.80 |
| Oat Futures,Dec-2025 | ZO=F | 330.00 | -0.30 | -1.35 | -0.53 | -8.08 | -8.14 | -8.14 | -0.15 | -0.15 | 361.79 | 361.31 | 356.94 | 35.62 | -9.23 |
| S&P Composite 1500 ESG Tilted I | ZM=F | 298.30 | 3.79 | 5.26 | 5.00 | 10.28 | -0.07 | 1.19 | -3.02 | -4.48 | 275.33 | 283.74 | 289.65 | 72.98 | 4.35 |
| Soybean Futures,Nov-2025 | ZS=F | 1036.75 | 2.34 | 1.42 | 1.29 | 2.14 | -2.88 | -0.26 | 3.86 | 8.31 | 1016.86 | 1028.39 | 1019.23 | 61.94 | 3.46 |
| Soybean Oil Futures,Dec-2025 | ZL=F | 51.65 | -0.06 | -2.88 | -3.19 | -7.88 | 5.17 | 10.34 | 29.84 | 26.87 | 53.78 | 50.87 | 47.19 | 37.18 | -0.56 |
### Livestock & Meat
| Name | Symbol | Price | Daily (%) | 5D (%) | 1W (%) | 1M (%) | 3M (%) | 6M (%) | YTD (%) | 12M (%) | MA50 | MA100 | MA200 | RSI | MACD |
|---|---|---|---|---|---|---|---|---|---|---|---|---|---|---|---|
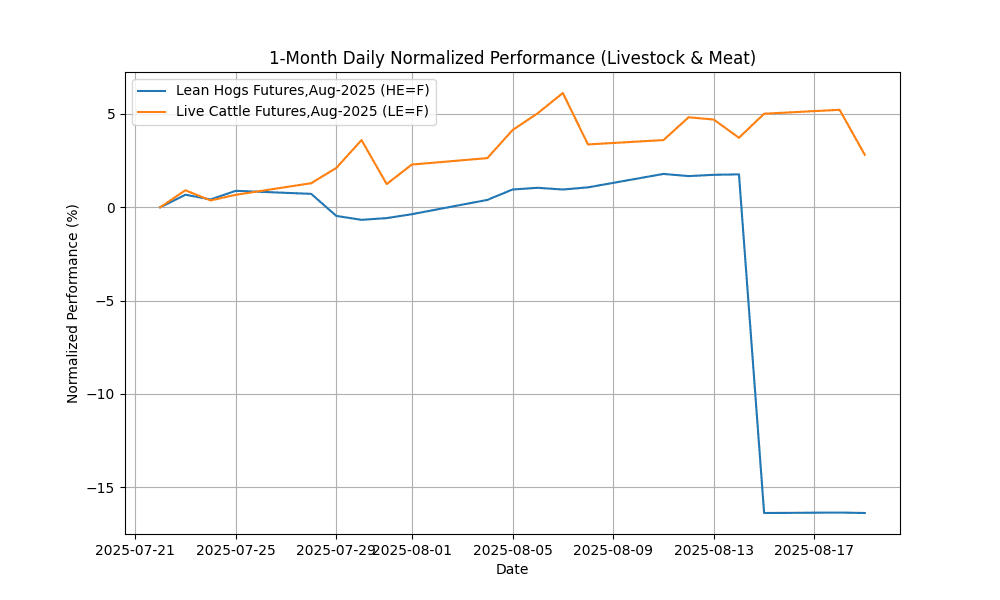
| Lean Hogs Futures,Aug-2025 | HE=F | 90.10 | -0.03 | 0.00 | -17.81 | -16.07 | -8.71 | 2.77 | 10.82 | 17.93 | 107.22 | 100.14 | 92.09 | 15.07 | -2.98 |
| Live Cattle Futures,Aug-2025 | LE=F | 231.30 | -2.29 | -2.10 | -1.80 | 2.70 | 7.27 | 16.92 | 19.32 | 27.77 | 226.22 | 218.98 | 207.13 | 51.39 | 2.89 |
### Precious Metals
| Name | Symbol | Price | Daily (%) | 5D (%) | 1W (%) | 1M (%) | 3M (%) | 6M (%) | YTD (%) | 12M (%) | MA50 | MA100 | MA200 | RSI | MACD |
|---|---|---|---|---|---|---|---|---|---|---|---|---|---|---|---|
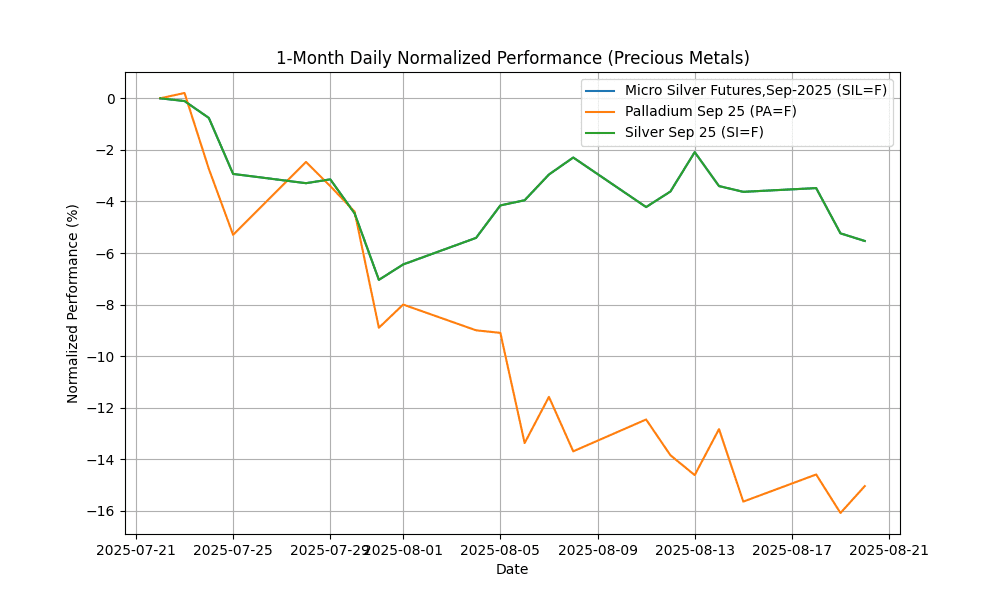
| Micro Silver Futures,Sep-2025 | SIL=F | 37.15 | -0.31 | -1.98 | -3.52 | -5.00 | 12.40 | 12.64 | 28.35 | 26.11 | 37.33 | 35.12 | 33.39 | 44.94 | 0.08 |
| Palladium Sep 25 | PA=F | 1115.50 | 1.24 | 0.71 | -0.50 | -13.62 | 8.94 | 12.89 | 23.55 | 22.06 | 1161.43 | 1061.49 | 1014.36 | 42.13 | -21.33 |
| Silver Sep 25 | SI=F | 37.15 | -0.31 | -1.98 | -3.52 | -5.00 | 12.40 | 12.64 | 28.35 | 26.11 | 37.33 | 35.12 | 33.39 | 44.94 | 0.08 |
### Industrial (Base Metals)
| Name | Symbol | Price | Daily (%) | 5D (%) | 1W (%) | 1M (%) | 3M (%) | 6M (%) | YTD (%) | 12M (%) | MA50 | MA100 | MA200 | RSI | MACD |
|---|---|---|---|---|---|---|---|---|---|---|---|---|---|---|---|
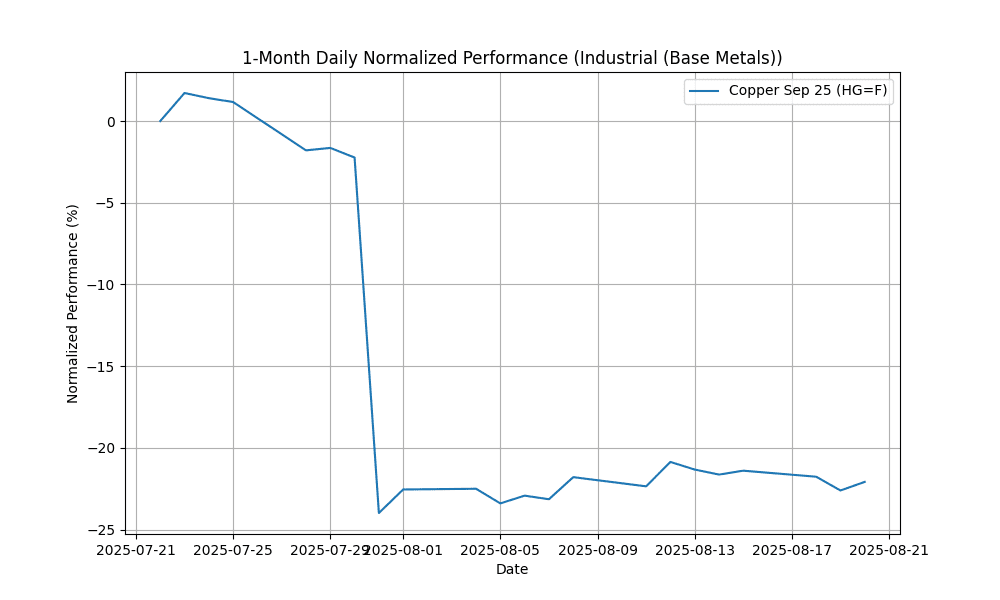
| Copper Sep 25 | HG=F | 4.44 | 0.68 | -0.87 | -0.96 | -20.88 | -4.51 | -2.65 | 11.36 | 6.98 | 5.01 | 4.84 | 4.62 | 34.17 | -0.21 |
### Financial Futures
| Name | Symbol | Price | Daily (%) | 5D (%) | 1W (%) | 1M (%) | 3M (%) | 6M (%) | YTD (%) | 12M (%) | MA50 | MA100 | MA200 | RSI | MACD |
|---|---|---|---|---|---|---|---|---|---|---|---|---|---|---|---|
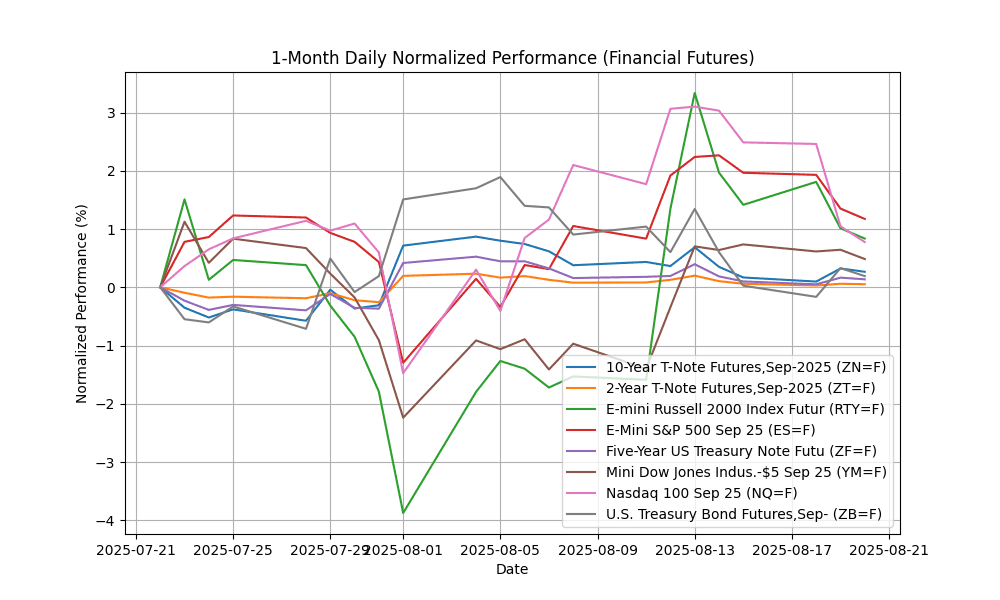
| 10-Year T-Note Futures,Sep-2025 | ZN=F | 111.70 | -0.06 | 0.10 | -0.42 | 0.46 | 1.71 | 1.84 | 2.72 | -1.64 | 111.35 | 111.11 | 110.41 | 52.11 | 0.15 |
| 2-Year T-Note Futures,Sep-2025 | ZT=F | 103.81 | -0.01 | -0.01 | -0.15 | 0.09 | 0.49 | 0.90 | 0.82 | 0.55 | 103.70 | 103.64 | 103.28 | 52.02 | 0.05 |
| E-mini Russell 2000 Index Futur | RTY=F | 2279.60 | -0.18 | -0.57 | -2.42 | 1.66 | 11.19 | 3.65 | 1.32 | 5.94 | 2226.30 | 2115.85 | 2188.46 | 54.84 | 19.04 |
| E-Mini S&P 500 Sep 25 | ES=F | 6421.25 | -0.17 | -0.78 | -1.04 | 1.21 | 9.64 | 6.51 | 8.18 | 14.26 | 6290.99 | 5979.10 | 5966.22 | 56.09 | 47.31 |
| Five-Year US Treasury Note Futu | ZF=F | 108.72 | -0.03 | 0.04 | -0.26 | 0.25 | 1.10 | 1.78 | 2.02 | -0.29 | 108.47 | 108.30 | 107.57 | 52.56 | 0.10 |
| Mini Dow Jones Indus.-$5 Sep 25 | YM=F | 44928.00 | -0.16 | -0.25 | -0.22 | 0.86 | 7.16 | 3.32 | 4.79 | 9.72 | 44232.66 | 42744.44 | 43157.99 | 57.06 | 190.86 |
| Nasdaq 100 Sep 25 | NQ=F | 23406.50 | -0.27 | -1.67 | -2.26 | 0.28 | 10.52 | 7.97 | 10.27 | 18.16 | 23006.10 | 21550.09 | 21322.81 | 50.52 | 196.51 |
| U.S. Treasury Bond Futures,Sep- | ZB=F | 114.19 | -0.14 | 0.16 | -1.14 | 0.66 | 2.70 | -1.64 | 0.30 | -8.56 | 114.15 | 114.29 | 115.09 | 48.49 | 0.12 |
## Technical Indicators Summary
10-Year T-Note Futures,Sep-2025 exhibits bullish momentum as indicated by a positive MACD of 0.15.
2-Year T-Note Futures,Sep-2025 exhibits bullish momentum as indicated by a positive MACD of 0.05.
Bearish signals are present in Brent Crude Oil Last Day Financ with a negative MACD of -0.90.
Bearish signals are present in Cocoa Sep 25 with a negative MACD of -106.10.
Bearish signals are present in Copper Sep 25 with a negative MACD of -0.21.
Bearish signals are present in Corn Futures,Dec-2025 with a negative MACD of -5.85.
Cotton Oct 25 exhibits bullish momentum as indicated by a positive MACD of 0.03.
Bearish signals are present in Crude Oil Sep 25 with a negative MACD of -1.12.
E-mini Russell 2000 Index Futur exhibits bullish momentum as indicated by a positive MACD of 19.04.
E-Mini S&P 500 Sep 25 exhibits bullish momentum as indicated by a positive MACD of 47.31.
Five-Year US Treasury Note Futu exhibits bullish momentum as indicated by a positive MACD of 0.10.
Bearish signals are present in Heating Oil Aug 25 with a negative MACD of -0.03.
Bearish signals are present in KC HRW Wheat Futures,Sep-2025 with a negative MACD of -3.80.
Lean Hogs Futures,Aug-2025 appears oversold, with an RSI reading of 15.07. Bearish signals are present in Lean Hogs Futures,Aug-2025 with a negative MACD of -2.98.
Live Cattle Futures,Aug-2025 exhibits bullish momentum as indicated by a positive MACD of 2.89.
Micro Silver Futures,Sep-2025 exhibits bullish momentum as indicated by a positive MACD of 0.08.
Mini Dow Jones Indus.-$5 Sep 25 exhibits bullish momentum as indicated by a positive MACD of 190.86.
Nasdaq 100 Sep 25 exhibits bullish momentum as indicated by a positive MACD of 196.51.
Bearish signals are present in Oat Futures,Dec-2025 with a negative MACD of -9.23.
Bearish signals are present in Palladium Sep 25 with a negative MACD of -21.33.
Bearish signals are present in RBOB Gasoline Aug 25 with a negative MACD of -0.01.
The S&P Composite 1500 ESG Tilted I market shows signs of overbought conditions with an RSI of 72.98. S&P Composite 1500 ESG Tilted I exhibits bullish momentum as indicated by a positive MACD of 4.35.
Silver Sep 25 exhibits bullish momentum as indicated by a positive MACD of 0.08.
Soybean Futures,Nov-2025 exhibits bullish momentum as indicated by a positive MACD of 3.46.
Bearish signals are present in Soybean Oil Futures,Dec-2025 with a negative MACD of -0.56.
Sugar #11 Oct 25 exhibits bullish momentum as indicated by a positive MACD of 0.01.
U.S. Treasury Bond Futures,Sep- exhibits bullish momentum as indicated by a positive MACD of 0.12.


