Gold Aug 25 (GC=F): Price $3352.50, Daily Change 1.72%
Crude Oil Sep 25 (CL=F): Price $70.01, Daily Change 0.01%
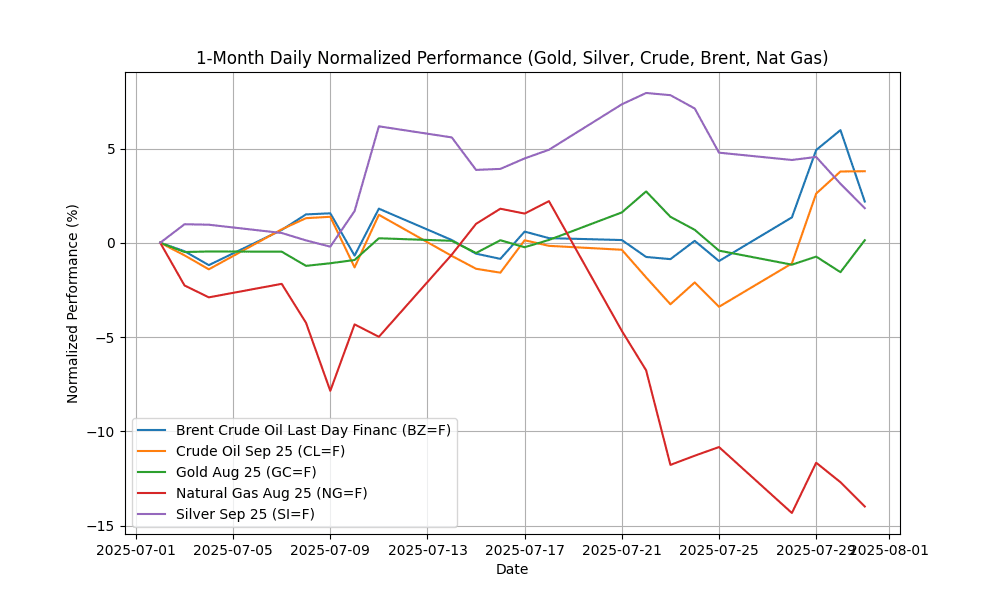
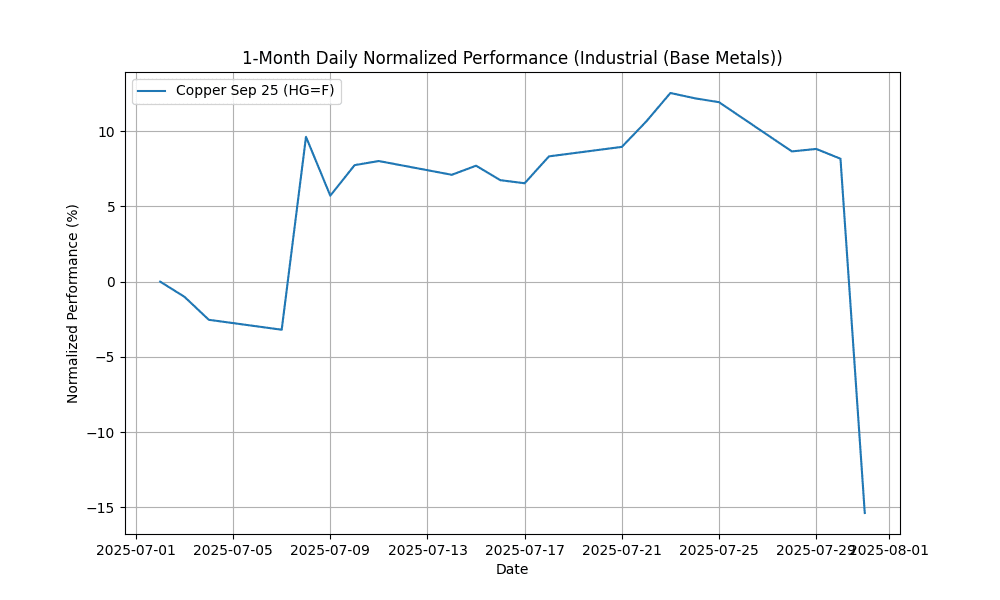
## 1-Month Daily Normalized Performance Chart
## Commodities News Summary
In today’s commodities market, crude oil prices experienced a dip as traders reacted to potential tariff threats from President Trump and a surprising increase in U.S. stockpiles. This uncertainty has dampened market sentiment, contributing to fluctuations in oil prices. Meanwhile, key Asian fuel exporters ramped up jet fuel sales to Europe in July, indicating robust demand in that region.
In the precious metals sector, gold prices rebounded from a one-month low, driven by the impending tariff deadline, while U.S. copper prices faced a slump, reflecting broader concerns about economic growth and demand.
On the geopolitical front, Pakistan announced a successful tariff deal with the U.S., which Trump linked to an agreement on oil reserves, potentially impacting future trade dynamics.
In energy trade news, the value of U.S.-Canada energy trade remained relatively stable at approximately $151 billion in 2024, with a significant portion attributed to U.S. imports from Canada, primarily crude oil from the Permian Basin.
Natural gas markets showed signs of stability, with a notable decrease in price volatility over the first half of 2025. The average volatility of Henry Hub futures fell from 81% to 69%, indicating a return to more typical seasonal patterns as storage levels approached the five-year average. This trend suggests a more balanced natural gas market, following a period of extreme fluctuations.
Overall, commodities markets are navigating a complex landscape of geopolitical tensions, supply dynamics, and evolving demand patterns, leading to cautious sentiment among traders.
## Group Performance and Charts
### Energy
| Name | Symbol | Price | Daily (%) | 5D (%) | 1W (%) | 1M (%) | 3M (%) | 6M (%) | YTD (%) | 12M (%) | MA50 | MA100 | MA200 | RSI | MACD |
|---|---|---|---|---|---|---|---|---|---|---|---|---|---|---|---|
| Brent Crude Oil Last Day Financ | BZ=F | 70.62 | -3.58 | 3.19 | 2.08 | 5.23 | 15.22 | -8.00 | -5.39 | -12.51 | 68.72 | 68.04 | 71.28 | 53.57 | 0.62 |
| Crude Oil Sep 25 | CL=F | 70.01 | 0.01 | 7.44 | 6.03 | 6.97 | 20.11 | -3.47 | -2.38 | -10.14 | 66.44 | 65.19 | 68.07 | 60.58 | 0.52 |
| Heating Oil Aug 25 | HO=F | 2.42 | -1.62 | 0.74 | 0.46 | 4.17 | 21.61 | -2.44 | 4.46 | 0.35 | 2.31 | 2.23 | 2.27 | 52.90 | 0.03 |
| Mont Belvieu LDH Propane (OPIS) | B0=F | N/A | N/A | N/A | N/A | N/A | N/A | N/A | N/A | N/A | N/A | N/A | N/A | N/A | N/A |
| Natural Gas Aug 25 | NG=F | 3.00 | -1.48 | -3.54 | -3.04 | -12.15 | -17.36 | -1.45 | -17.42 | 47.35 | 3.45 | 3.54 | 3.46 | 37.11 | -0.13 |
| RBOB Gasoline Aug 25 | RB=F | 2.28 | 0.31 | 8.54 | 8.17 | 8.37 | 12.68 | 11.77 | 13.72 | -8.30 | 2.14 | 2.13 | 2.08 | 65.57 | 0.02 |

### Precious Metals
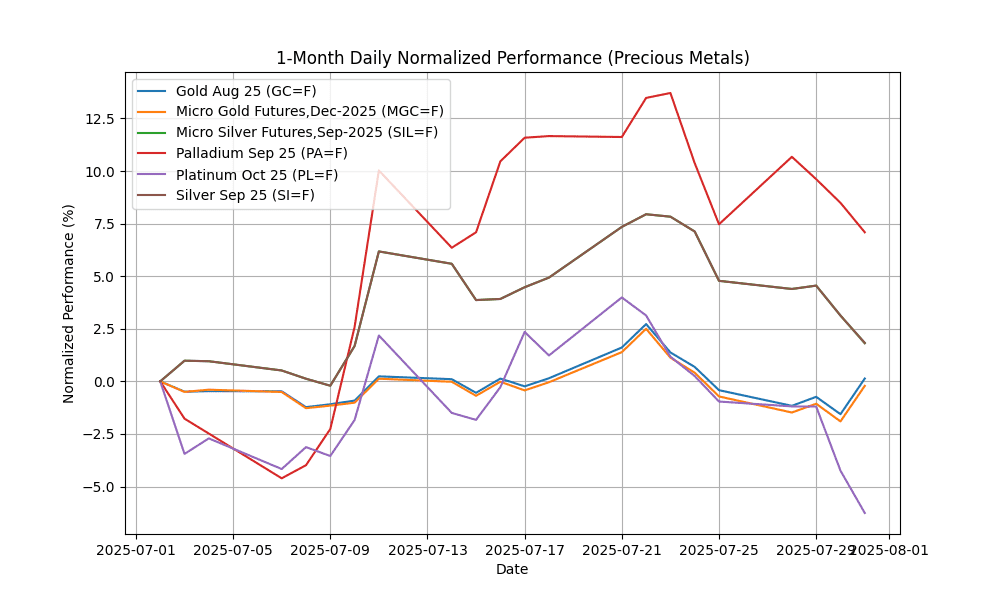
| Name | Symbol | Price | Daily (%) | 5D (%) | 1W (%) | 1M (%) | 3M (%) | 6M (%) | YTD (%) | 12M (%) | MA50 | MA100 | MA200 | RSI | MACD |
|---|---|---|---|---|---|---|---|---|---|---|---|---|---|---|---|
| Gold Aug 25 | GC=F | 3352.50 | 1.72 | 0.55 | -0.55 | 0.47 | 3.73 | 19.20 | 27.51 | 38.16 | 3342.07 | 3255.57 | 2995.79 | 51.43 | 0.51 |
| Micro Gold Futures,Dec-2025 | MGC=F | 3352.50 | 1.72 | 0.51 | -0.62 | 0.08 | 3.37 | 19.20 | 26.94 | 38.16 | 3345.77 | 3259.48 | 2999.39 | 50.86 | -0.93 |
| Micro Silver Futures,Sep-2025 | SIL=F | 37.08 | -1.28 | -2.83 | -4.96 | 2.78 | 15.93 | 15.43 | 28.14 | 28.87 | 36.39 | 34.59 | 33.08 | 46.05 | 0.46 |
| Palladium Sep 25 | PA=F | 1239.00 | -1.29 | -0.35 | -2.98 | 12.08 | 30.85 | 16.13 | 37.22 | 34.29 | 1124.23 | 1035.15 | 1011.51 | 54.87 | 43.00 |
| Platinum Oct 25 | PL=F | 1332.10 | -2.10 | -5.35 | -6.49 | -1.03 | 38.34 | 28.93 | 49.00 | 35.62 | 1291.62 | 1132.32 | 1050.56 | 44.02 | 23.14 |
| Silver Sep 25 | SI=F | 37.10 | -1.25 | -2.81 | -4.94 | 2.81 | 15.96 | 15.46 | 28.18 | 28.90 | 36.39 | 34.59 | 33.08 | 46.14 | 0.46 |
### Agricultural (Soft Commodities)
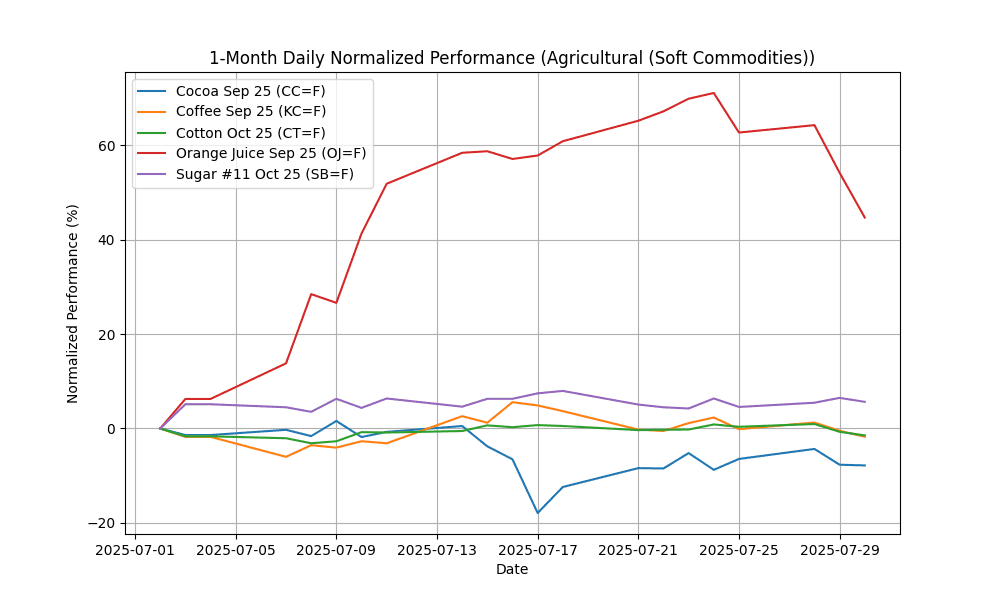
| Name | Symbol | Price | Daily (%) | 5D (%) | 1W (%) | 1M (%) | 3M (%) | 6M (%) | YTD (%) | 12M (%) | MA50 | MA100 | MA200 | RSI | MACD |
|---|---|---|---|---|---|---|---|---|---|---|---|---|---|---|---|
| Cocoa Sep 25 | CC=F | 8207.00 | -0.16 | -1.46 | 1.02 | -8.81 | -10.08 | -25.30 | -29.70 | 1.42 | 9179.70 | 8953.48 | 9246.99 | 44.15 | -262.64 |
| Coffee Sep 25 | KC=F | 292.75 | -1.26 | -1.61 | -3.97 | -2.04 | -25.96 | -22.52 | -8.44 | 27.73 | 322.59 | 353.62 | 339.73 | 40.33 | -6.41 |
| Cotton Oct 25 | CT=F | 65.79 | -0.77 | -1.82 | -2.30 | -0.74 | -6.26 | -0.14 | -3.82 | -3.22 | 65.95 | 66.25 | 67.39 | 45.22 | 0.19 |
| Orange Juice Sep 25 | OJ=F | 286.65 | -6.15 | -11.07 | -15.43 | 33.05 | 1.33 | -39.61 | -42.38 | -31.90 | 272.75 | 268.77 | 366.68 | 48.03 | 16.03 |
| Random Length Lumber Futures | LBS=F | N/A | N/A | N/A | N/A | N/A | N/A | N/A | N/A | N/A | N/A | N/A | N/A | N/A | N/A |
| Sugar #11 Oct 25 | SB=F | 16.46 | -0.78 | 1.04 | -0.66 | 4.84 | -4.30 | -14.94 | -14.54 | -13.09 | 16.46 | 17.42 | 18.93 | 50.75 | 0.02 |
### Grains & Oilseeds
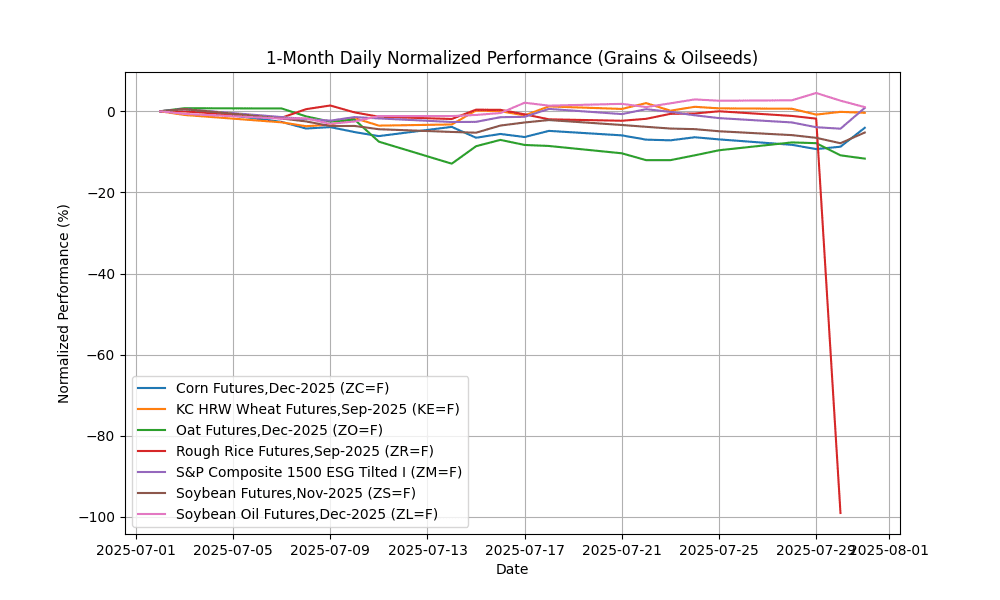
| Name | Symbol | Price | Daily (%) | 5D (%) | 1W (%) | 1M (%) | 3M (%) | 6M (%) | YTD (%) | 12M (%) | MA50 | MA100 | MA200 | RSI | MACD |
|---|---|---|---|---|---|---|---|---|---|---|---|---|---|---|---|
| Corn Futures,Dec-2025 | ZC=F | 411.75 | 5.11 | 3.07 | 2.49 | -1.96 | -10.73 | -14.57 | -10.20 | 7.58 | 424.05 | 442.49 | 445.91 | 51.73 | -7.29 |
| KC HRW Wheat Futures,Sep-2025 | KE=F | 520.75 | -0.24 | -1.09 | -1.47 | 1.96 | -1.47 | -10.10 | -6.88 | -5.15 | 528.24 | 538.83 | 551.84 | 48.40 | -0.60 |
| Oat Futures,Dec-2025 | ZO=F | 353.75 | -0.91 | -2.28 | -0.91 | -8.83 | -2.08 | 1.80 | 7.03 | 8.43 | 372.37 | 365.78 | 360.28 | 41.69 | -4.76 |
| S&P Composite 1500 ESG Tilted I | ZM=F | 274.70 | 5.37 | 2.58 | 1.85 | 2.04 | -5.34 | -8.77 | -10.70 | -22.42 | 280.30 | 286.45 | 291.96 | 53.70 | -3.17 |
| Soybean Futures,Nov-2025 | ZS=F | 995.50 | 2.87 | -0.33 | -0.87 | -2.85 | -5.08 | -4.46 | -0.28 | -3.21 | 1033.66 | 1030.14 | 1018.66 | 43.23 | -13.59 |
| Soybean Oil Futures,Dec-2025 | ZL=F | 55.62 | -1.56 | -1.54 | -1.85 | 3.46 | 13.33 | 20.62 | 39.82 | 28.45 | 52.34 | 49.31 | 46.48 | 55.63 | 1.16 |
### Livestock & Meat
| Name | Symbol | Price | Daily (%) | 5D (%) | 1W (%) | 1M (%) | 3M (%) | 6M (%) | YTD (%) | 12M (%) | MA50 | MA100 | MA200 | RSI | MACD |
|---|---|---|---|---|---|---|---|---|---|---|---|---|---|---|---|
| Lean Hogs Futures,Aug-2025 | HE=F | 106.85 | -0.37 | -1.70 | -1.25 | -1.97 | 14.95 | 26.94 | 31.43 | 15.80 | 105.91 | 97.61 | 90.36 | 48.72 | 0.40 |
| Live Cattle Futures,Aug-2025 | LE=F | 232.95 | 1.40 | 2.86 | 3.17 | 10.53 | 10.35 | 13.86 | 20.17 | 24.49 | 221.40 | 214.84 | 203.94 | 69.56 | 2.59 |
| WisdomTree International High D | GF=F | 339.42 | 0.96 | 2.43 | 3.20 | 10.91 | 15.08 | 23.10 | 29.05 | 31.94 | 312.06 | 300.29 | 280.79 | 75.80 | 7.19 |
### Industrial (Base Metals)
| Name | Symbol | Price | Daily (%) | 5D (%) | 1W (%) | 1M (%) | 3M (%) | 6M (%) | YTD (%) | 12M (%) | MA50 | MA100 | MA200 | RSI | MACD |
|---|---|---|---|---|---|---|---|---|---|---|---|---|---|---|---|
| Copper Sep 25 | HG=F | 4.36 | -21.78 | -24.40 | -24.58 | -13.69 | -5.85 | 2.23 | 9.31 | 4.74 | 5.10 | 4.93 | 4.61 | 25.04 | 0.05 |
## Oversold
– Copper Sep 25 (HG=F): RSI of 25.04.
– Rough Rice Futures,Sep-2025 (ZR=F): RSI of 4.58.
## Bullish
– Brent Crude Oil Last Day Financ (BZ=F): positive MACD of 0.62.
– Copper Sep 25 (HG=F): positive MACD of 0.05.
– Cotton Oct 25 (CT=F): positive MACD of 0.19.
– Crude Oil Sep 25 (CL=F): positive MACD of 0.52.
– Gold Aug 25 (GC=F): positive MACD of 0.51.
– Heating Oil Aug 25 (HO=F): positive MACD of 0.03.
– Lean Hogs Futures,Aug-2025 (HE=F): positive MACD of 0.40.
– Live Cattle Futures,Aug-2025 (LE=F): positive MACD of 2.59.
– Micro Silver Futures,Sep-2025 (SIL=F): positive MACD of 0.46.
– Orange Juice Sep 25 (OJ=F): positive MACD of 16.03.
– Palladium Sep 25 (PA=F): positive MACD of 43.00.
– Platinum Oct 25 (PL=F): positive MACD of 23.14.
– RBOB Gasoline Aug 25 (RB=F): positive MACD of 0.02.
– Silver Sep 25 (SI=F): positive MACD of 0.46.
– Soybean Oil Futures,Dec-2025 (ZL=F): positive MACD of 1.16.
– Sugar #11 Oct 25 (SB=F): positive MACD of 0.02.
## Bearish
– Cocoa Sep 25 (CC=F): negative MACD of -262.64.
– Coffee Sep 25 (KC=F): negative MACD of -6.41.
– Corn Futures,Dec-2025 (ZC=F): negative MACD of -7.29.
– KC HRW Wheat Futures,Sep-2025 (KE=F): negative MACD of -0.60.
– Micro Gold Futures,Dec-2025 (MGC=F): negative MACD of -0.93.
– Natural Gas Aug 25 (NG=F): negative MACD of -0.13.
– Oat Futures,Dec-2025 (ZO=F): negative MACD of -4.76.
– Rough Rice Futures,Sep-2025 (ZR=F): negative MACD of -113.93.
– S&P Composite 1500 ESG Tilted I (ZM=F): negative MACD of -3.17.
– Soybean Futures,Nov-2025 (ZS=F): negative MACD of -13.59.


