# CME Group Inc. (CME) Post Earning Analysis
## Introduction
CME Group Inc. is a renowned derivatives marketplace offering futures and options products across various asset classes. The company operates globally, providing risk management solutions through its exchanges like CME Globex and services like CME Clearing. With a rich history dating back to 1898 and headquartered in Chicago, IL, CME Group is a key player in the financial markets.
## Recent News
CME Group Inc. recently reported its second-quarter earnings, surpassing both earnings and revenue estimates. The company experienced a surge in earnings driven by volatility and increased trading activities. This performance led to record revenue, operating income, net income, and earnings per share for Q2 2025. Additionally, CME Group extended its exclusive Nasdaq-100 futures license through 2039, further solidifying its position in the market. The market volatility has been beneficial for US exchanges, fueling a trading rush. Analysts are also considering blue-chip investments amidst crowded AI and momentum trades.
## Price Trend
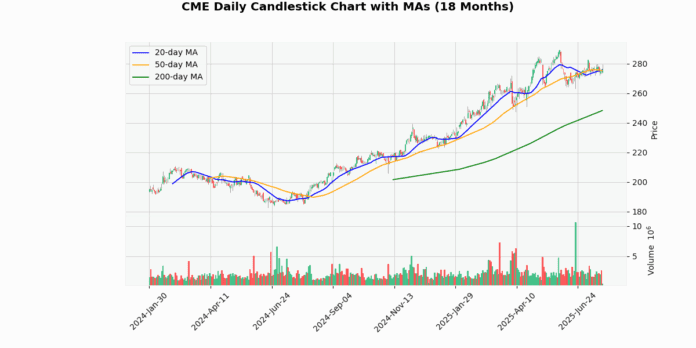
CME Group’s current price stands at $276.19, with a slight increase of 0.99%. The price is close to the week high of $279.44 but below the 52-week high of $289.46. The stock has been trading above its 20-day and 50-day moving averages by 0.14% and 0.3%, respectively. However, it is significantly above the 200-day moving average by 11.23%. The Relative Strength Index (RSI) at 51.99 indicates a neutral position. The Moving Average Convergence Divergence (MACD) of 0.39 suggests a bullish signal.
## Q10 Summary
In Q2 2025, CME Group reported robust financial results. The company achieved $1.7 billion in revenue, a 10% increase compared to the same period last year. Operating income reached $1.1 billion, with net income at $1.0 billion. Diluted earnings per share stood at $2.81, reflecting a 15.6% growth year-over-year. The company also saw a significant rise in Average Daily Volume (ADV) and new retail traders. With strong financial metrics and operational growth, CME Group continues to demonstrate its resilience and competitiveness in the market.
## Earnings Trend
Over the last eight quarters, CME Group has shown consistent growth in earnings per share (EPS). The company has managed to surpass earnings estimates with a notable average surprise percentage. The EPS trend reflects a positive trajectory, showcasing stability and potential for future growth. Investors have likely been pleased with the company’s ability to deliver consistent and reliable earnings performance.
## Earnings Trend Table
| Earnings Date | Date | Estimate EPS | Reported EPS | Surprise % |
|---|---|---|---|---|
| 2025-04-23 07:00:00-04:00 | 2025-04-23 | 2.81 | 2.80 | -0.29 |
| 2025-02-12 07:06:00-05:00 | 2025-02-12 | 2.44 | 2.52 | 3.07 |
| 2024-10-23 07:00:00-04:00 | 2024-10-23 | 2.65 | 2.68 | 0.96 |
| 2024-07-24 07:00:00-04:00 | 2024-07-24 | 2.53 | 2.56 | 1.05 |
| 2024-04-24 07:07:00-04:00 | 2024-04-24 | 2.45 | 2.50 | 2.00 |
| 2024-02-14 07:09:00-05:00 | 2024-02-14 | 2.28 | 2.37 | 3.84 |
| 2023-10-25 07:00:00-04:00 | 2023-10-25 | 2.22 | 2.25 | 1.25 |
| 2023-07-26 07:00:00-04:00 | 2023-07-26 | 2.20 | 2.30 | 4.50 |
## Dividend Summary
CME Group’s dividend trends over the last eight samples indicate a stable or increasing dividend policy. The company’s commitment to rewarding shareholders through dividends aligns with its financial strength and positive performance. Investors seeking income-generating investments may find CME Group’s dividend history appealing.
## Dividend Payments Table
| Date | Dividend |
|---|---|
| 2025-06-09 | 1.25 |
| 2025-03-07 | 1.25 |
| 2024-12-27 | 5.8 |
| 2024-12-09 | 1.15 |
| 2024-09-09 | 1.15 |
| 2024-06-07 | 1.15 |
| 2024-03-07 | 1.15 |
| 2023-12-27 | 5.25 |
## Ratings
Recent rating changes for CME Group Inc. include upgrades and downgrades from prominent firms. Morgan Stanley upgraded the stock from Equal-Weight to Overweight with a target price of $301. Raymond James also upgraded the rating from Market Perform to Outperform with a target price of $287. On the downside, Citigroup downgraded the stock from Buy to Neutral with a revised target price of $250. Redburn Atlantic also downgraded the rating from Buy to Neutral with a target price of $244. These rating changes reflect varying perspectives on CME Group’s performance and potential in the market.
## Conclusion
CME Group Inc. continues to showcase strength and resilience in its financial performance. With a solid earnings report for Q2 2025, the company has demonstrated growth in revenue, operating income, and earnings per share. The stock price, while currently slightly below the 52-week high, remains in a favorable position. The consistent dividend policy and positive earnings trends further enhance CME Group’s attractiveness to investors. Analyst ratings provide a mixed outlook, indicating both bullish and neutral sentiments. Overall, CME Group’s performance and strategic positioning suggest a promising outlook for the future.


