## Introduction
GE Vernova, Inc. operates in the electric power industry, providing a range of products and services related to electricity generation, transfer, conversion, and storage. The company’s segments include Power, Wind, and Electrification, with a focus on technologies for power generation and distribution. GE Vernova is headquartered in Cambridge, Massachusetts, and was founded on November 9, 2021.
## Recent News
## Price Chart

In the last five days, GE Vernova has been making headlines with its strong performance and positive outlook. The stock saw a significant surge following its Q2 earnings beat, leading to Wall Street’s favorable reception. The company raised its annual forecasts, citing a surge in revenue and orders. GE Vernova’s stock price soared towards two records as it reassured investors that tariff impacts would be less than previously anticipated. Analysts and investors are particularly optimistic about GE Vernova’s position in the AI sector, with the company being touted as one of the biggest winners from the AI boom. Overall, GE Vernova’s recent news reflects a positive trajectory for the company, driving investor confidence and market interest.
## Price Trend
## Earnings Trend Table
| # | Date | Estimate EPS | Reported EPS | Surprise % |
|---|---|---|---|---|
| 0 | 2025-07-23 | 1.51 | 1.73 | 14.57 |
| 1 | 2025-04-23 | 0.42 | 0.85 | 102.99 |
| 2 | 2025-01-22 | 2.29 | 1.33 | -41.79 |
| 3 | 2024-10-23 | 0.18 | 0.04 | -77.20 |
| 4 | 2024-07-24 | 0.73 | 1.02 | 38.80 |
| 5 | 2024-04-25 | -0.36 | -0.41 | -12.33 |
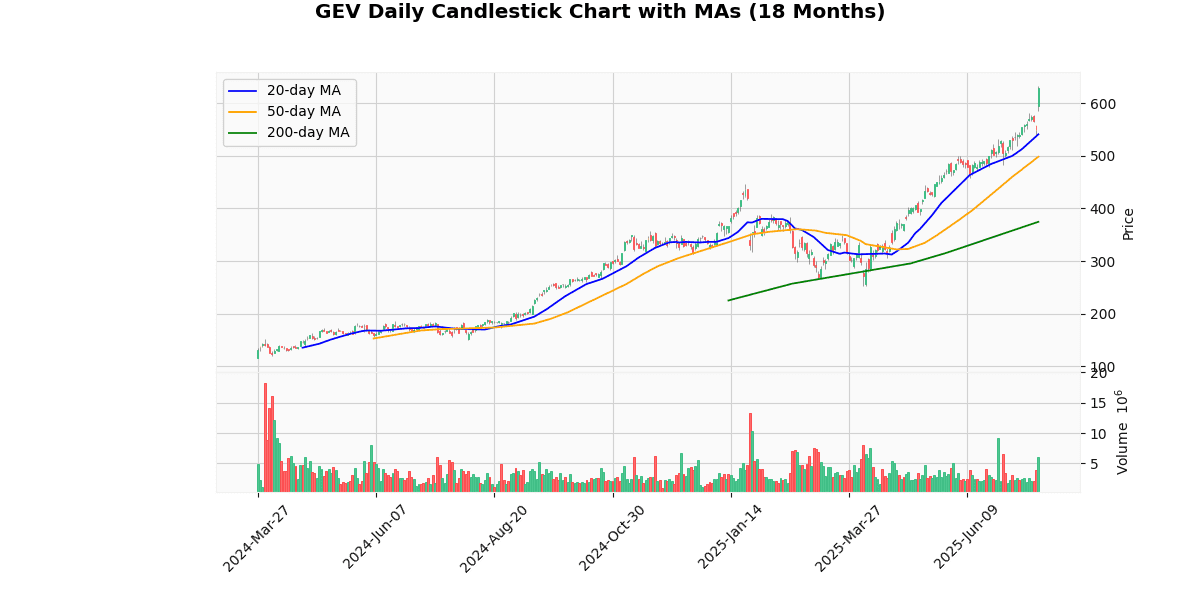
GE Vernova’s current price stands at $628.43, showing a 14.18% change. The stock’s price compared to moving averages indicates a bullish trend, with percentages above the 20-day (16.15%), 50-day (26.09%), and 200-day (67.75%) moving averages. The 52-week high is 633.72, with a slight decrease of 0.83%, while the 52-week low is 149.72, showing a significant increase of 319.74%. Year-to-date highs and lows also demonstrate a positive trend, with a decrease of 0.83% from the high of 633.72 and an increase of 149.43% from the low of 251.95. The stock’s RSI stands at 77.99, indicating an overbought condition, while the MACD signal of 26.83 suggests a bullish momentum. Overall, the price trend analysis points towards a strong performance and positive market sentiment for GE Vernova.
## Dividend Payments Table
| Date | Dividend |
|---|---|
| 2025-07-21 | 0.25 |
| 2025-04-17 | 0.25 |
| 2024-12-20 | 0.25 |
## Q10 Summary
GE Vernova’s Q2 2025 financial results, released on July 23, 2025, showcased impressive performance metrics. The company reported $12.4 billion in orders, with a 4% organic growth rate. Revenue grew by 11% overall and 12% organically, reaching $9.1 billion. Net income stood at $0.5 billion, with a margin of 5.4%. Adjusted EBITDA saw a significant increase of 47% year-over-year, reaching $0.8 billion with an 8.5% margin. GE Vernova also raised its revenue guidance to up to $37 billion and adjusted EBITDA margin expectations to 8%-9%. The company repurchased approximately 1.2 million shares for $0.4 billion in Q2 2025 and declared a quarterly dividend of $0.25 per share. GE Vernova’s strategic developments and operational performance indicate a strong outlook for future growth and profitability.


