This section provides an overview of available data.
Concentrix Corporation (NASDAQ: CNXC) recently reported its Q3 2025 results, which exceeded revenue expectations but led to a significant 21.2% drop in its stock price, as detailed in a recent report by StockStory and GlobeNewswire. Despite the positive revenue outcome, the sharp decline in stock price could indicate investor concerns about other aspects of the company’s financial health or future outlook, which were not immediately detailed in the provided summaries. This situation presents a critical juncture for current investors and potential buyers to reassess the intrinsic value and future prospects of Concentrix.
In broader market news, as reported by MarketWatch, the stock market, including major indices like the Dow, S&P 500, and Nasdaq, struggled to rally after a recent pullback from record highs. This general market sentiment, coupled with a busy economic calendar including Federal Reserve speakers and new economic data, could also influence investor behavior towards stocks like Concentrix. Additionally, other earnings reports, such as those from Cintas and Costco, could also impact market dynamics and investor sentiment.
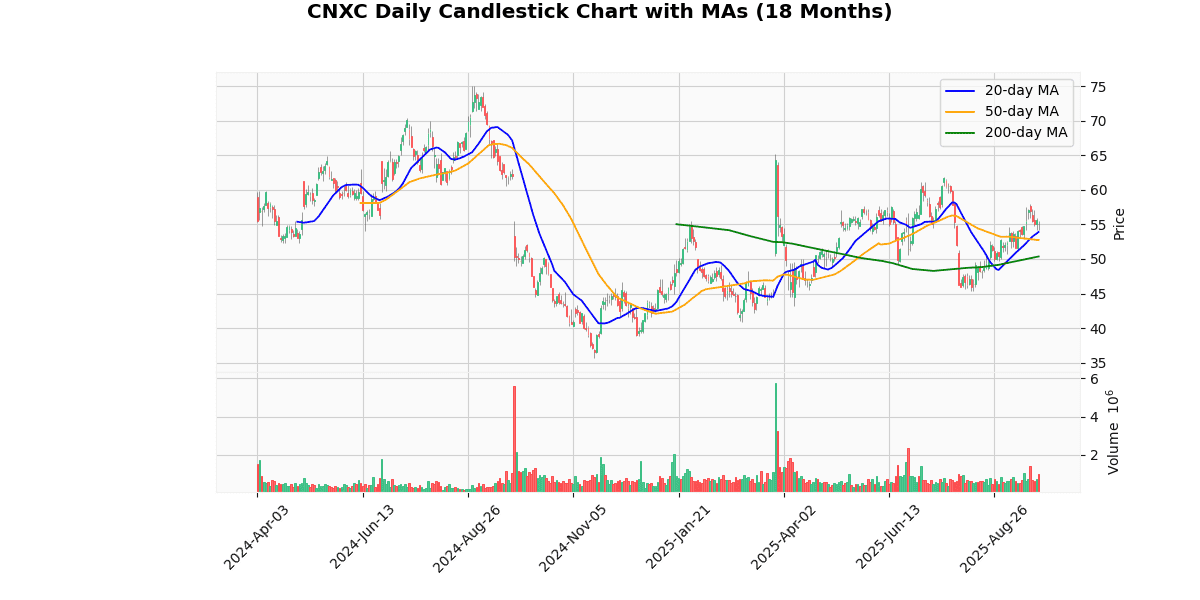
The current price of the asset is $54.99, reflecting a decrease of 1.1% today. It stands below the week’s high of $57.29 and slightly above the week’s low of $54.12, suggesting a relatively stable price range for the week. The asset is trading below its 20-day, 50-day, and 200-day moving averages by approximately 2.02%, 4.26%, and 9.21% respectively, indicating a bearish short to medium-term trend.
Year-to-date, the price has recovered significantly from its low of $40.92, yet it remains 15.67% below the high of $65.21, indicating that it has not fully rebounded from earlier declines. The 52-week metrics show a wide range from a low of $35.62 to a high of $65.21, with the current price up 54.38% from the 52-week low, showcasing a strong recovery over the longer term.
The RSI at 55.23 suggests moderate momentum, neither overbought nor oversold, while the MACD value of 1.11 indicates a slight bullish momentum in recent trading sessions. Overall, the asset shows a mixed performance with a general recovery trend from its lows but struggles to reach previous highs.
## Price Chart

This section provides an overview of available data.
## Earnings Trend Table
| Earnings Date | Date | Estimate EPS | Reported EPS | Surprise % |
|---|---|---|---|---|
| 2025-06-26 16:10:00-04:00 | 2025-06-26 | 2.75 | 2.70 | -1.75 |
| 2025-03-26 16:12:00-04:00 | 2025-03-26 | 2.58 | 2.79 | 8.03 |
| 2025-01-15 16:05:00-05:00 | 2025-01-15 | 3.01 | 3.26 | 8.38 |
| 2024-09-25 16:05:00-04:00 | 2024-09-25 | 2.93 | 2.87 | -1.96 |
| 2024-06-26 16:05:00-04:00 | 2024-06-26 | 2.63 | 2.69 | 2.48 |
| 2024-03-26 16:10:00-04:00 | 2024-03-26 | 2.58 | 2.57 | -0.39 |
| 2024-01-24 16:05:00-05:00 | 2024-01-24 | 3.08 | 3.36 | 9.09 |
| 2023-09-27 16:10:00-04:00 | 2023-09-27 | 2.85 | 2.71 | -4.75 |
Over the past eight quarters, the company’s earnings per share (EPS) have demonstrated a mixed pattern of surpassing and falling short of estimates, with notable fluctuations in surprise percentages. A closer analysis reveals a trend where the company has exceeded EPS estimates significantly in three instances, specifically during the first quarters of both 2024 and 2025, as well as in the third quarter of 2024. These quarters show positive surprise percentages of 9.09%, 8.38%, and 2.48% respectively.
Conversely, the company underperformed relative to estimates in the third quarters of 2023 and 2024 and the second quarter of 2025, with negative surprise percentages of -4.75%, -1.96%, and -1.75% respectively. The slight underperformance in the first quarter of 2024, at -0.39%, suggests a minor deviation from expected results.
This pattern indicates a stronger performance in the first quarters of the year, which could be seasonal or driven by specific market or company factors influencing performance after the end of a fiscal year. The third quarters, however, consistently show challenges, potentially indicating cyclic operational or market challenges affecting performance mid-year. Moving forward, stakeholders should closely monitor these trends for strategic planning and forecasting.
## Dividend Payments Table
| Date | Dividend |
|---|---|
| 2025-07-25 | 0.333 |
| 2025-04-25 | 0.333 |
| 2025-01-31 | 0.333 |
| 2024-10-25 | 0.333 |
| 2024-07-26 | 0.303 |
| 2024-04-25 | 0.303 |
| 2024-02-02 | 0.303 |
| 2023-10-26 | 0.303 |
The dividend data presented over the last eight quarters shows a clear trend of stability followed by an increase. From October 2023 to July 2024, the dividend remained constant at $0.303 per share. This period of stability suggests that the company maintained a consistent dividend policy, possibly reflecting steady financial performance or a cautious approach to capital distribution during this timeframe.
Starting from October 2024, there is a noticeable increase in the dividend to $0.333 per share, which has been maintained through the most recent data point in July 2025. This increment, representing a 10% rise from the previous quarters, indicates a positive adjustment in the company’s dividend policy. This could be attributed to improved financial health, increased cash flows, or a strategic decision to return more capital to shareholders in response to a more favorable economic environment or company-specific factors.
Overall, the trend over these eight samples highlights a phase of stability followed by a moderate but sustained increase in dividend payouts, suggesting a potentially optimistic outlook by the company’s management regarding its future financial performance.
The most recent analyst activity on Outer’s stock presents a varied outlook from different firms, reflecting changes in market conditions and company performance assessments.
1. **Barrington Research (March 24, 2025)** – Barrington Research reiterated its “Outperform” rating on Outer, although it significantly lowered the target price from $70 to $54. This adjustment suggests that while the firm still sees the company outperforming the market, it has moderated its expectations regarding the stock’s valuation potential, possibly due to revised earnings forecasts or market conditions impacting the sector.
2. **Robert W. Baird (October 3, 2024)** – Robert W. Baird initiated coverage on Outer with an “Outperform” rating and set a target price at $70. This initiation indicates a positive outlook from Baird, suggesting that they see potential in the company’s growth or market position that could lead to stock performance above the industry average.
3. **BofA Securities (August 28, 2024)** – BofA Securities upgraded Outer from “Underperform” to “Neutral” and raised the target price from $65 to $85. This upgrade reflects a significant change in the firm’s view of the company’s prospects, moving from a negative to a neutral stance. The increase in target price suggests that the factors previously driving the negative outlook may have been mitigated or that new developments have improved the company’s operational or financial outlook.
4. **BofA Securities (March 27, 2024)** – Earlier in the year, BofA Securities downgraded Outer from “Neutral” to “Underperform” and lowered the target price from $85 to $60. This downgrade indicates that the firm perceived increased risks or a deterioration in the company’s performance or market environment, warranting a more cautious stance.
These rating changes illustrate a dynamic and evolving perspective on Outer’s financial health and market position, influenced by ongoing assessments of the company’s performance metrics, industry trends, and broader economic factors.
The current price of the stock is $54.99, which is positioned below the consensus target prices provided by various analysts. The most recent evaluation from Barrington Research on March 24, 2025, reiterated an “Outperform” rating but adjusted their target price from $70 to $54, aligning it closely with the current market price. Earlier, Robert W. Baird initiated coverage on October 3, 2024, with an “Outperform” rating and a target price of $70, indicating a potential upside based on their assessment at that time. BofA Securities has shown fluctuating views; they upgraded the stock from “Underperform” to “Neutral” on August 28, 2024, modifying their target from $65 to $85, suggesting a significant potential increase. However, this was a shift from a previous downgrade on March 27, 2024, where they reduced their rating and target from “Neutral” to “Underperform” and from $85 to $60 respectively. This series of evaluations reflects a mixed but generally optimistic outlook on the stock’s future performance, with recent adjustments aligning closer to the current market price.
Disclaimer: The information provided here is for educational and informational purposes only and should not be interpreted as financial advice, investment recommendations, or trading guidance. Markets involve risk, and past performance is not indicative of future results. You should always conduct your own research and consult with a qualified financial advisor before making any investment decisions. By acting, you accept full responsibility for your choices.


