Costco Wholesale Corp., founded in 1983 by James D. Sinegal and Jeffrey H. Brotman, specializes in operating membership warehouses. Headquartered in Issaquah, Washington, the company serves members across the United States, Canada, and other international locations. Costco is known for its bulk products, ranging from groceries to electronics, all offered exclusively to its members.
Recent news highlights significant developments for Costco, focusing on its Q4 earnings report. Despite beating earnings estimates with a notable 8% rise in Q4 net sales and a 5.7% increase in comparable sales, Costco’s stock experienced a decline. Analysts pointed out that while revenue and earnings surpassed expectations, the stock’s drop could be attributed to concerns over margin pressures due to elevated expenses. Additionally, the broader market context includes worries about the Federal Reserve’s inflation data influencing market dynamics, potentially impacting investor sentiment towards retail stocks like Costco.
These financial results and market reactions suggest that while Costco continues to show strong sales growth and consumer demand resilience, investor concerns about profit margins and broader economic conditions could temper stock performance in the short term. This scenario underscores the importance for investors to monitor economic indicators and company-specific factors such as expense management and sales growth sustainability.
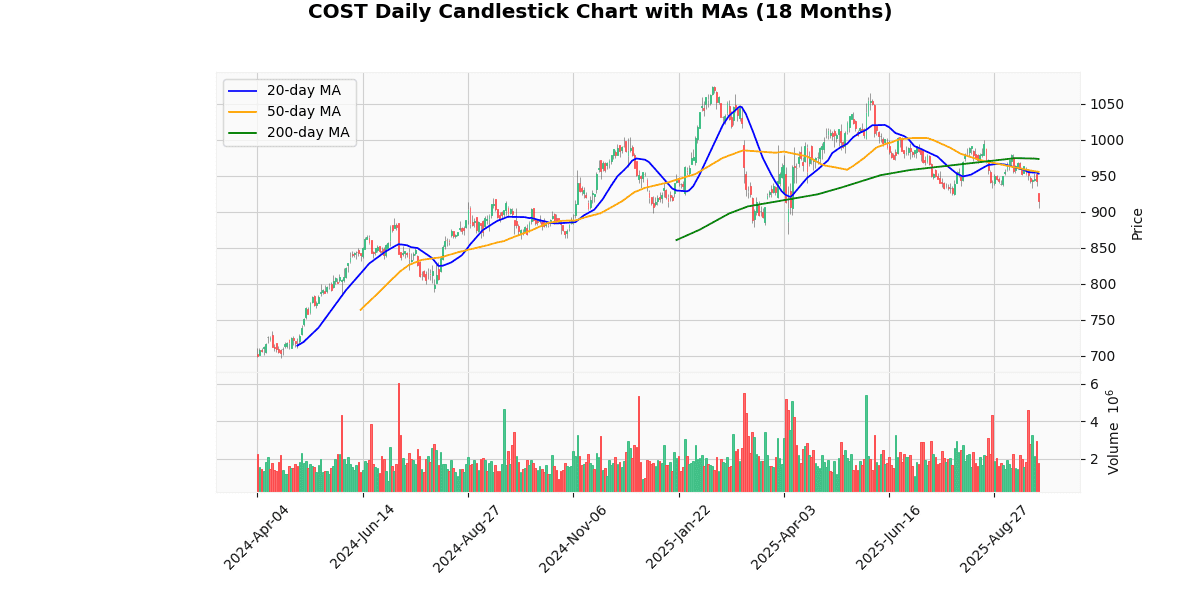
The current price of the asset is $915.05, showing a significant drop today by 2.77%. This decline is part of a broader negative trend, as indicated by the price being below all key moving averages: 20-day (3.98%), 50-day (4.24%), and 200-day (6.00%). Such positioning suggests a bearish sentiment in recent times.
The asset has retreated 14.91% from its 52-week and year-to-date high of $1075.34, yet it remains 6.06% above the 52-week low and 5.25% above the year-to-date low, indicating some resilience above the lowest levels of the past year.
Technical indicators reinforce the bearish outlook: the RSI at 32.5 points to a potentially oversold condition, but not severely so, which might imply there is room for further downside before a significant recovery. The MACD at -6.95 confirms the ongoing negative momentum.
Overall, the asset is currently experiencing a downward trajectory with a potential for further declines, unless a reversal pattern emerges supported by a significant improvement in technical indicators.
## Price Chart

Costco Wholesale Corporation reported robust financial results for the fourth quarter and full fiscal year ending August 31, 2025. The company saw its Q4 net sales increase by 8.0% to $84.4 billion, and total revenue for the quarter reached $86.156 billion. For the fiscal year, net sales rose by 8.1% to $269.9 billion, with total revenue climbing to $275.235 billion.
Earnings per share (EPS) for Q4 were $5.87, up from $5.29 in the same period last year, while FY EPS increased to $18.21 from $16.56. Notably, net income for the quarter was $2.610 billion and $8.099 billion for the year. Operating income also showed growth, with Q4 figures at $3.341 billion and FY at $10.383 billion.
The company’s e-commerce segment performed exceptionally well, with a 13.6% increase in Q4 and a 15.6% rise over the fiscal year. Adjusted comparable sales saw healthy increases across all regions, particularly in the U.S. and Canada.
Costco ended the fiscal year with total assets of $77.099 billion and liabilities at $47.935 billion. Cash flow from operations was strong at $13.335 billion. The company also returned value to shareholders through $2.183 billion in dividends and repurchased $903 million in stock during the year. Costco operates 914 warehouses globally, reflecting its expansive retail footprint.
## Earnings Trend Table
| Date | Estimate EPS | Reported EPS | Surprise % | |
|---|---|---|---|---|
| 0 | 2025-09-25 | 5.80 | 5.87 | 1.21 |
| 1 | 2025-05-29 | 4.24 | 4.28 | 1.00 |
| 2 | 2025-03-06 | 4.11 | 4.02 | -2.12 |
| 3 | 2024-12-12 | 3.79 | 4.04 | 6.59 |
| 4 | 2024-09-05 | 5.08 | 5.29 | 4.08 |
| 5 | 2024-05-30 | 3.70 | 3.78 | 2.10 |
| 6 | 2024-03-07 | 3.62 | 3.92 | 8.24 |
| 7 | 2023-12-14 | 3.42 | 3.58 | 4.69 |
Over the past eight quarters, the company has generally demonstrated a positive trend in earnings per share (EPS), consistently surpassing analyst estimates in six out of eight quarters. This indicates a robust performance and possibly effective management strategies in place.
A closer analysis reveals a seasonal pattern in EPS performance, with higher EPS typically reported in the September quarters of 2024 and 2025 (5.29 and 5.87 respectively), suggesting a potential cyclical peak in business activities during these periods. Conversely, the March quarters of both years show relatively lower EPS figures (3.92 in 2024 and 4.02 in 2025), with a notable -2.12% surprise in 2025, indicating a possible cyclical trough or operational challenges during this period.
The company also shows a year-over-year improvement in EPS, as evidenced by the increase from 3.58 in December 2023 to 4.04 in December 2024, and subsequently to 5.87 in September 2025. This upward trajectory not only highlights successful financial management but also suggests effective adaptation to market conditions and possibly expansion or efficiency gains.
Overall, the EPS trends over the last eight quarters suggest a company on a growth path, albeit with some fluctuations that appear to align with seasonal business cycles.
## Dividend Payments Table
| Date | Dividend |
|---|---|
| 2025-08-01 | 1.3 |
| 2025-05-02 | 1.3 |
| 2025-02-07 | 1.16 |
| 2024-11-01 | 1.16 |
| 2024-07-26 | 1.16 |
| 2024-04-25 | 1.16 |
| 2024-02-01 | 1.02 |
| 2023-12-27 | 15 |
The dividend data over the last eight quarters shows a notable trend and a few key changes in the dividend payouts. Initially, there is an unusually high dividend of 15 recorded on December 27, 2023. This spike could potentially be an anomaly or a special dividend, as it deviates significantly from the subsequent figures.
Following this peak, dividends normalize significantly, with a drop to 1.02 by February 1, 2024. This suggests a reset or a reevaluation of the dividend policy after the large payout. From February 2024 through July 2024, dividends consistently held at 1.16, indicating a stable policy during these periods.
Starting November 2024, dividends saw a modest increase to 1.16 and maintained this level until February 2025. The dividends then increased to 1.3 by May 2025 and remained stable at 1.3 through August 2025. This gradual increase suggests a positive adjustment in the dividend payouts, possibly reflecting improved company profitability or a strategic decision to enhance shareholder returns. Overall, the trend from an extraordinary high to a stabilization and slight increase in dividends reflects a dynamic approach to dividend distribution over the observed period.
The most recent rating changes for the company in question reflect a mix of market perspectives and adjustments in target prices.
1. **Wolfe Research – September 18, 2025:** Wolfe Research resumed coverage on the company, assigning a “Peer Perform” rating. This rating suggests that Wolfe Research views the company’s stock performance as likely to be on par with the average returns of its peers within the industry. No specific target price was provided, indicating a neutral stance on the stock’s future price movement.
2. **Erste Group – August 5, 2025:** Erste Group downgraded the company from “Buy” to “Hold.” This change indicates a shift in Erste Group’s outlook, suggesting that while previously seen as a potentially strong investment, the company now aligns more closely with average market performance expectations. This downgrade could be a result of various factors including market conditions, company performance, or sector dynamics, although no target price was specified.
3. **Mizuho – April 11, 2025:** Mizuho initiated coverage with a “Neutral” rating and set a target price of $975. The “Neutral” rating and the specific target price suggest that Mizuho forecasts a stable performance with limited upside potential. This initiation provides investors with a benchmark valuation from Mizuho’s perspective, reflecting a cautious optimism about the company’s stock value.
4. **Telsey Advisory Group – December 5, 2024:** Telsey Advisory Group reiterated an “Outperform” rating and increased the target price from $1000 to $1050. This adjustment indicates a positive outlook on the company’s future performance, suggesting that Telsey Advisory sees potential for the stock to outperform its peers or the broader market. The upward revision in the target price reflects an increased confidence in the company’s capacity to generate above-average returns.
These ratings and adjustments provide a spectrum of expectations, from neutral to optimistic, reflecting varying degrees of confidence in the company’s market performance and underlying business fundamentals.
The current price of the stock is $915.05, which is positioned below the average target price suggested by recent analyst ratings. Notably, Mizuho initiated coverage with a “Neutral” rating and a target price of $975 as of April 2025, indicating a potential upside. Moreover, in December 2024, Telsey Advisory Group reiterated an “Outperform” rating and adjusted their target price from $1000 to $1050, further suggesting a positive outlook above the current market price.
Recent changes in ratings include a downgrade by Erste Group in August 2025 from “Buy” to “Hold,” reflecting a more cautious stance towards the stock. Additionally, Wolfe Research resumed coverage in September 2025 with a “Peer Perform” status, indicating expectations of a performance in line with industry peers.
This analyst sentiment, combined with the target prices, suggests an expectation of growth or recovery in the stock’s value, albeit with a cautious acknowledgment of current market conditions as indicated by the mixed ratings of neutral and hold positions.
Disclaimer: The information provided here is for educational and informational purposes only and should not be interpreted as financial advice, investment recommendations, or trading guidance. Markets involve risk, and past performance is not indicative of future results. You should always conduct your own research and consult with a qualified financial advisor before making any investment decisions. By acting, you accept full responsibility for your choices.


