💎 Crypto Update: Binance Coin Declines 4.04% – Market Analysis
📊 Market Overview
Report Date: November 04, 2025
| Cryptocurrency | Symbol | Price (USD) | Daily Change (%) | MA50 | MA200 | RSI |
|---|---|---|---|---|---|---|
| Bitcoin | BTC | $104007.20 | -2.38% | $113443.75 | $109962.07 | 35.39 |
| Ethereum | ETH | $3507.63 | -2.63% | $4125.47 | $3372.10 | 33.88 |
| Binance Coin | BNB | $952.46 | -4.04% | $1093.15 | $813.85 | 33.91 |
| XRP | XRP | $2.27 | -1.50% | $2.68 | $2.62 | 36.11 |
| Solana | SOL | $161.18 | -2.96% | $205.60 | $179.88 | 31.21 |
| Dogecoin | DOGE | $0.17 | -1.30% | $0.22 | $0.21 | 31.73 |
| Cardano | ADA | $0.54 | -1.92% | $0.74 | $0.74 | 29.11 |
| Avalanche | AVAX | $16.62 | -0.16% | $25.26 | $23.05 | 29.33 |
| Polkadot | DOT | $2.59 | +0.41% | $3.56 | $3.91 | 31.80 |
| Chainlink | LINK | $15.08 | -1.06% | $19.86 | $17.97 | 33.86 |
🟠 Bitcoin

📈 Technical Analysis
As of the current trading session, Bitcoin (BTC) is priced at $104,007.20, reflecting a daily decline of 2.38%. The moving averages indicate a bearish trend, with the MA21 ($109,596.43) below the MA50 ($113,443.75) and MA100 ($113,924.17), suggesting potential pressure on the price. The MA200 ($109,962.07) may act as a near-term support level, while resistance is observed around the MA50.
The Relative Strength Index (RSI) at 35.39 points to oversold conditions, which could suggest a potential reversal if buying pressure increases. However, the MACD at -1661.42 indicates continued bearish momentum. Traders should be cautious, monitoring the potential for support around $100,000, while looking for any signs of bullish divergence for a potential recovery rally. Overall, a prudent approach is advisable until clearer bullish signals emerge.
⚪ Ethereum
📈 Technical Analysis
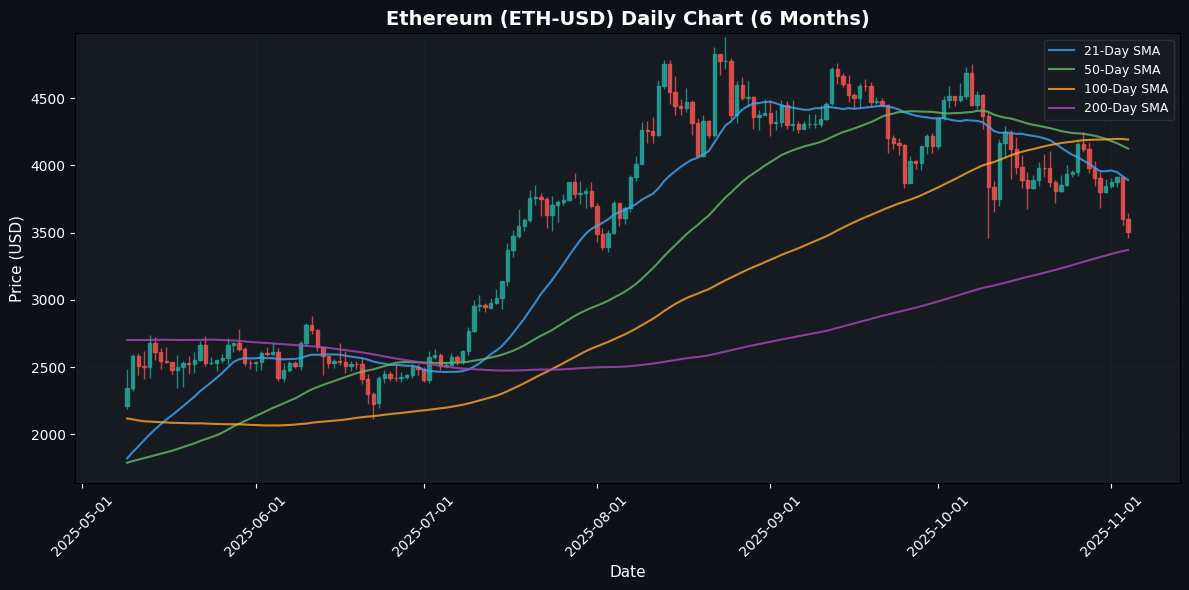
As of the latest data, Ethereum (ETH) is trading at $3507.63, reflecting a daily decline of 2.63%. The coin is currently positioned below key moving averages: MA21 at $3890.95, MA50 at $4125.47, MA100 at $4193.18, and MA200 at $3372.10. This indicates a bearish trend in the short to medium term, with resistance levels forming near MA21 and MA50.
The Relative Strength Index (RSI) is at 33.88, signaling that ETH is approaching oversold conditions, which might prompt a potential price rebound in the near term. However, the Negative MACD of -118.66 reflects weak momentum, suggesting that further downside is possible before a sustained recovery can commence.
Traders should monitor for potential support at the MA200, which could provide a critical level in the event of continued selling pressure. Caution is advised, as the current market
🟡 Binance Coin
📈 Technical Analysis
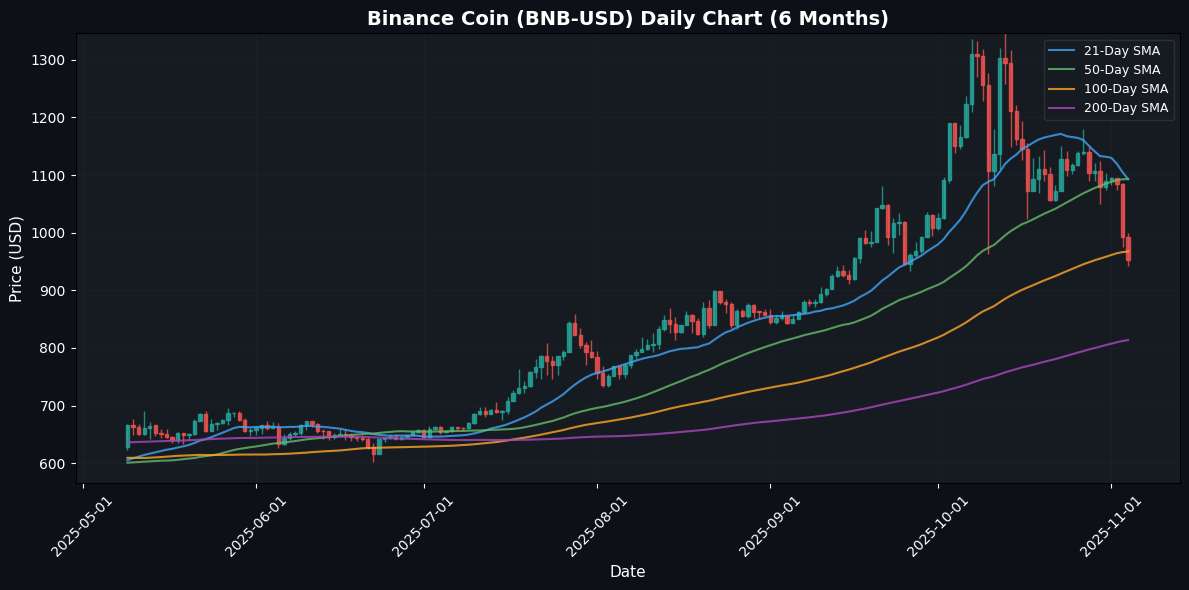
Binance Coin (BNB) is currently trading at $952.46, reflecting a daily decrease of 4.04%. The price remains significantly below the 21-day (MA21) and 50-day (MA50) moving averages, which are both around $1,092, indicating bearish momentum in the short term. The 100-day moving average (MA100) at $967.41 acts as a potential support level, while the 200-day moving average (MA200) at $813.85 provides a more substantial long-term support base.
The Relative Strength Index (RSI) at 33.91 suggests BNB is nearing oversold conditions, which could lead to a potential price rebound if buying pressure increases. However, the MACD reading of -22.50 indicates strong bearish momentum, signaling traders should exercise caution.
In summary, while a short-term reversal may be possible given the oversold RSI, the overall outlook remains bearish with significant resistance above current levels.
🔵 XRP
📈 Technical Analysis
XRP is currently trading at $2.27, reflecting a daily decline of 1.50%. The asset is situated below its moving averages, with MA21 at $2.46, indicating near-term resistance, while the MA50 at $2.68 adds further resistance at a mid-term level. The longer-term MAs—MA100 at $2.84 and MA200 at $2.62—suggest substantial resistance is present above current levels.
The Relative Strength Index (RSI) sits at 36.11, signaling that XRP is approaching oversold territory, which may indicate potential for a price rebound if buying interest increases. In contrast, the MACD reading of -0.07 highlights bearish momentum, reinforcing a cautious sentiment among traders.
Support is likely near the $2.20 level, while the resistance from MA21 poses a critical hurdle for bullish momentum. Traders should monitor the RSI for signs of a reversal and watch volume trends for confirmation of any potential breakout. Overall
🟣 Solana
📈 Technical Analysis
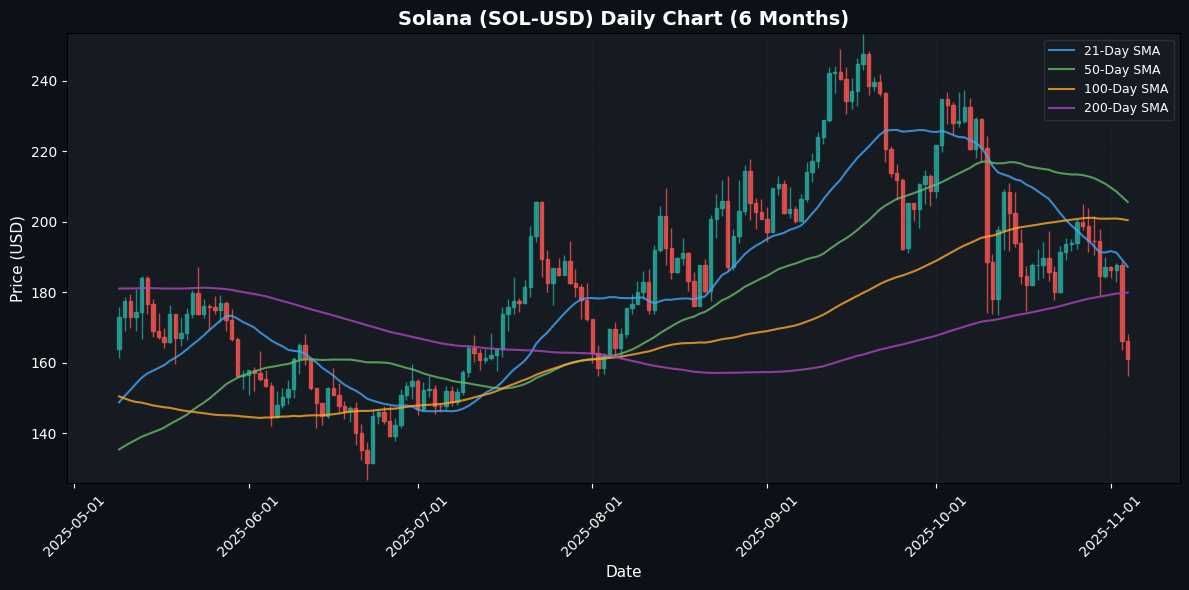
Solana (SOL) is currently trading at $161.18, reflecting a daily decline of 2.96%. The cryptocurrency’s short-term moving averages indicate bearish sentiment, with the 21-day MA at $187.22 below the 50-day MA of $205.60, suggesting the potential for continued downward price action. The 100-day MA also presents resistance at $200.43, while the 200-day MA at $179.88 adds a notable support level.
The Relative Strength Index (RSI) stands at 31.21, indicating that SOL is nearing oversold conditions, which may suggest a possible reversal if buying pressure increases shortly. However, the MACD reading of -7.97 reflects continued bearish momentum.
Traders should closely monitor key support around the $179 level while being cautious of resistance at $187.22 and above. A resurgence above the 21-day MA could offer a short-term entry point for bullish positions, but a sustained recovery would require
🟤 Dogecoin
📈 Technical Analysis
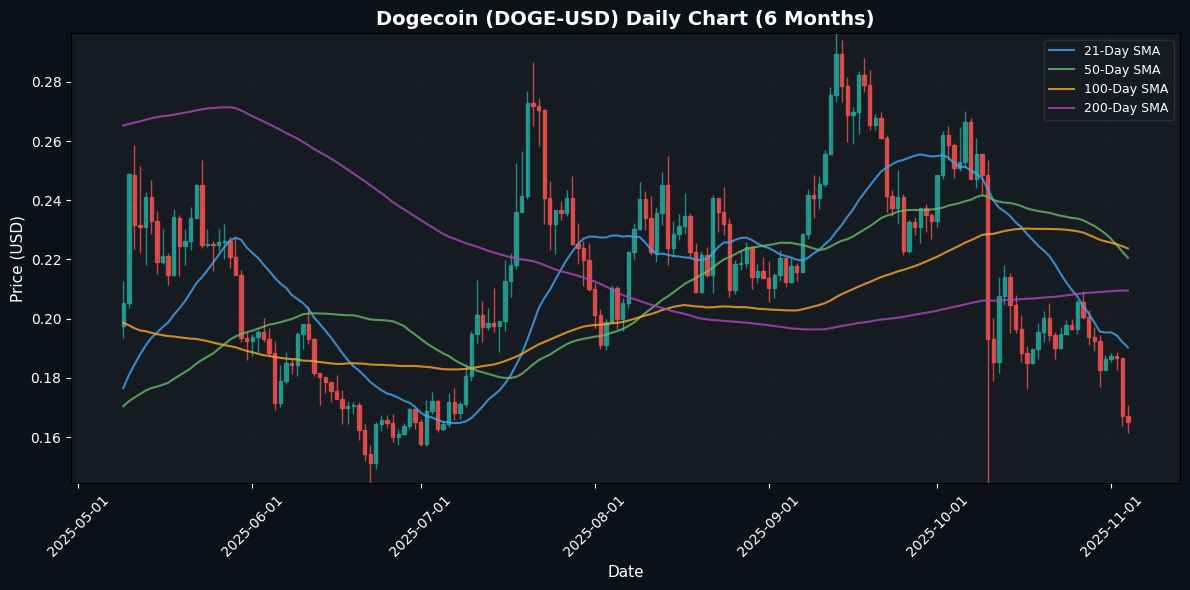
As of the latest data, Dogecoin (DOGE) is priced at $0.17, reflecting a daily decline of 1.30%. The moving averages indicate a bearish sentiment, with the 21-day (MA21) at $0.19, while longer-term averages (MA50 and MA100) stabilize around $0.22, suggesting resistance levels for upward movement.
The Relative Strength Index (RSI) is at 31.73, nearing the oversold threshold of 30, which may indicate a potential for short-term recovery unless further downward pressure develops. The MACD reading of -0.01 confirms the prevailing bearish momentum, although it is close to convergence, hinting at a possible trend reversal.
Traders should closely watch support around $0.15. A sustained bounce from this level coupled with a bullish MACD crossover could provide buying opportunities, whereas failure to hold support may see DOGE test lower levels.
🔵 Cardano
📈 Technical Analysis
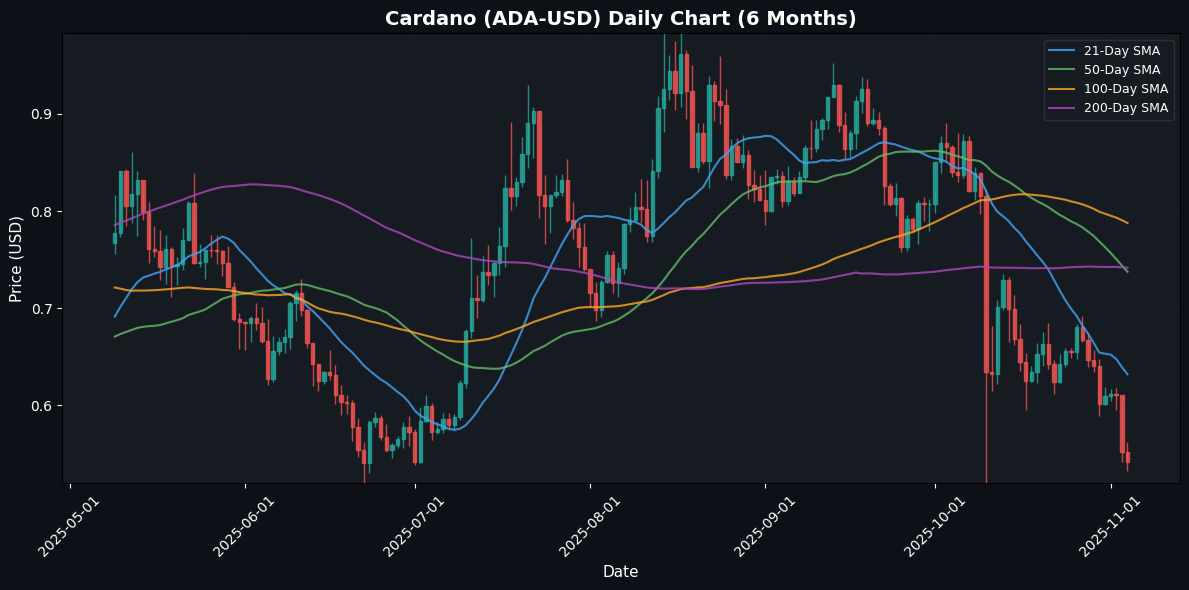
As of the current price of $0.54, Cardano (ADA) has experienced a daily decline of 1.92%. The moving averages indicate bearish momentum, with the 21-day MA ($0.63), 50-day MA ($0.74), and 100-day MA ($0.79) all positioned above the current price, suggesting significant resistance levels ahead. Notably, the 200-day MA ($0.74) further reinforces this resistance, emphasizing a prolonged downtrend.
The Relative Strength Index (RSI) of 29.11 indicates that ADA is in oversold territory, which could suggest a potential rebound if buying interest increases. However, the MACD at -0.04 confirms the bearish trend, with momentum favoring sellers in the short term.
Traders should closely monitor key support at $0.50. A break below this level could lead to further downside, while a rally above the MA21 could signal a short-term recovery. Caution is
🔴 Avalanche
📈 Technical Analysis
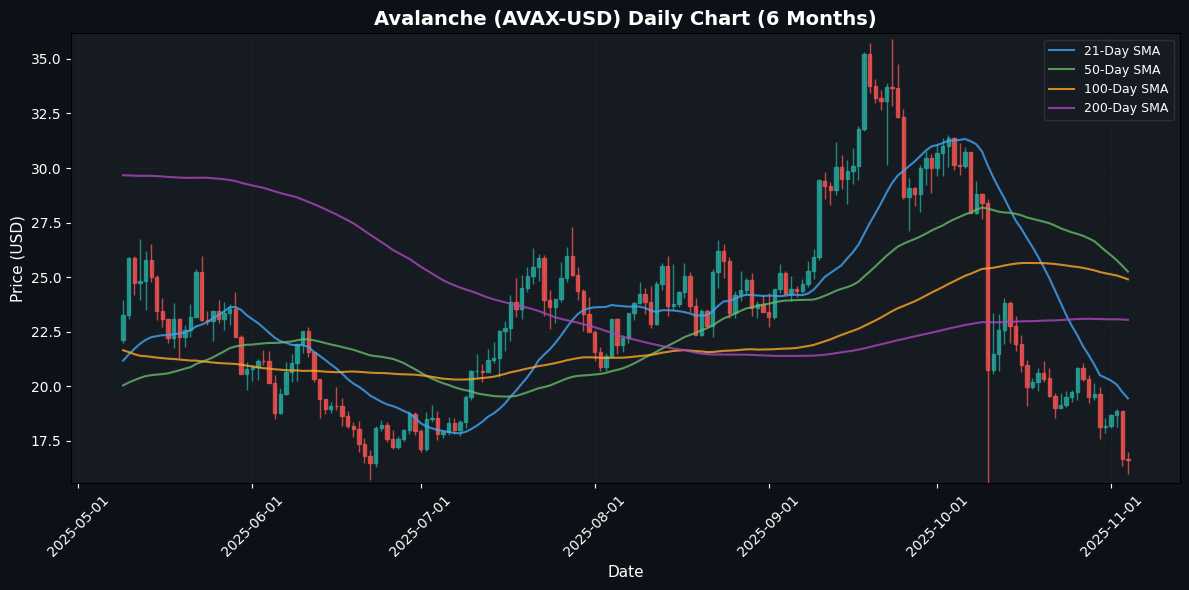
Avalanche (AVAX) is currently trading at $16.62, reflecting a slight daily decline of 0.16%. Technical indicators suggest significant bearish momentum, with the Relative Strength Index (RSI) at 29.33, indicating that AVAX is oversold, potentially signaling a reversal if buying interest emerges. However, its position below all major moving averages—MA21 at $19.45, MA50 at $25.26, MA100 at $24.90, and MA200 at $23.05—reinforces a negative trend, highlighting strong resistance ahead.
The MACD reading of -1.96 implies sustained bearish momentum, suggesting that sellers remain in control. Key support levels could be identified around the recent low, with a potential bounce back expected if the $15 mark holds. Traders should be cautious and monitor for any reversal signals, while also considering the oversold status for potential buy opportunities in a recovery scenario. Overall, a watchful approach is recommended amidst
🟣 Polkadot
📈 Technical Analysis
Polkadot (DOT) is currently priced at $2.59, reflecting a modest daily change of 0.41%. The moving averages indicate potential resistance, with the 21-day MA at $2.98 and the 50-day MA at $3.56, both positioned above the current price. The longer-term MAs (100-day at $3.75 and 200-day at $3.91) further emphasize bearish sentiment as DOT trades significantly below these levels.
The Relative Strength Index (RSI) at 31.80 suggests that DOT is approaching oversold conditions; however, the MACD reading of -0.21 indicates continued bearish momentum. Traders should closely watch the $2.50 support level, as a break below this could lead to further downside. Conversely, a rally must overcome the $2.98 resistance for a bullish reversal. Overall, cautious trading is advisable, focusing on potential rebounds at support while being aware of downward pressures from the moving averages.
🔵 Chainlink
📈 Technical Analysis
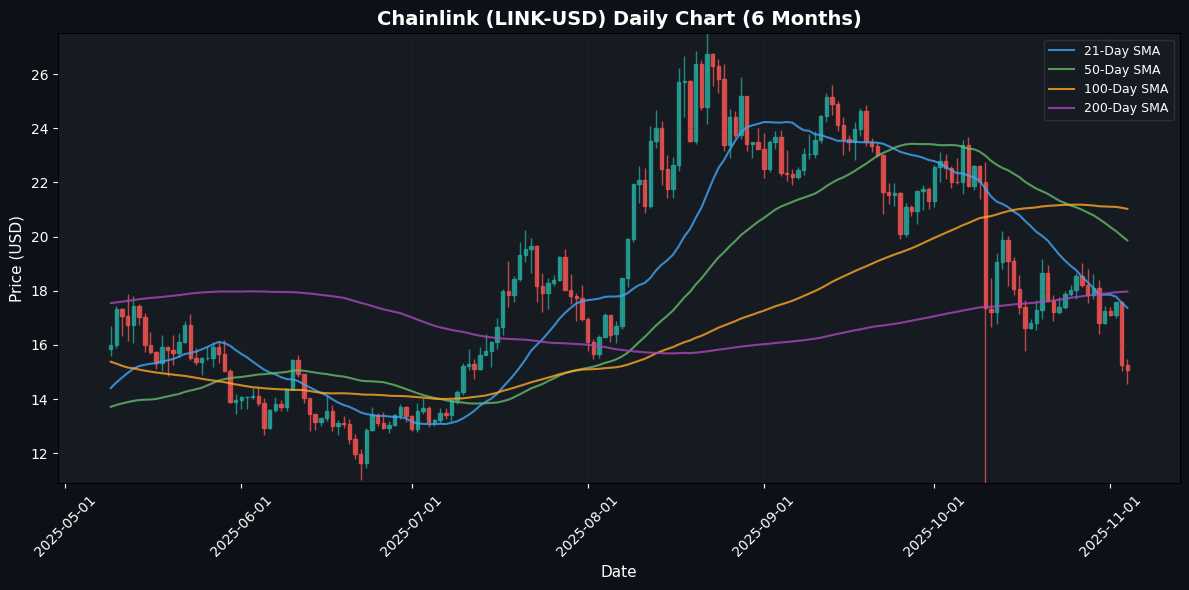
Chainlink (LINK) is currently trading at $15.08, reflecting a daily change of -1.06%, indicating bearish sentiment in the short term. The price is significantly below the 21-day moving average (MA21) of $17.37, suggesting continued downward pressure. Additionally, MA50, MA100, and MA200 levels also indicate a bearish trend as LINK remains trapped below these key moving averages, with the nearest resistance seen around MA21.
The Relative Strength Index (RSI) is at 33.86, indicating that LINK is approaching oversold territory, which might suggest a potential bounce in the near term. However, with a MACD reading of -1.00, the bearish momentum persists. A break below the critical support zone around $15 could lead to further declines. Traders should watch for potential reversals near this support but remain cautious, considering overall market conditions and sentiment before placing bullish bets.
⚠️ Disclaimer
The content on MarketsFN.com is provided for educational and informational purposes only. It does not constitute financial advice, investment recommendations, or trading guidance. Cryptocurrency markets are highly volatile, and all investments involve significant risks. Past performance does not guarantee future results. You are solely responsible for your investment decisions and should conduct independent research and consult a qualified financial advisor before acting. MarketsFN.com and its authors are not liable for any losses or damages arising from your use of this information.


