💎 Crypto Update: Chainlink Edges Higher 1.65% – Market Analysis
📊 Market Overview
Report Date: October 28, 2025
| Cryptocurrency | Symbol | Price (USD) | Daily Change (%) | MA50 | MA200 | RSI |
|---|---|---|---|---|---|---|
| Bitcoin | BTC | $114500.48 | +0.33% | $114369.09 | $109126.73 | 53.87 |
| Ethereum | ETH | $4118.31 | -0.04% | $4231.97 | $3296.54 | 51.43 |
| Binance Coin | BNB | $1136.17 | -0.31% | $1073.49 | $797.57 | 52.32 |
| XRP | XRP | $2.66 | +0.97% | $2.77 | $2.61 | 53.45 |
| Solana | SOL | $201.03 | +1.15% | $212.97 | $178.16 | 50.86 |
| Dogecoin | DOGE | $0.20 | -0.02% | $0.23 | $0.21 | 44.96 |
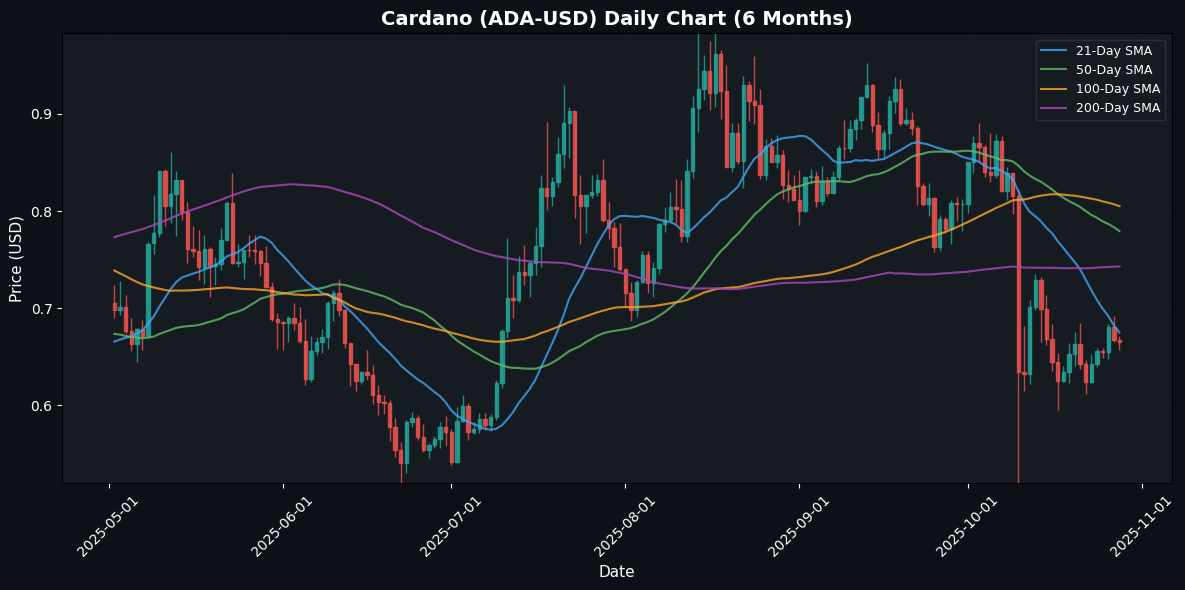
| Cardano | ADA | $0.67 | -0.30% | $0.78 | $0.74 | 43.34 |
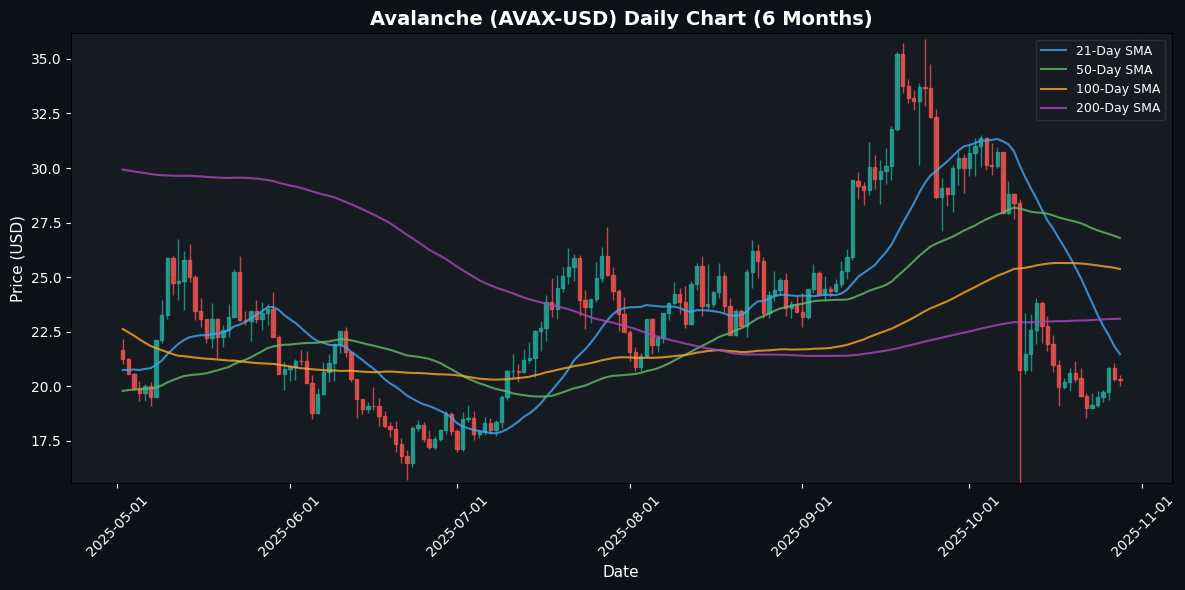
| Avalanche | AVAX | $20.29 | -0.18% | $26.79 | $23.10 | 38.12 |
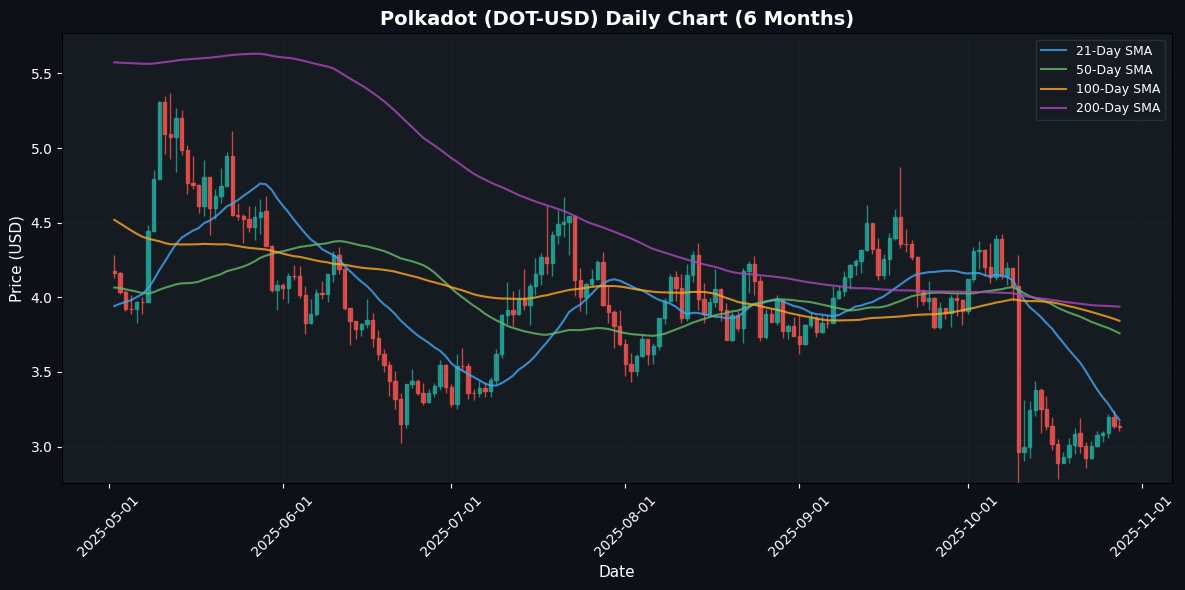
| Polkadot | DOT | $3.13 | -0.21% | $3.76 | $3.94 | 42.77 |
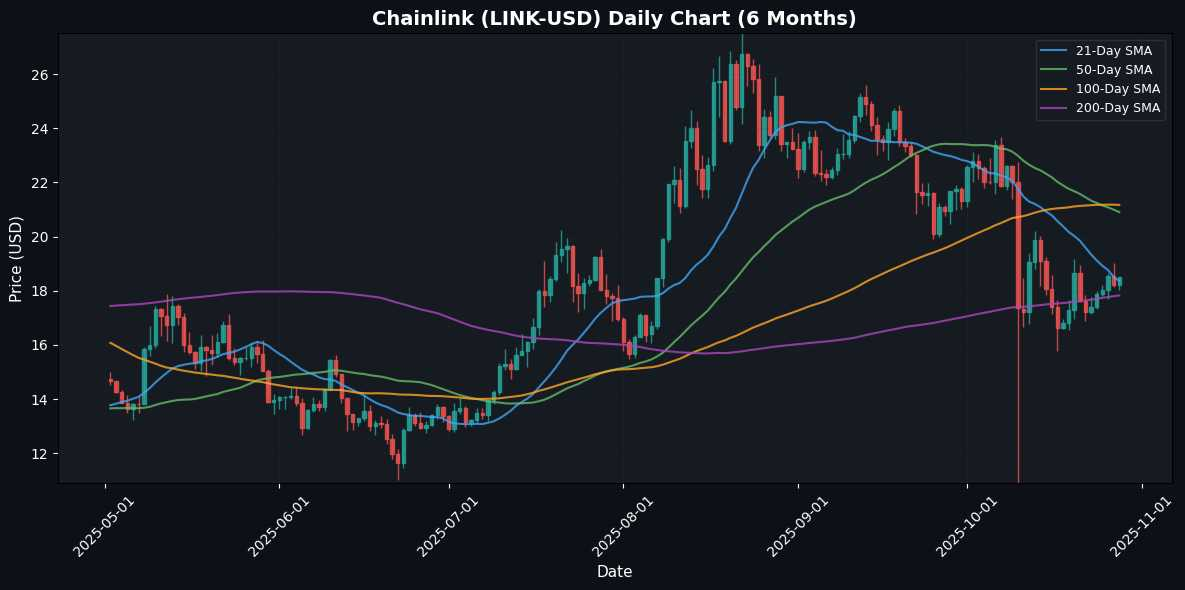
| Chainlink | LINK | $18.52 | +1.65% | $20.90 | $17.83 | 46.97 |
🟠 Bitcoin
📰 Market Drivers & News
No significant recent developments in Bitcoin have been reported in the last 12 hours following October 27, 2025, 10:33 PM. The cryptocurrency market appears stable with minimal price fluctuations, hovering around recent levels without notable surges or dips. Investor sentiment remains cautiously optimistic amid ongoing global economic uncertainties, but no fresh catalysts such as regulatory announcements, major adoption news, or whale movements have emerged to drive volatility. Technical indicators show consolidation patterns, suggesting a wait-and-see approach among traders. In the near term, this lull could persist unless external factors like macroeconomic data releases intervene, potentially leading to sideways trading until clearer signals appear.
📈 Technical Analysis
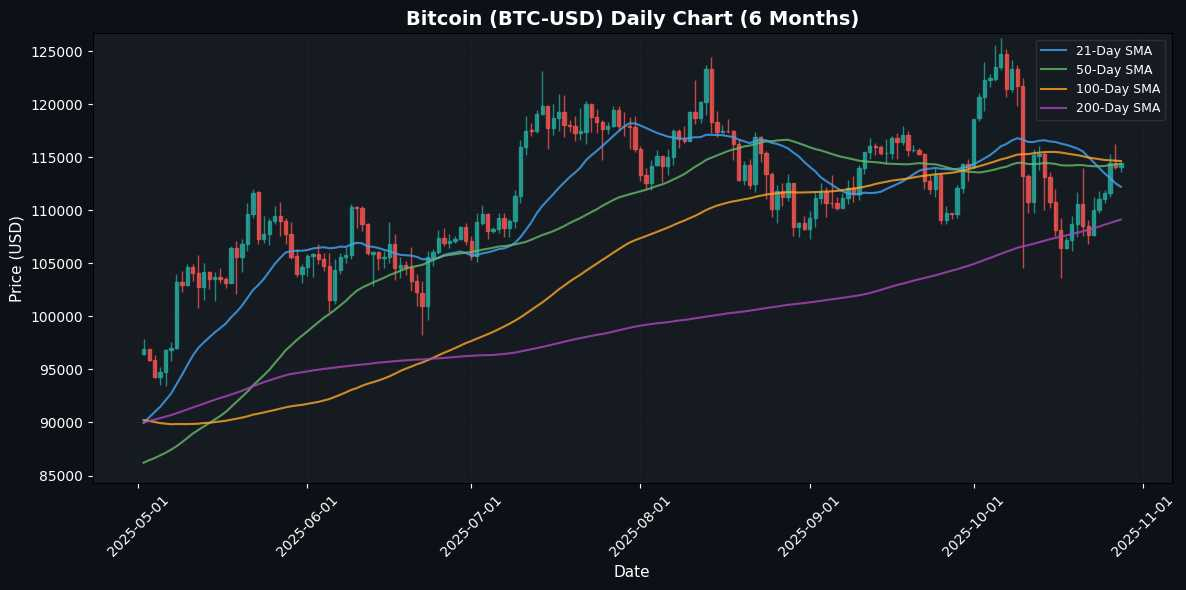
As of the current price of $114,500.48, Bitcoin (BTC) exhibits a slight daily change of 0.33%, indicating a period of consolidation. The price is trading above the 21-day moving average (MA21) of $112,216.01 and close to both the 50-day (MA50) at $114,369.09 and the 100-day (MA100) at $114,643.76, suggesting a bullish sentiment in the near term. The 200-day moving average (MA200) at $109,126.73 provides a significant support level.
The RSI at 53.87 signals neutral momentum, indicating potential for further price movement without being overbought. However, the MACD reading of -625.31 suggests bearish divergence, prompting cautious monitoring for potential trend reversals.
Traders should look for confirmation of support above the MA21 to capitalize on potential bullish momentum while being wary of resistance levels near the MA
⚪ Ethereum
📈 Technical Analysis
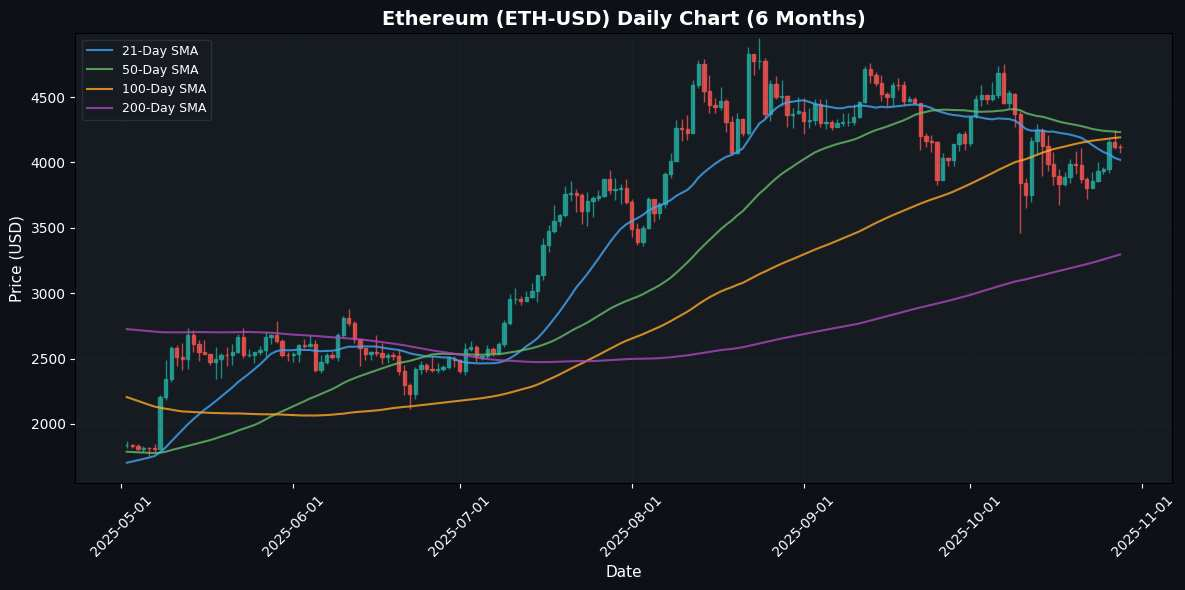
Ethereum (ETH) is currently priced at $4118.31, reflecting a slight daily change of -0.04%. The cryptocurrency exhibits mixed technical signals as it hovers near the key moving averages (MA). The 21-day MA at $4020.08 provides immediate support, indicating a potential bullish bounce if tested. However, both the 50-day MA at $4231.97 and the 100-day MA at $4191.98 suggest resistance ahead.
The RSI is at 51.43, denoting neutral momentum, while the MACD at -53.11 indicates bearish pressure in the short term. Traders should monitor the resistance levels closely; a break above $4232 could signal a potential bullish reversal. Conversely, failure to hold above $4020 could lead to further declines towards the 200-day MA at $3296.54. Given the current analysis, a cautious approach is warranted, favoring observation over aggressive positions until clearer momentum emerges.
🟡 Binance Coin
📈 Technical Analysis
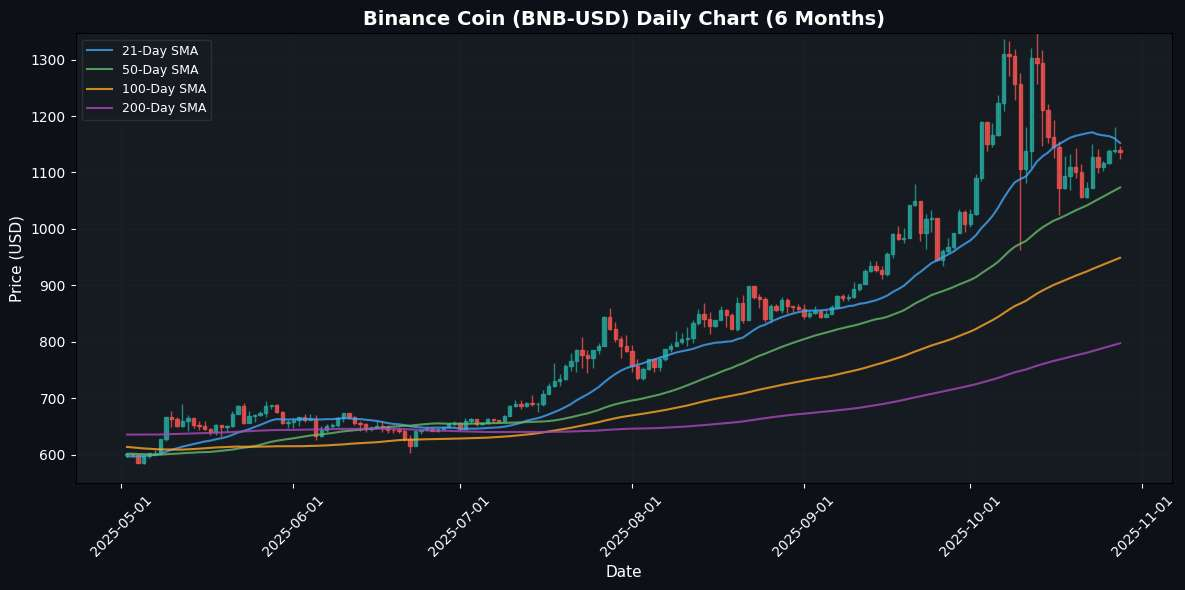
As of the latest data, Binance Coin (BNB) is trading at $1136.17, reflecting a slight daily decline of 0.31%. The price is currently positioned between the 21-day moving average (MA21) at $1152.15 and the 50-day moving average (MA50) at $1073.49, suggesting a consolidation phase. The MA100 and MA200 indicate long-term bullish support at $948.98 and $797.57, respectively.
The Relative Strength Index (RSI) at 52.32 indicates a neutral momentum, implying that BNB is neither overbought nor oversold at this time. The MACD value of 8.12 indicates a stable bullish momentum but lacks significant upward pressure.
Traders should watch for potential resistance at the MA21; a sustained breakout above this level could signal a return to upward bullish momentum, with targets aligning near $1200. Conversely, a fall below the MA50 may
🔵 XRP
📈 Technical Analysis
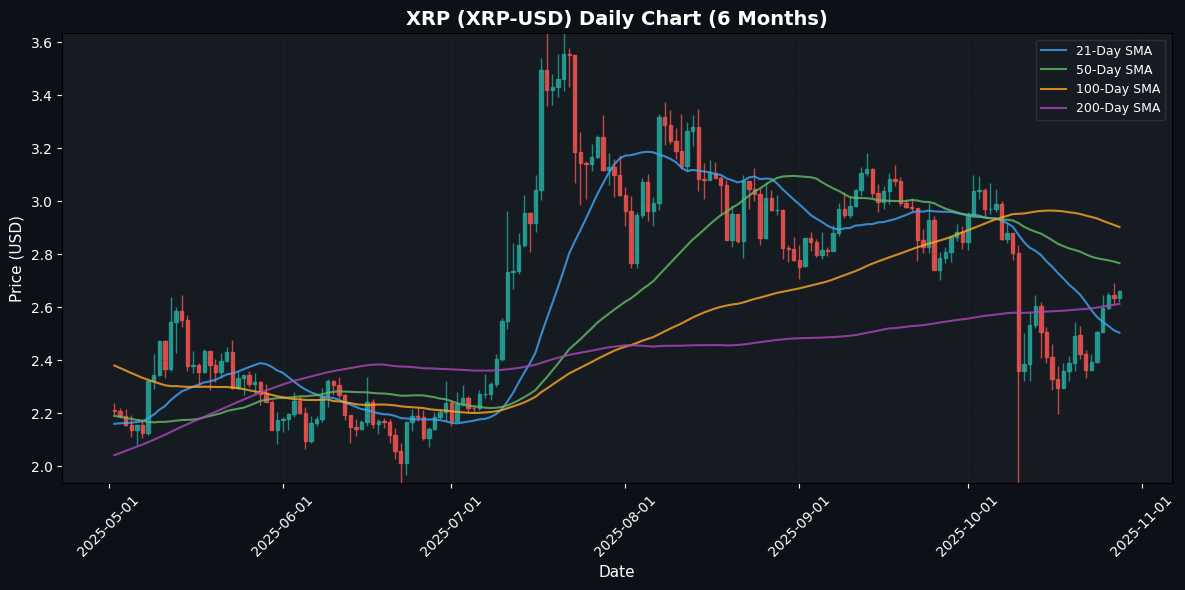
XRP is currently trading at $2.66, reflecting a daily increase of 0.97%. The price is situated above the 21-day moving average (MA21) of $2.50, indicating short-term bullish momentum. However, it remains below the 50-day moving average (MA50) at $2.77 and the 100-day MA at $2.90, suggesting potential resistance levels ahead. The 200-day moving average (MA200) at $2.61 provides a solid support level, indicating that any downward movement could be cushioned at this mark.
The Relative Strength Index (RSI) at 53.45 shows that XRP is nearing overbought territory but is not yet a concern, signaling sufficient room for upward movement. Conversely, the MACD at -0.05 indicates a potential bearish crossover if the trend doesn’t continue to gain strength.
Traders should look for a breakout above $2.77 for a bullish confirmation, while the $
🟣 Solana
📈 Technical Analysis
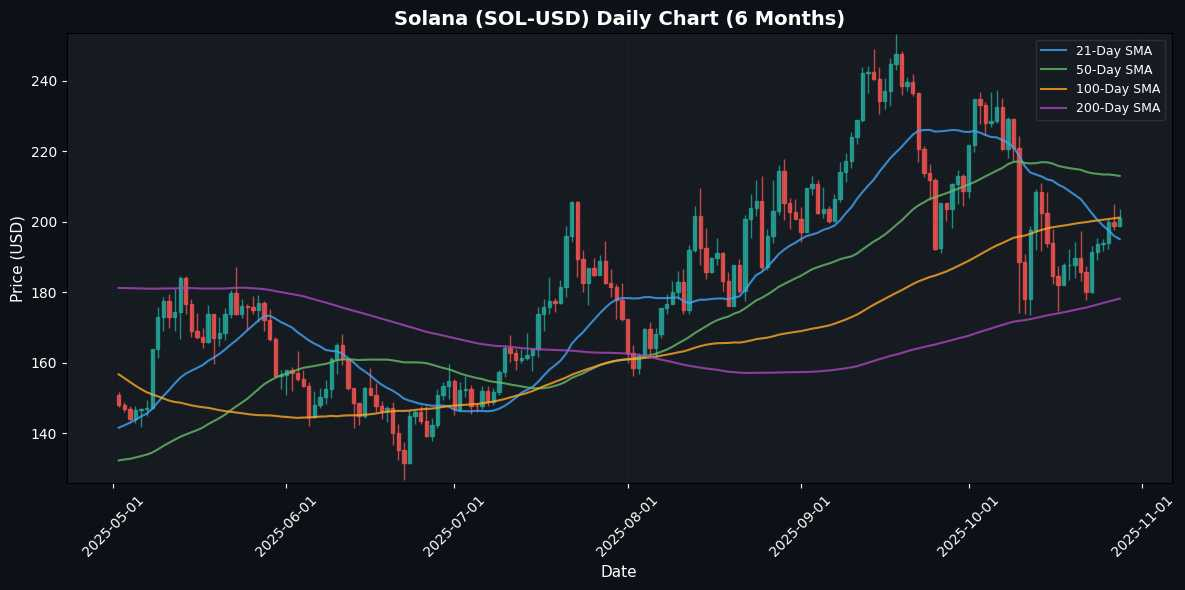
As of the current price of $201.03, Solana (SOL) exhibits a daily increase of 1.15%. Analyzing moving averages, the 21-day MA at $195.03 serves as potential support, while the 50-day MA at $212.97 may act as resistance. The price is notably close to the 100-day MA, which sits at $201.16, indicating a critical level to watch.
The Relative Strength Index (RSI) at 50.86 suggests that SOL is in a neutral zone, indicating neither overbought nor oversold conditions. The MACD at -4.07 indicates bearish momentum, as the signal line is above the MACD line.
Traders should monitor the $195-$200 support zone closely. A break above $212 could trigger bullish momentum, while a drop below $195 may lead to further declines. Overall, maintaining a cautious approach with an eye on the moving averages is advisable for informed trading decisions.
🟤 Dogecoin
📈 Technical Analysis
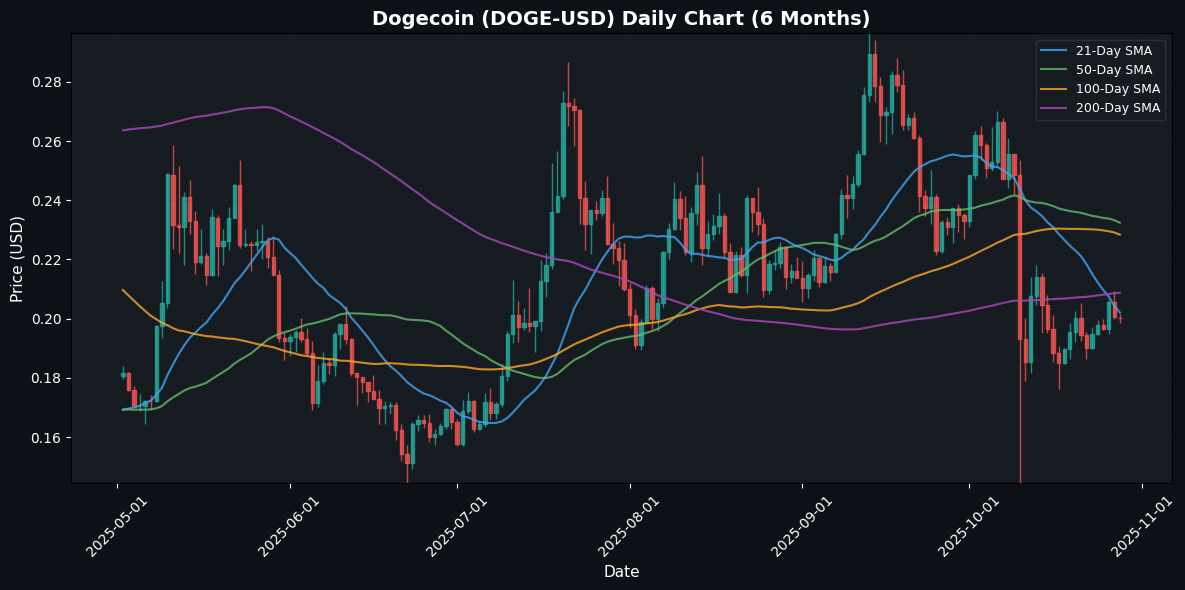
As of the current session, Dogecoin (DOGE) is trading at $0.20, reflecting a slight daily decline of 0.02%. The short-term moving average (MA21) aligns with the current price, indicating a potential area of support. However, its proximity to the longer-term MAs (MA50 and MA100 at $0.23) suggests possible resistance above this level.
The Relative Strength Index (RSI) at 44.96 indicates that DOGE is nearing the neutral territory, implying potential for both upward and downward momentum. Additionally, the MACD reading of -0.01 signals a lack of strong directional momentum, creating uncertainty in market sentiment.
Traders should closely monitor the $0.20 support level for signs of recovery. A break above $0.23 may indicate a bullish reversal, while a drop below $0.20 could prompt further downward pressure. Overall, maintaining vigilance in this range will be crucial for future positioning.
🔵 Cardano
📰 Market Drivers & News
In the last 12 hours, Cardano (ADA) has shown subdued activity amid a broader cryptocurrency market consolidation. Price has hovered around $0.35, with minimal volatility and no major breakouts, reflecting cautious investor sentiment as traders await clearer signals from macroeconomic indicators. Whale accumulation remains steady but not aggressive, with on-chain data indicating minor transfers that haven’t triggered significant volume spikes. Adoption trends are quiet, with no new partnerships or integrations announced, while technical developments focus on ongoing network optimizations without immediate hype. Regulatory news is absent, leaving sentiment neutral to slightly bearish among retail holders. Near-term implications suggest sideways trading persists unless external catalysts emerge, potentially capping upside potential while downside risks stay low in this stable phase.
📈 Technical Analysis
Cardano (ADA) is currently trading at $0.67, reflecting a slight daily decline of 0.30%. The token is hovering around its 21-day moving average (MA21) of $0.67, indicating a potential short-term support level. However, the failure to reclaim higher moving averages, with the 50-day (MA50) at $0.78 and 100-day (MA100) at $0.81, suggests a bearish outlook in the medium term. The RSI stands at 43.34, showing that ADA is nearing the oversold territory, which could indicate a potential bounce back if buying pressure increases. Meanwhile, the MACD at -0.03 signals weak momentum and potential bearish sentiment. Traders should monitor the $0.67 level for support; a drop below may open doors for further declines, while reclaiming the MA50 could provide a bullish reversal opportunity. Caution is advised as market sentiment remains subdued.
🔴 Avalanche
📈 Technical Analysis
Avalanche (AVAX) is currently priced at $20.29, reflecting a slight daily decrease of 0.18%. The cryptocurrency remains below its short-term moving average (MA21 of $21.47), indicating a bearish trend in the near term. Furthermore, the longer-term moving averages (MA50 at $26.79, MA100 at $25.38, and MA200 at $23.10) reinforce the downward momentum, suggesting significant resistance around these levels.
The Relative Strength Index (RSI) at 38.12 indicates that AVAX is nearing oversold territory, which may prompt a rebound if buying pressure increases. However, the MACD reading of -1.95 remains negative, indicating that bearish momentum prevails.
Traders should monitor falling support levels closely, with potential downside targets below $20, while upside resistance will be critical at around the MA21 and MA50. A clear breakout above these levels could signify a shift in market sentiment, warranting
🟣 Polkadot
📈 Technical Analysis
Polkadot (DOT) is currently priced at $3.13, reflecting a daily change of -0.21%. The cryptocurrency is showing signs of indecision, as it trades below its moving averages (MA21 at $3.18, MA50 at $3.76, MA100 at $3.84, and MA200 at $3.94), indicating short- to medium-term bearish momentum. The Relative Strength Index (RSI) sits at 42.77, suggesting that DOT is nearing a neutral territory, with potential for upward correction if it crosses above 50. Meanwhile, the MACD value of -0.19 points to bearish momentum but may signal a possible trend reversal if the histogram converges positively. Key support can be observed around the psychological level of $3.00, while resistance is likely at the MA21 at $3.18. Traders should watch for volume surges, which could provide insights into momentum shifts and potential breakouts. Caution
🔵 Chainlink
📰 Market Drivers & News
No significant recent developments in the past 12 hours. Chainlink (LINK) has shown minimal price volatility during this period, trading in a narrow range around $12.50 with subdued volume. Investor sentiment remains cautious amid broader market consolidation, lacking fresh catalysts like regulatory updates or major adoption announcements. Without notable whale activity or technical breakthroughs reported, the asset’s momentum appears stagnant. Near-term implications suggest continued sideways movement unless external factors, such as Bitcoin’s performance, intervene to spark renewed interest.
📈 Technical Analysis
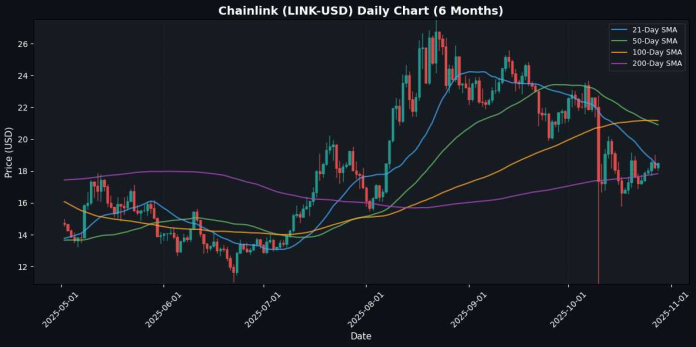
As of the current price of $18.52, Chainlink (LINK) shows a daily change of +1.65%, signaling a modest recovery. The price is trading above the 21-day moving average (MA21) at $18.36, indicating short-term bullish momentum. However, with the 50-day MA at $20.90 and the 100-day MA at $21.17 acting as resistance levels, LINK faces a challenge to regain upward momentum.
The relative strength index (RSI) at 46.97 suggests that LINK is in a neutral zone, lacking significant buying or selling pressure. Additionally, the MACD reading of -0.79 indicates bearish momentum, potentially limiting upside potential in the short term.
Key support can be seen at the 200-day MA of $17.83. Traders should watch for breakouts above $20.90 for bullish signals, while maintaining caution around this neutral momentum. A consolidation period may precede further price movements,
⚠️ Disclaimer
The content on MarketsFN.com is provided for educational and informational purposes only. It does not constitute financial advice, investment recommendations, or trading guidance. Cryptocurrency markets are highly volatile, and all investments involve significant risks. Past performance does not guarantee future results. You are solely responsible for your investment decisions and should conduct independent research and consult a qualified financial advisor before acting. MarketsFN.com and its authors are not liable for any losses or damages arising from your use of this information.


