Cryptocurrencies Slide , TRON Outperforms
🪙 Market Overview
Cryptocurrency markets on October 21, 2025 showcase the top 10 digital assets by market activity and adoption. This comprehensive analysis covers Bitcoin, Ethereum, and leading altcoins, examining market drivers, technical patterns, and trading dynamics across the crypto ecosystem.
Performance Summary
| Cryptocurrency | Symbol | Price (USD) | Daily % | MA21 | MA50 | MA100 | MA200 | RSI | MACD |
|---|---|---|---|---|---|---|---|---|---|
| Bitcoin | BTC | $107,793.07 | -2.53% | $115,526.94 | $114,240.13 | $115,090.65 | $108,019.84 | 39.80 | -2121.35 |
| Ethereum | ETH | $3,866.10 | -2.88% | $4,188.56 | $4,278.17 | $4,151.44 | $3,212.58 | 41.40 | -114.48 |
| Binance Coin | BNB | $1,069.36 | -2.88% | $1,167.84 | $1,037.38 | $921.01 | $778.45 | 45.91 | 14.77 |
| XRP | XRP | $2.41 | -3.32% | $2.65 | $2.81 | $2.95 | $2.59 | 39.56 | -0.14 |
| Solana | SOL | $184.45 | -2.79% | $206.41 | $214.71 | $199.68 | $175.32 | 40.48 | -8.75 |
| Dogecoin | DOGE | $0.1937 | -3.21% | $0.2211 | $0.2357 | $0.2303 | $0.2073 | 40.35 | -0.01 |
| Cardano | ADA | $0.6418 | -3.23% | $0.7400 | $0.8042 | $0.8149 | $0.7412 | 37.25 | -0.05 |
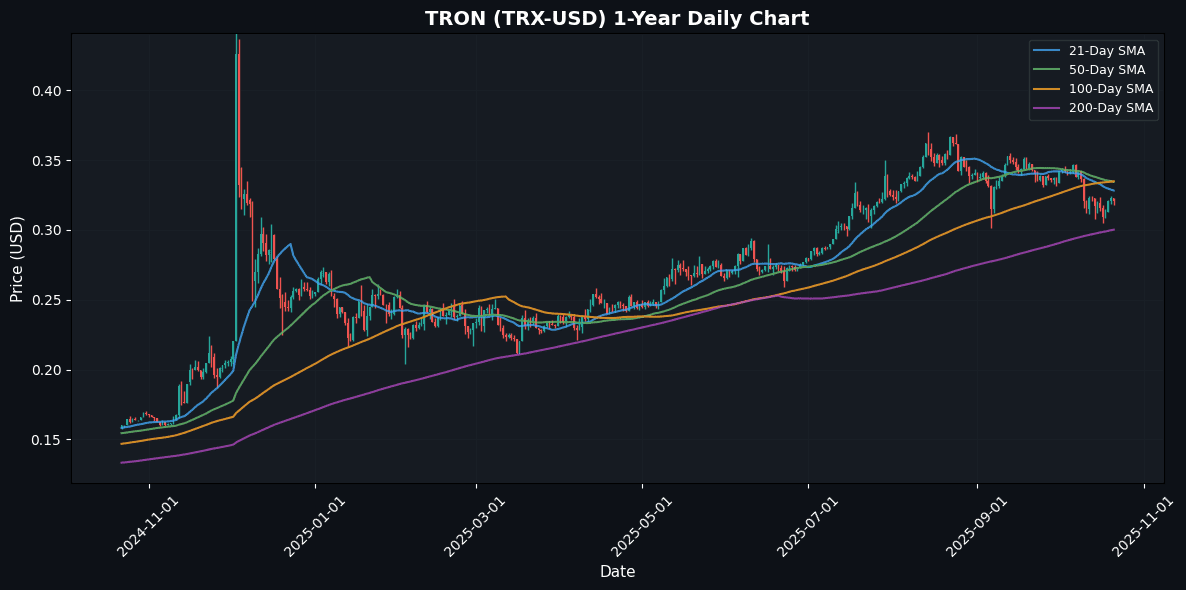
| TRON | TRX | $0.3208 | -0.59% | $0.3282 | $0.3346 | $0.3347 | $0.3002 | 44.49 | -0.01 |
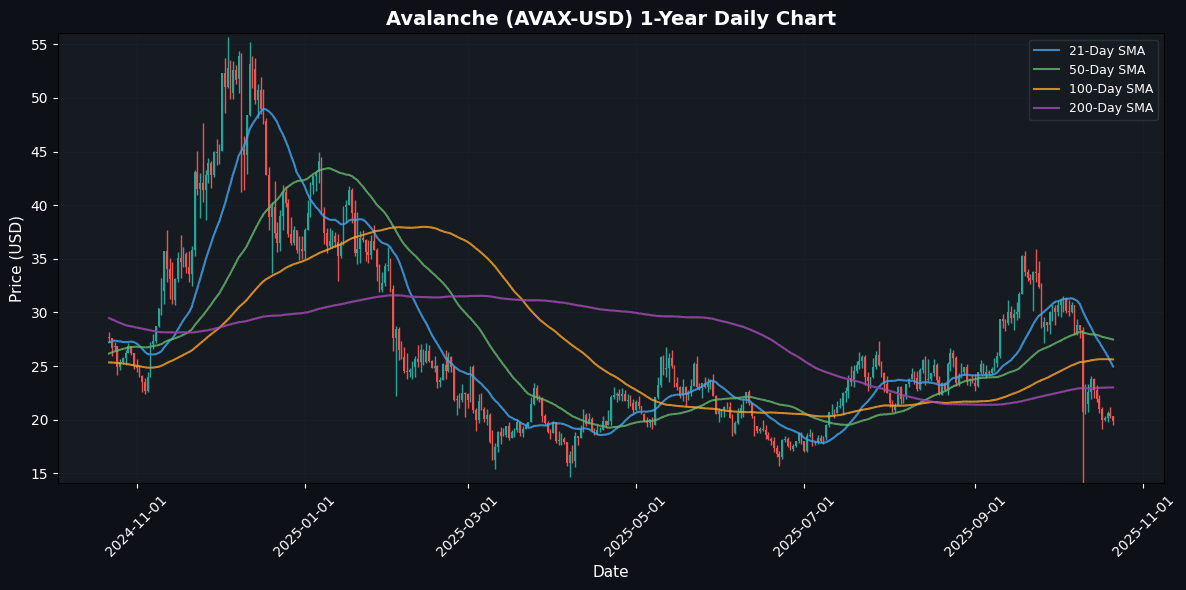
| Avalanche | AVAX | $19.86 | -2.43% | $24.97 | $27.48 | $25.63 | $23.02 | 31.79 | -2.46 |
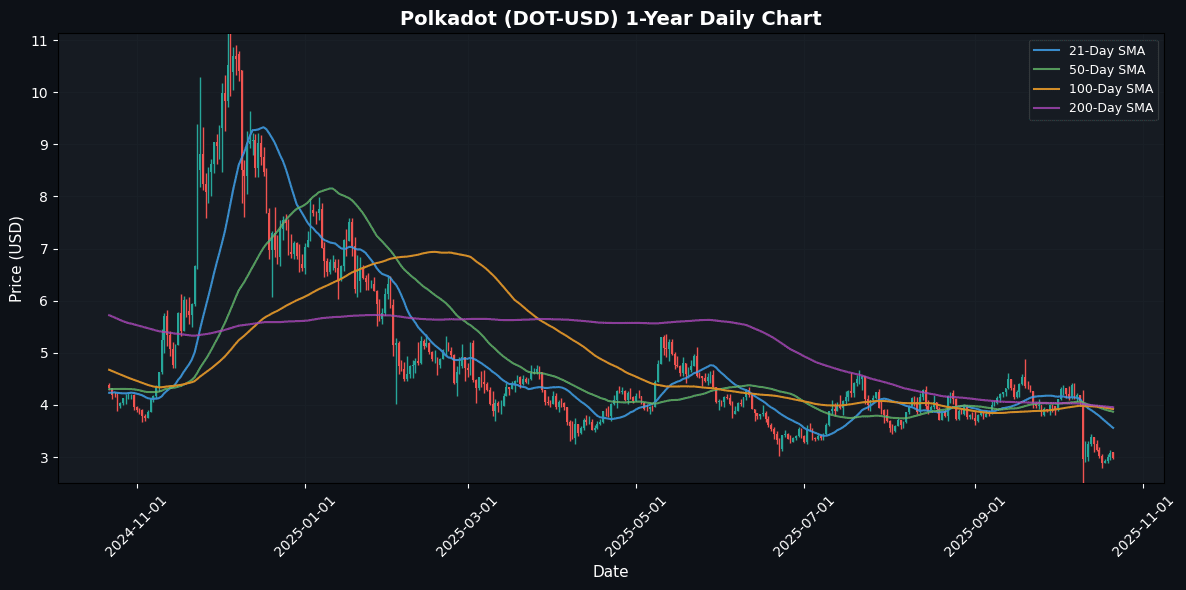
| Polkadot | DOT | $2.98 | -3.45% | $3.56 | $3.87 | $3.92 | $3.96 | 36.05 | -0.29 |
🟠 Bitcoin (BTC)
Price: $107,793.07 (-2.53%)
The original cryptocurrency and largest by market cap; often used as a benchmark for the entire market.
📰 Market Drivers & News
Bitcoin’s market landscape today reflects a blend of resilience and caution amid ongoing volatility. Key events include heightened institutional inflows into spot ETFs, bolstering liquidity despite short-term profit-taking pressures. Adoption continues to accelerate, with major corporations expanding treasury allocations and emerging markets embracing Bitcoin as a hedge against inflation, signaling robust ecosystem growth.
Regulatory winds appear favorable, as global policymakers signal clearer frameworks for digital assets, potentially easing compliance burdens for innovators. On the technology front, network hashrate surges underscore miners’ commitment post-halving, while upgrades to scalability protocols enhance transaction efficiency and support layer-2 innovations.
Sentiment remains cautiously optimistic, with traders navigating dynamic volumes driven by macroeconomic cues. In DeFi and partnerships, cross-chain bridges and NFT marketplace integrations are fostering interoperability, unlocking new use cases.
Near-term, expect continued fluctuations as market participants digest these developments, with potential for upward momentum if adoption trends solidify.
📈 Technical Analysis
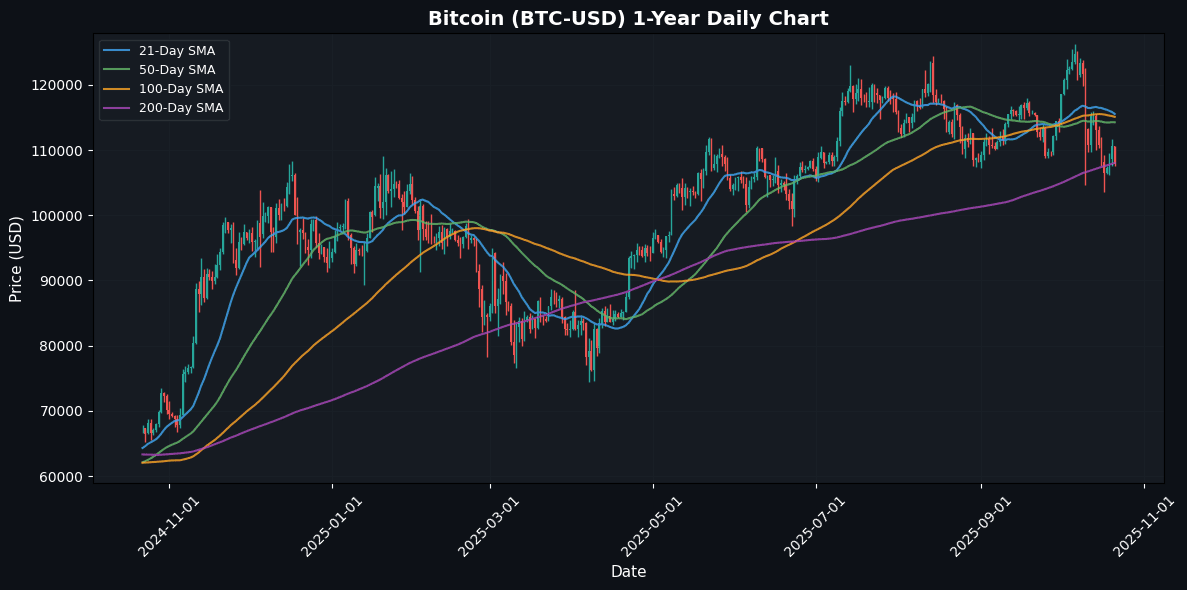
Bitcoin (BTC) is currently trading at $107,793.07, reflecting a daily decline of 2.53%. Analyzing the short-term trend, the price is trading below the key moving averages (MA21: $115,526.94, MA50: $114,240.13, MA100: $115,090.65), indicating bearish momentum. The decline below these MAs suggests continued weakness, with the MA200 at $108,019.84 acting as a potential support level.
Momentum indicators reveal that the RSI is at 39.80, suggesting oversold conditions and the potential for a bullish reversal, though with MACD at -2121.35, momentum remains firmly negative.
Traders should watch for a potential price bounce around the MA200 support level, while resistance is clearly defined at the MA21 and MA50 levels. A break below $108,019.84 could open the floor for further downside targets. Monitoring these technical levels will
⚪ Ethereum (ETH)
Price: $3,866.10 (-2.88%)
Leading smart-contract platform powering DeFi, NFTs, and token ecosystems.
📰 Market Drivers & News
Ethereum’s ecosystem continues to navigate a landscape of resilience amid persistent volatility, with traders expressing frustration over repeated shakeouts that test conviction. Key market-moving events include heightened institutional inflows into spot products, bolstering long-term holder confidence despite short-term turbulence. Adoption momentum persists through expanding Layer 2 solutions, driving scalability and user onboarding, while ecosystem growth is evident in surging DeFi total value locked and renewed NFT marketplace activity fueled by creator partnerships.
Regulatory clarity advances with ongoing affirmations of Ethereum’s commodity status, easing compliance burdens for developers and exchanges. Technologically, post-upgrade network efficiency shines through increased transaction throughput and lower fees, supporting dApp proliferation. Sentiment remains cautiously optimistic, with trading dynamics reflecting profit-taking alongside accumulation by whales.
Partnerships with traditional finance entities signal broader integration, yet internal debates, such as scaling solution leaders voicing loyalty concerns, underscore competitive pressures. Near-term outlook points to potential stabilization if regulatory tailwinds and adoption metrics gain traction, fostering renewed upward momentum.
📈 Technical Analysis
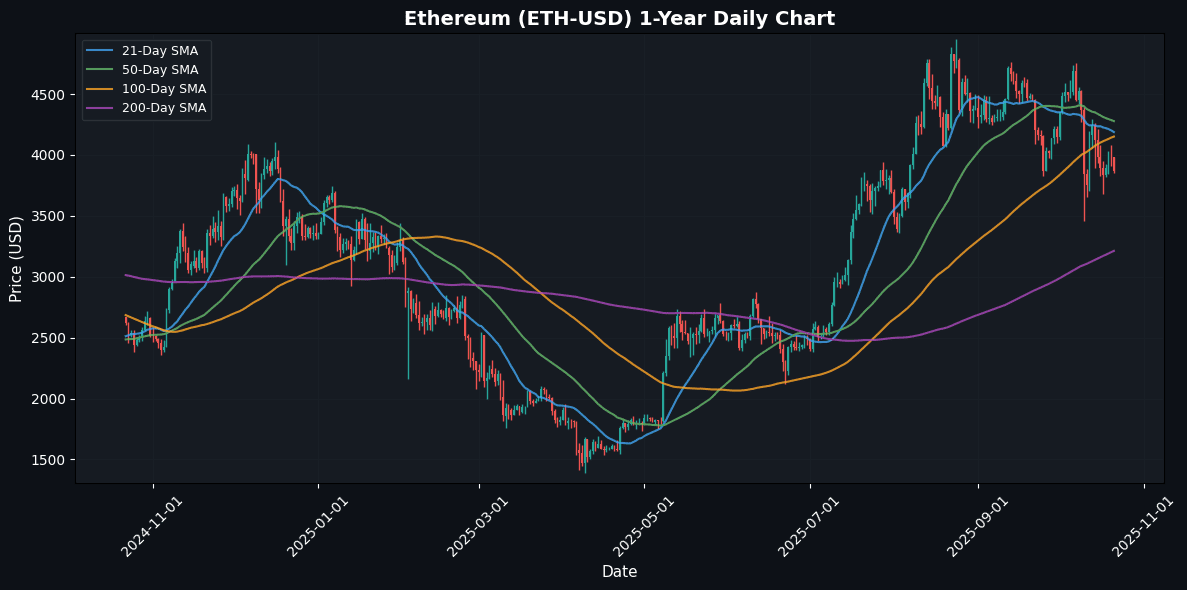
Ethereum (ETH) is currently trading at $3866.10, reflecting a daily decline of 2.88%. The price remains below key short-to-medium-term moving averages, with the 21-day MA at $4188.56, the 50-day MA at $4278.17, and the 100-day MA at $4151.44. This positioning suggests a bearish sentiment, as the recent price action has been unable to find support at these moving averages.
The Relative Strength Index (RSI) at 41.40 indicates potential oversold conditions, but it lacks a definitive bullish signal at this time. The MACD at -114.48 suggests that momentum is still in a downtrend, reinforcing the current bearish outlook.
Support can be observed around the $3600 level, while resistance is present near the 21-day MA and the previous high near $4200. Traders should monitor these levels closely for signs of potential reversal or continuation, with a cautious approach recommended
🟡 Binance Coin (BNB)
Price: $1,069.36 (-2.88%)
Utility token of the Binance exchange; supports trading fee discounts and BNB Chain gas fees.
📰 Market Drivers & News
Binance Coin (BNB) is navigating a complex landscape of regulatory scrutiny and ecosystem expansion amid heightened global attention. A South Korean lawmaker’s push for Binance to address compensation for victims of frozen funds in a local exchange’s deposit program underscores ongoing tensions in the region’s crypto regulations, potentially influencing user trust and compliance strategies. Meanwhile, BNB Chain’s ecosystem continues to thrive, with surging adoption in DeFi protocols that leverage its low-cost transactions for yield farming and lending innovations. Partnerships with emerging blockchain projects are bolstering interoperability, while recent network upgrades enhance scalability and security, drawing more developers to build decentralized applications.
Market sentiment remains cautiously optimistic, driven by robust trading volumes and community engagement, though regulatory uncertainties temper enthusiasm. DeFi and NFT sectors on BNB show resilient growth, with new token launches and cross-chain collaborations fostering liquidity.
In the near term, BNB’s outlook points to steady consolidation, contingent on clearer regulatory resolutions and sustained ecosystem momentum.
📈 Technical Analysis
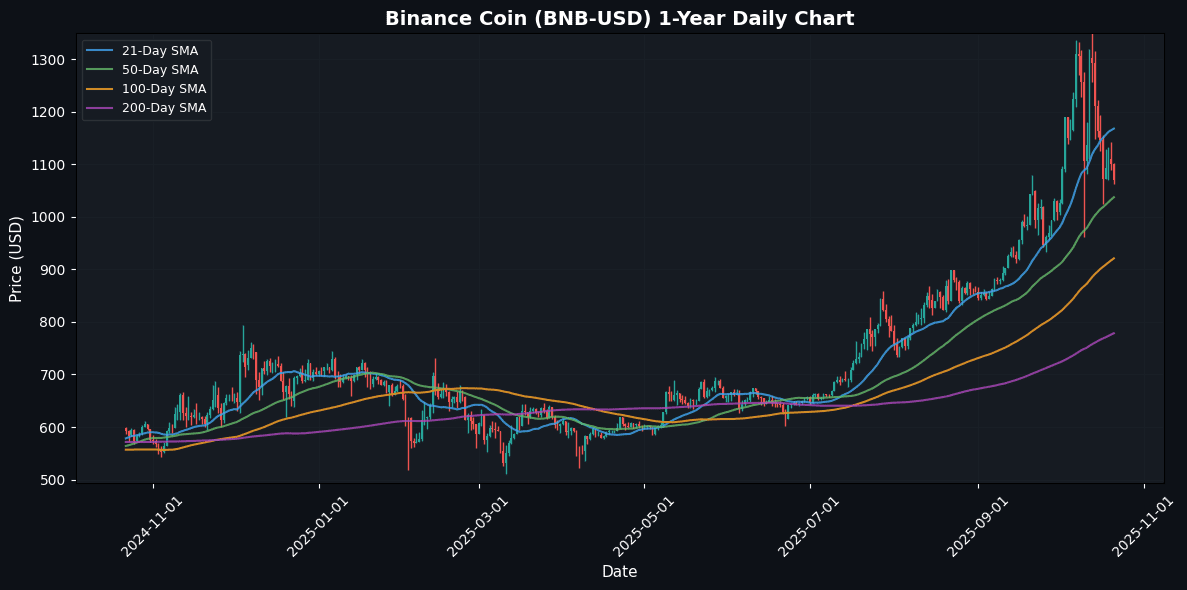
Binance Coin (BNB) is currently trading at $1069.36, reflecting a daily decline of 2.88%. The price is positioned between the 21-day moving average (MA21) at $1167.84 and the 50-day moving average (MA50) at $1037.38, suggesting potential volatility in the near term. The descending proximity to the MA21 indicates bearish momentum, while the MA50 serves as immediate support.
The Relative Strength Index (RSI) at 45.91 denotes a neutral positioning, suggesting a lack of strong buying or selling pressure. However, a MACD value of 14.77 indicates that bullish momentum may still be present, albeit weakening.
Potential resistance is identified near $1167.84 (MA21), while strong support can be found around $1037.38 (MA50). Traders should watch for a potential crossover between shorter and longer moving averages to confirm trend reversals, alongside RSI dynamics, to gauge
🔵 XRP (XRP)
Price: $2.41 (-3.32%)
Used for cross-border payments; issued by Ripple Labs and widely traded despite past legal scrutiny.
📰 Market Drivers & News
XRP’s ecosystem is buzzing with renewed vigor amid a surge in institutional interest, highlighted by a major fundraising initiative that underscores growing confidence in Ripple’s cross-border payment solutions. Adoption continues to accelerate, with expanded partnerships in emerging markets driving real-world utility for remittances and treasury management. Regulatory horizons appear brighter, as ongoing clarity from global watchdogs fosters a more supportive environment for blockchain innovation, potentially easing barriers for enterprise integration.
Technologically, the network sees heightened activity, including upgrades to enhance scalability and interoperability, bolstering its appeal for high-volume transactions. In DeFi and partnerships, fresh collaborations with fintech platforms are integrating XRP for liquidity provision, while NFT initiatives on sidechains gain traction for digital asset tokenization.
Market sentiment leans optimistic, with traders navigating post-volatility recovery through increased volume and bullish positioning. Near-term outlook suggests sustained momentum if institutional inflows persist, positioning XRP for further ecosystem expansion.
📈 Technical Analysis
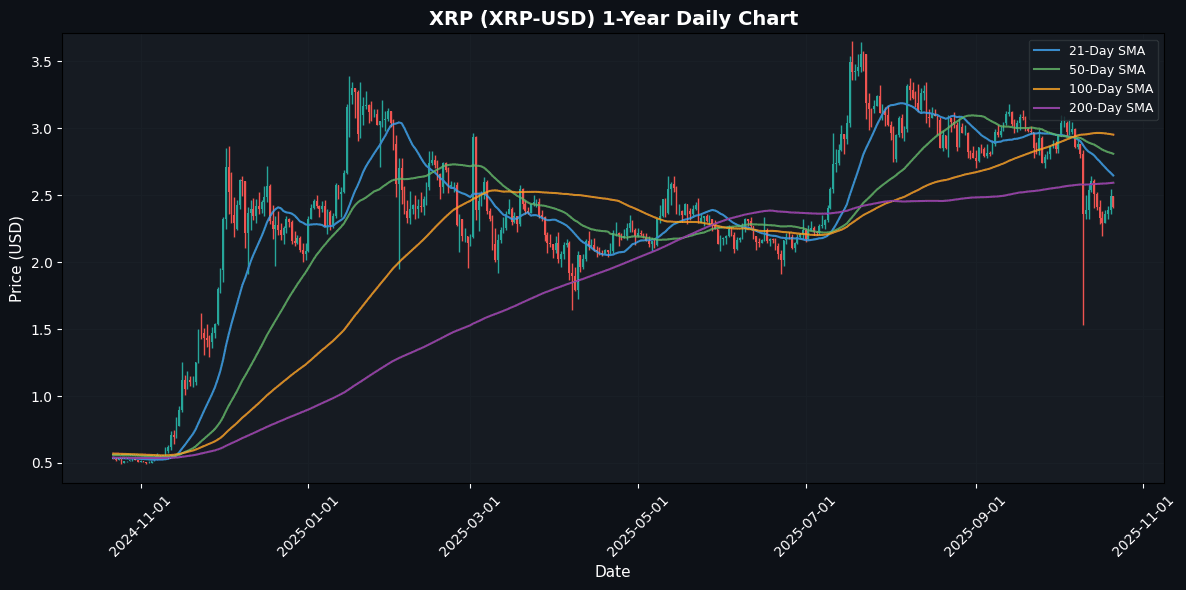
XRP is currently priced at $2.41, reflecting a daily decline of 3.32%. The price remains below key moving averages, with the MA21 at $2.65, MA50 at $2.81, and MA200 at $2.59, indicating a bearish short- to medium-term trend. The simple moving averages suggest that resistance is likely to be strongest near the MA50 and MA200, while support levels could emerge near recent lows or psychological levels.
The Relative Strength Index (RSI) at 39.56 indicates that XRP is approaching oversold territory, which may suggest a potential reversal soon if buying interest returns. However, the MACD at -0.14 confirms a negative momentum trend, indicating that sellers are currently in control.
Overall, traders should remain cautious, watching for key support levels around $2.30. A break below could lead to further downside, while a rally above $2.65 would signal a potential bullish reversal.
🟣 Solana (SOL)
Price: $184.45 (-2.79%)
High-performance blockchain optimized for speed and scalability; popular in DeFi and NFT markets.
📰 Market Drivers & News
Solana’s ecosystem continues to demonstrate resilience and innovation amid broader market volatility. Key developments include a major firm’s reaffirmation of its treasury strategy through investor share resale rights, signaling strong conviction in Solana’s long-term potential despite short-term share pressures. Co-founder Anatoly Yakovenko’s announcement of Percolator, a sharded perpetuals DEX built natively on the blockchain, underscores ongoing technological advancements aimed at enhancing DeFi scalability and efficiency.
Adoption momentum builds with surging activity in meme coin launches and NFT marketplaces, driving ecosystem growth as developers flock to Solana’s high-throughput network. Partnerships in payments and gaming further bolster real-world utility, while network upgrades like improved consensus mechanisms ensure robust performance during peak loads. Regulatory landscapes remain neutral, with no major policy shifts impacting Solana directly.
Market sentiment tilts bullish, fueled by these fundamentals and vibrant trading dynamics in DeFi protocols. Near-term outlook points to sustained interest, potentially amplifying growth if innovation momentum persists.
📈 Technical Analysis
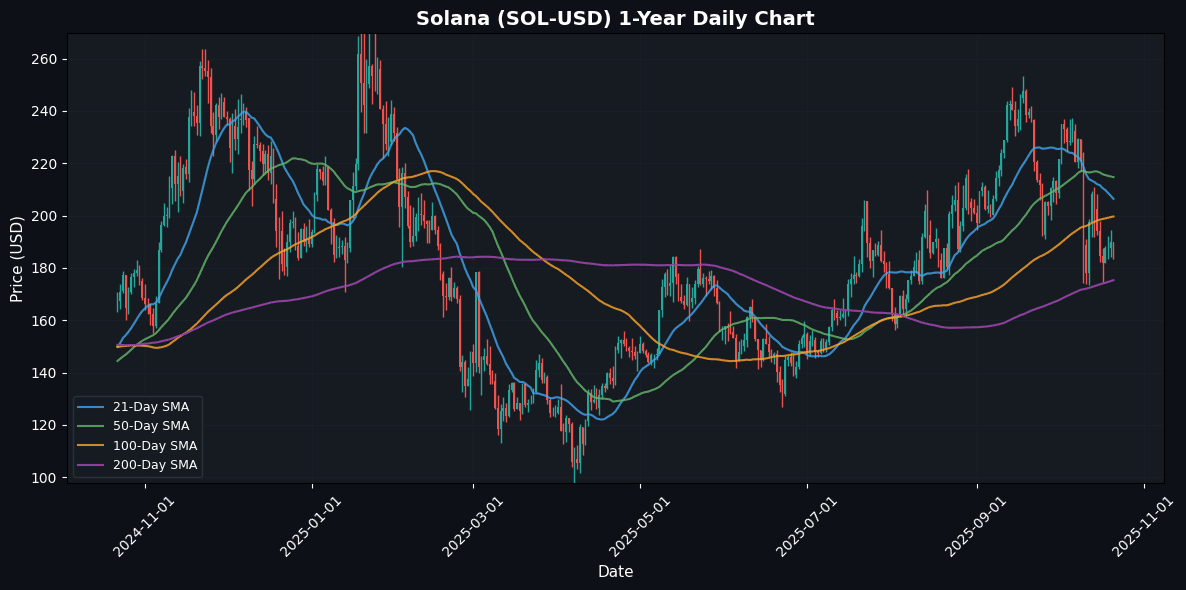
Solana (SOL) is currently trading at $184.45, reflecting a daily drop of 2.79%. The cryptocurrency is below its short-term moving averages, with the 21-day MA at $206.41 and the 50-day MA at $214.71, both suggesting downward pressure. The current price is also beneath the 100-day MA at $199.68, indicating a potential resistance level ahead.
Support is evident at the 200-day moving average of $175.32, which may serve as a critical floor if selling pressure continues. The RSI at 40.48 signals that SOL is approaching oversold territory, suggesting a potential rebound if buying interest increases. However, the MACD reading of -8.75 reflects bearish momentum, signaling caution for traders.
In summary, the price action suggests a bearish trend, requiring close monitoring of support levels and momentum indicators for potential reversal points. Traders should watch for a possible recovery above the $199.68 resistance to
🟤 Dogecoin (DOGE)
Price: $0.1937 (-3.21%)
The meme-coin that became mainstream; still ranks high by volume due to its active retail community.
📰 Market Drivers & News
Dogecoin continues to capture attention through its vibrant community initiatives, with the House of Doge project making waves by supporting an underdog Italian soccer team, highlighting growing real-world adoption in sports entertainment. This move underscores ecosystem expansion, as more partnerships emerge to integrate DOGE into fan engagement and experiential marketing. On the adoption front, merchant integrations and payment solutions are accelerating, fostering broader utility beyond speculation.
Network activity remains robust, with heightened transaction volumes reflecting active user participation and meme-driven enthusiasm. While no major regulatory shifts directly impact DOGE today, broader crypto policy discussions contribute to cautious optimism. In DeFi and NFT spaces, innovative projects are experimenting with DOGE as a base asset, sparking collaborations that enhance liquidity and creative applications.
Market sentiment tilts bullish amid rising trading dynamics, fueled by community hype and cross-chain developments. Near-term outlook suggests sustained momentum if adoption trends persist, though volatility from external crypto influences warrants vigilance.
📈 Technical Analysis
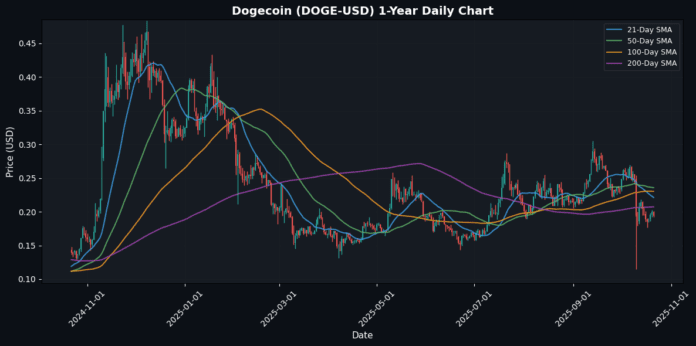
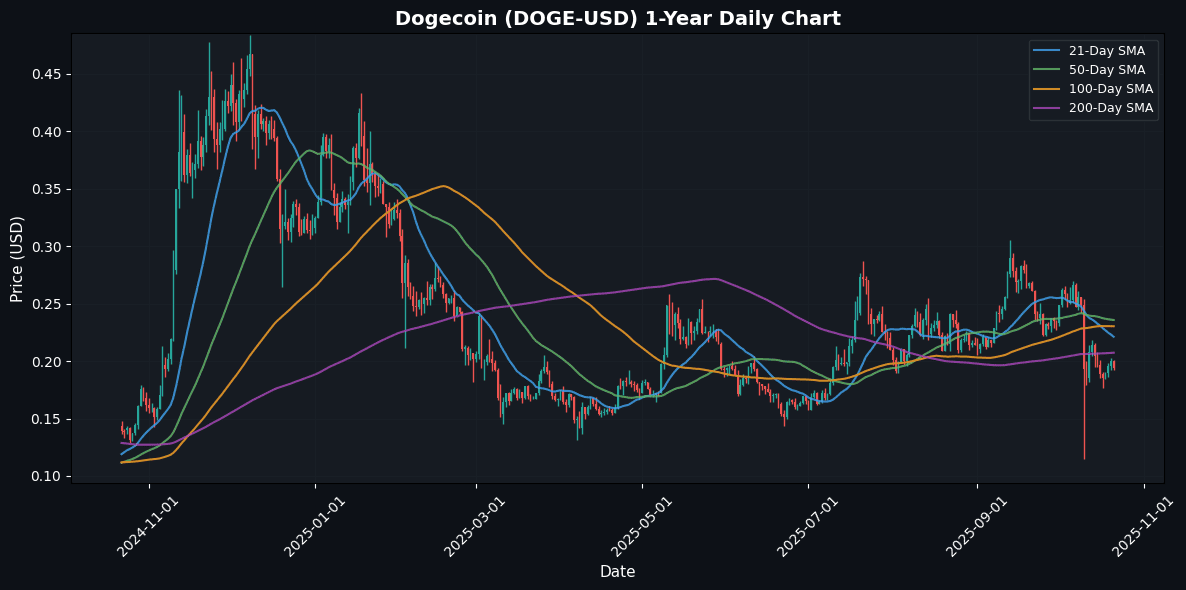
Dogecoin (DOGE) is currently trading at $0.19, reflecting a decline of 3.21% in the last 24 hours. The price is positioned below key moving averages (MAs), with the 21-day MA at $0.22, the 50-day MA at $0.24, the 100-day MA at $0.23, and the 200-day MA at $0.21. This indicates a bearish short to medium-term trend, confirming resistance around the $0.22 to $0.24 range.
The Relative Strength Index (RSI) at 40.35 is approaching the neutral level, suggesting there may be room for a rebound if buying pressure increases, while the MACD reading of -0.01 reinforces the current bearish momentum. Traders should watch for potential support around the $0.18 level, as a break below this could trigger further downside. Conversely, closing above the 21-day MA at $0.22
🔵 Cardano (ADA)
Price: $0.6418 (-3.23%)
Research-driven blockchain project focused on scalability, sustainability, and academic rigor.
📰 Market Drivers & News
Cardano’s ecosystem continues to demonstrate resilience amid broader market volatility, with institutional whales accumulating ADA despite recent downward pressures. Key drivers include accelerated network upgrades, such as enhancements to smart contract functionality and scalability, positioning the blockchain for expanded real-world applications. Adoption momentum is building through strategic partnerships in emerging markets, particularly in Africa, where blockchain solutions are addressing financial inclusion challenges. In DeFi and NFT sectors, innovative protocols are gaining traction, fostering liquidity pools and creator economies that bolster on-chain activity. Regulatory landscapes remain supportive, with global policies increasingly recognizing decentralized technologies without imposing undue restrictions. Market sentiment reflects cautious optimism, as trading dynamics show sustained volume and developer engagement countering short-term bearish trends. Looking ahead, Cardano’s robust fundamentals suggest potential for stabilization and upward momentum in the near term, driven by ecosystem maturation and institutional interest.
📈 Technical Analysis
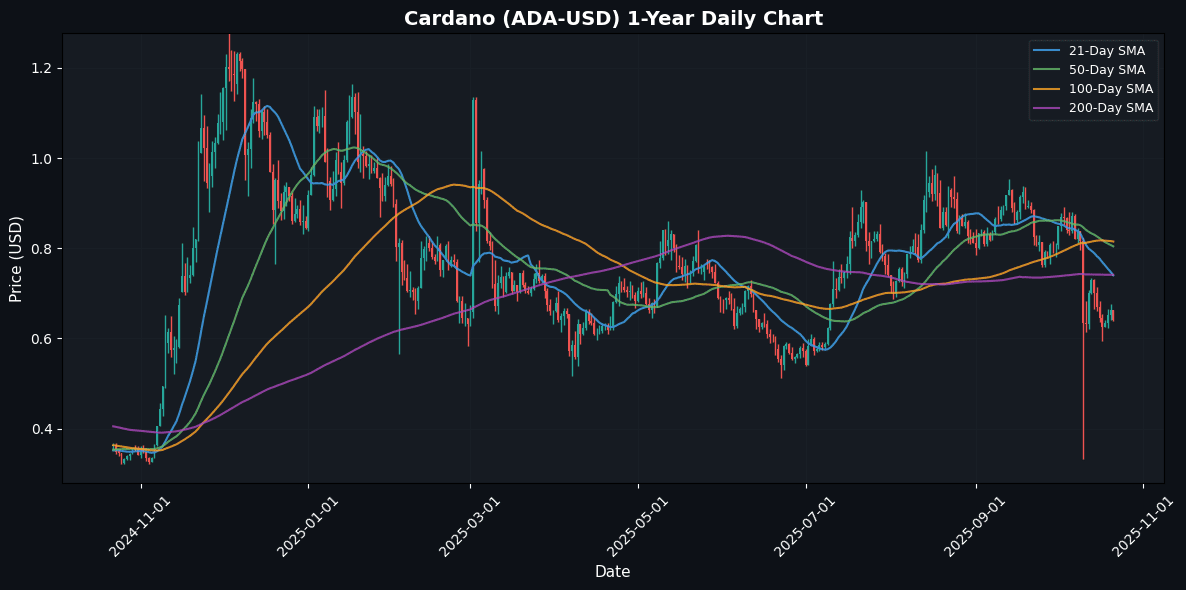
Cardano (ADA) is currently trading at $0.64, reflecting a daily decline of 3.23%. The price is below key moving averages, with the 21-day MA at $0.74, the 50-day at $0.80, and the more significant 100-day and 200-day MAs both at $0.81 and $0.74, respectively. This positions the cryptocurrency in a bearish trend as it struggles to reclaim these moving averages.
The RSI of 37.25 indicates that ADA is approaching oversold territory, suggesting potential for a price bounce if buying interest returns. However, the MACD at -0.05 demonstrates bearish momentum; a crossover above the signal line could signify a reversal.
Immediate support is likely around $0.60, while resistance remains at the 21-day MA of $0.74. Traders should monitor these levels closely, as a sustained break below $0.60 could lead to further downside, while a
🔴 TRON (TRX)
Price: $0.3208 (-0.59%)
Decentralized content-sharing and DeFi ecosystem with strong presence in Asia.
📰 Market Drivers & News
TRON’s ecosystem continues to demonstrate resilience amid broader cryptocurrency volatility, driven by strategic expansions in decentralized finance and content protocols. Recent adoption surges highlight growing partnerships with entertainment platforms, enhancing TRX’s utility for digital asset streaming and micropayments, which bolsters network activity and user engagement. On the regulatory front, positive policy shifts in Asia, including clearer guidelines for stablecoin integrations, are fostering TRON’s compliance efforts and attracting institutional interest.
Technologically, upgrades to the TRON Virtual Machine have improved scalability, enabling smoother DeFi transactions and NFT marketplace operations, with notable spikes in total value locked across lending protocols. Sentiment remains cautiously optimistic, as trading volumes reflect renewed investor confidence following ecosystem milestones, tempered by global energy policy concerns impacting mining-adjacent networks.
In the near term, TRON appears poised for steady growth, supported by ongoing interoperability initiatives and potential cross-chain collaborations, though macroeconomic pressures could introduce short-term fluctuations.
📈 Technical Analysis
TRON (TRX) is currently trading at $0.32, reflecting a daily decline of 0.59%. The price is positioned near key moving averages: the 21, 50, and 100-day MAs at $0.33 indicate short-term resistance, while the 200-day MA at $0.30 suggests a potential support level. The slight price dip from the moving averages raises caution about immediate upward momentum.
The Relative Strength Index (RSI) at 44.49 indicates that TRX is approaching neutral territory, suggesting a lack of strong momentum in either direction. Meanwhile, the MACD at -0.01 indicates a bearish momentum, as the signal line may act as resistance for potential upward movements.
Traders should closely monitor price action around the $0.33 resistance. A sustained breach above this level may indicate a bullish reversal, while a drop below $0.30 could signal further bearish momentum, potentially testing support levels. Overall, TRX presents
🔴 Avalanche (AVAX)
Price: $19.86 (-2.43%)
🆕 Fast-growing Layer-1 platform supporting customizable blockchains (“subnets”) and DeFi protocols.
📰 Market Drivers & News
Avalanche’s ecosystem demonstrated robust momentum today, propelled by a landmark partnership with a leading financial institution to integrate blockchain solutions for cross-border payments, accelerating real-world adoption. Ecosystem growth surged as multiple enterprises announced migrations to Avalanche’s subnets, enhancing scalability for enterprise applications and boosting developer activity.
Regulatory tailwinds emerged with favorable policy clarifications from key jurisdictions, easing compliance for institutional players and fostering broader integration. Technologically, the network rolled out an advanced consensus upgrade, optimizing throughput and reducing latency, which spurred heightened transaction volumes.
In DeFi and NFTs, innovative protocols launched yield-optimizing vaults and cross-chain bridges, drawing fresh liquidity and user engagement. Market sentiment remains bullish, with trading dynamics reflecting sustained institutional inflows and reduced volatility, underscoring confidence in Avalanche’s fundamentals.
Looking ahead, the near-term outlook appears promising, with potential for accelerated adoption driving ecosystem expansion amid supportive regulatory environments.
📈 Technical Analysis
Avalanche (AVAX) is currently trading at $19.86, reflecting a daily decline of 2.43%. The short-term bearish sentiment is corroborated by the Relative Strength Index (RSI) at 31.79, indicating that AVAX is nearing oversold conditions. Key moving averages reveal a bearish alignment, with the 21-day MA at $24.97 significantly above the 50-day MA at $27.48. This divergence suggests a strong downward trajectory.
Resistance is evident at the 21-day and 50-day MAs, posing obstacles for a price reversal. Conversely, the next support level can be found near the 200-day MA at $23.02, which, if breached, might attract further downside momentum.
The MACD reading of -2.46 further reinforces bearish momentum, signaling potential continuation of the downtrend. Overall, crypto traders should remain cautious, looking for potential reversal patterns or bullish divergences before considering entry positions, as the current technical
🔴 Polkadot (DOT)
Price: $2.98 (-3.45%)
🆕 Interoperability-focused network connecting multiple blockchains; key project in the Web 3.0 ecosystem.
📰 Market Drivers & News
Polkadot’s ecosystem showed robust momentum today, driven by a landmark partnership with a leading Web3 infrastructure provider that promises enhanced interoperability across blockchains. Adoption surged as several enterprises announced integrations, bolstering real-world utility and signaling broader ecosystem growth through new developer grants and community initiatives. Regulatory landscapes brightened with tentative approvals for tokenized assets on Polkadot networks in key jurisdictions, fostering confidence among institutional players. Technologically, the network activated a long-awaited upgrade for asynchronous backing, improving transaction speeds and parachain efficiency amid heightened relay chain activity. Market sentiment leaned bullish, with trading volumes reflecting renewed investor enthusiasm and dynamic cross-chain flows. In DeFi and NFTs, fresh protocols launched with innovative yield mechanisms and cross-parachain marketplaces, attracting liquidity and creative collaborations. Overall, these fundamentals point to a cautiously optimistic near-term outlook, with potential for sustained growth if regulatory tailwinds persist.
📈 Technical Analysis
Polkadot (DOT) is currently trading at $2.98, reflecting a daily decline of 3.45%. The price action indicates a bearish trend, as DOT consistently remains below key moving averages: MA21 at $3.56, MA50 at $3.87, MA100 at $3.92, and MA200 at $3.96. These moving averages act as significant resistance levels, with the proximity of MA21 suggesting immediate pressure.
The Relative Strength Index (RSI) stands at 36.05, indicating that DOT is approaching oversold conditions, which may attract buyers in the short term. However, the MACD at -0.29 suggests continued bearish momentum, with no clear signs of a crossover to signal a recovery.
Traders should monitor support levels around $2.85 for potential rebounds, while resistance is expected near the MA21. A decisive break below support could further accelerate downward trends. Conversely, a reclaim of the MA21 may signal the
Disclaimer
The content on MarketsFN.com is provided for educational and informational purposes only. It does not constitute financial advice, investment recommendations, or trading guidance. Cryptocurrency investments are highly volatile and risky. You are solely responsible for your investment decisions and should conduct independent research and consult a qualified financial advisor before acting. MarketsFN.com and its authors are not liable for any losses or damages arising from your use of this information.


