# Dave & Buster’s Entertainment Inc. (PLAY) Post Earning Analysis
Dave & Buster’s Entertainment, Inc., founded in 1982 by David O. Corriveau and James W. Corley, operates a chain of entertainment and dining complexes. Known for its unique blend of arcade games, live sports viewing, and a robust menu featuring both alcoholic and non-alcoholic beverages, the company is headquartered in Coppell, TX, and offers a vibrant venue for both adults and families.
Dave & Buster’s (NASDAQ: PLAY) has recently faced significant challenges as evidenced by its Q2 financial results, which missed both earnings and revenue estimates. The company’s stock has consequently seen a notable decline. Several reports highlight execution missteps and a 3% drop in same-store sales, signaling underlying operational issues. In response, Dave & Buster’s is attempting to refine its marketing strategies to better align with its core customer base and drive traffic.
The broader market context includes anticipation around the Federal Reserve’s rate decision, which could influence investor sentiment and market dynamics affecting stocks like Dave & Buster’s. The company’s recent performance and strategic shifts are critical as they attempt to navigate a challenging economic environment and recover from the recent downturn in their financial performance. This period is pivotal for Dave & Buster’s, as its ability to adapt and execute effectively could significantly influence its stock value and investor confidence moving forward.
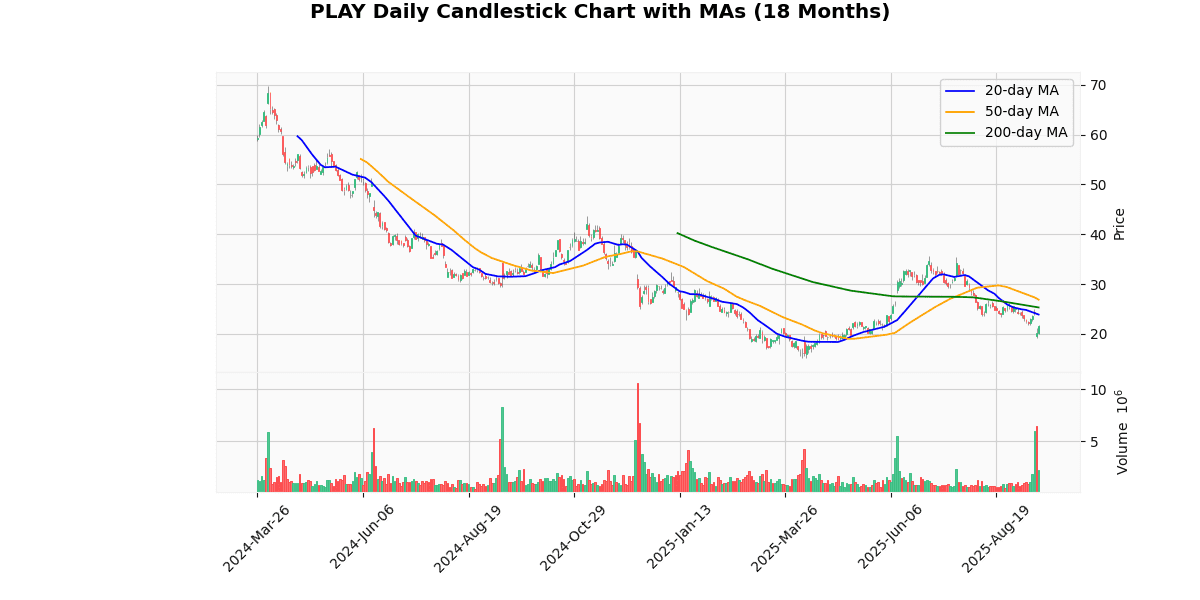
The current price of the asset is $21.63, showing a significant daily increase of 7.16%. Despite today’s positive movement, the asset’s price trends over longer periods reveal a less optimistic picture. It is currently trading 50.54% below its 52-week high of $43.73 and 39.12% below the year-to-date high of $35.53, indicating a substantial decline over the past year. However, it has recovered 43.44% from its 52-week and year-to-date low of $15.08, suggesting some resilience.
The asset’s moving averages further underscore its bearish trend, with current prices below the 20-day, 50-day, and 200-day moving averages by 9.42%, 19.48%, and 14.51%, respectively. This alignment suggests a sustained downward momentum.
Technical indicators like the Relative Strength Index (RSI) at 39.14 and a negative MACD value of -1.26 both support a bearish outlook, indicating that the asset might still be under selling pressure despite today’s gains. The recent price recovery needs to be viewed with caution as broader metrics hint at potential volatility and continued bearish trends.
## Price Chart

## Earnings Trend Table
| Date | Estimate EPS | Reported EPS | Surprise % | |
|---|---|---|---|---|
| 0 | 2025-09-15 | 0.88 | 0.40 | -54.55 |
| 1 | 2025-06-10 | 0.99 | 0.62 | -37.06 |
| 2 | 2025-04-07 | 0.71 | 0.24 | -66.08 |
| 3 | 2024-12-10 | -0.37 | -0.55 | -50.17 |
| 4 | 2024-09-10 | 0.84 | 0.99 | 17.68 |
| 5 | 2024-06-12 | 1.70 | 0.99 | -41.68 |
| 6 | 2024-04-02 | 1.10 | 0.88 | -20.27 |
| 7 | 2023-12-05 | -0.13 | -0.12 | 7.69 |
## Dividend Payments Table
| Date | Dividend |
|---|---|
| 2020-01-09 | 0.16 |
| 2019-10-10 | 0.16 |
| 2019-06-24 | 0.15 |
| 2019-03-25 | 0.15 |
| 2018-12-24 | 0.15 |
| 2018-09-24 | 0.15 |


