The DAX40, formerly known as the DAX30, is a prominent stock market index that represents 40 of the largest and most liquid German companies listed on the Frankfurt Stock Exchange. It includes a diverse range of sectors, providing a comprehensive overview of Germany’s corporate health and economic status. As a major indicator of market trends in Germany, the DAX40 is closely watched by investors worldwide.
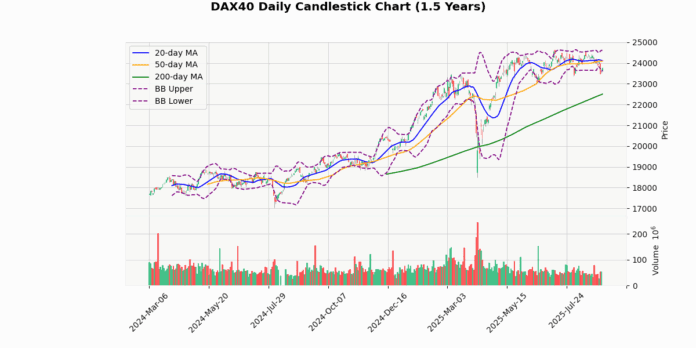
The DAX40 index is currently priced at 23,765.79, marking a modest increase of 0.72% today. Analyzing its position relative to various moving averages, the index is trading below both the 20-day (24,108.11) and 50-day (24,089.78) moving averages, suggesting a short-term bearish trend. However, it remains well above the 200-day moving average of 22,501.84, indicating a longer-term bullish outlook.
The Bollinger Bands show the index near the lower band (23,603.48), which often signals a potential rebound if other indicators align. The current price is 0.69% above the lower band, suggesting limited downside risk in the immediate term.
The Relative Strength Index (RSI) at 43.41 indicates that the index is neither overbought nor oversold, providing no strong directional bias from this metric alone. However, the Moving Average Convergence Divergence (MACD) at -92.2 with a signal line at -18.29 shows a bearish momentum, as evidenced by the MACD being significantly below its signal line.
The index’s 3-day range between 23,482.67 and 23,990.81, along with a current price closer to this range’s lower bound, suggests some recent selling pressure. The Average True Range (ATR) of 244.69 points to moderate daily volatility.
Year-to-date and 52-week metrics indicate that the index has retreated from its highs (24,639.1), currently down by approximately 3.54%, yet it remains substantially above the lows seen over these periods, highlighting a generally positive longer-term performance.
In summary, while short-term indicators suggest some bearishness with potential for further downside, the index’s strong performance above its 200-day moving average and significant gains from yearly lows provide a buffer. Investors might watch for potential MACD crossovers or a move towards the middle Bollinger Band for signs of strengthening momentum or reversal.
## Technical Metrics
| Metric | Value |
|---|---|
| Current Price | 23765.8 |
| Today’s Change (%) | 0.72 |
| 20-day MA | 24108.1 |
| % from 20-day MA | -1.42 |
| 50-day MA | 24089.8 |
| % from 50-day MA | -1.34 |
| 200-day MA | 22501.8 |
| % from 200-day MA | 5.62 |
| Bollinger Upper | 24612.7 |
| % from BB Upper | -3.44 |
| Bollinger Lower | 23603.5 |
| % from BB Lower | 0.69 |
| RSI (14) | 43.41 |
| MACD | -92.2 |
| MACD Signal | -18.29 |
| 3-day High | 23990.8 |
| % from 3-day High | -0.94 |
| 3-day Low | 23482.7 |
| % from 3-day Low | 1.21 |
| 52-week High | 24639.1 |
| % from 52-week High | -3.54 |
| 52-week Low | 18208.8 |
| % from 52-week Low | 30.52 |
| YTD High | 24639.1 |
| % from YTD High | -3.54 |
| YTD Low | 18489.9 |
| % from YTD Low | 28.53 |
| ATR (14) | 244.69 |
The DAX40 index currently exhibits a mixed technical outlook, with the current price of 23,765.79 positioned below both the 20-day and 50-day moving averages, indicating a short-term bearish trend. However, it remains well above the 200-day moving average, suggesting underlying long-term bullish sentiment. The index is trading near the lower Bollinger Band, which could signal a potential rebound if it holds as a support level.
The Relative Strength Index (RSI) at 43.41 points to a slightly bearish momentum without entering the oversold territory. The MACD is below its signal line and negative, which supports the bearish momentum in the short term. However, the proximity of the current price to the lower Bollinger Band and the significant distance from the 52-week and YTD highs indicate there might be limited downside potential.
Volatility, as measured by the ATR (244.69), remains relatively high, suggesting that significant price movements could still occur. Key support and resistance levels to watch are the recent 3-day low at 23,482.67 and the 3-day high at 23,990.81, respectively. The market sentiment appears cautious, with potential for either direction depending on upcoming market catalysts and economic data.


