Energy Futures Rebounds
⚡ Market Overview
Energy markets on October 21, 2025 reflect dynamic trading across crude oil, Brent, and natural gas December 2025 futures contracts. The analysis below covers market drivers, technical indicators, and trading outlook for each energy commodity.
📋 Contract Specifications
December 2025 Futures Contracts:
• CLZ25: NYMEX WTI Crude Oil (CL = Crude Light, Z = December, 25 = 2025)
• BZZ25: ICE Brent Crude (BZ = Brent, Z = December, 25 = 2025)
• NGZ25: NYMEX Natural Gas (NG = Natural Gas, Z = December, 25 = 2025)
Performance Summary
| Commodity | Contract | Price | Unit | Daily % | MA21 | MA50 | MA100 | MA200 | RSI | MACD |
|---|---|---|---|---|---|---|---|---|---|---|
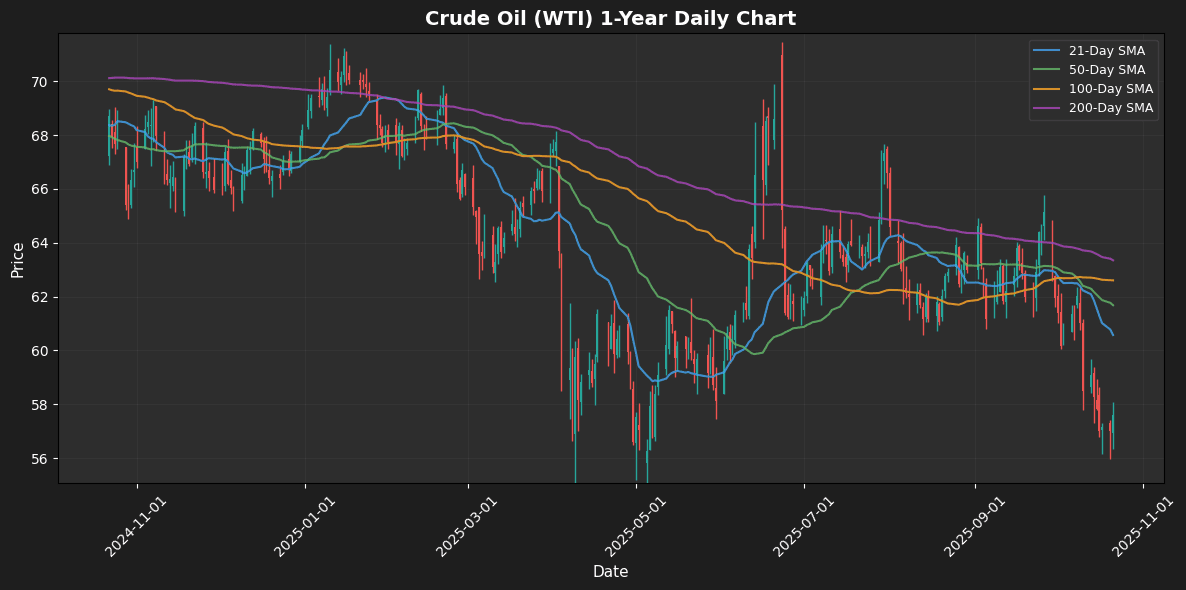
| Crude Oil (WTI) | CLZ25 | $57.59 | $/barrel | +1.00% | $60.57 | $61.68 | $62.60 | $63.35 | 36.27 | -1.44 |
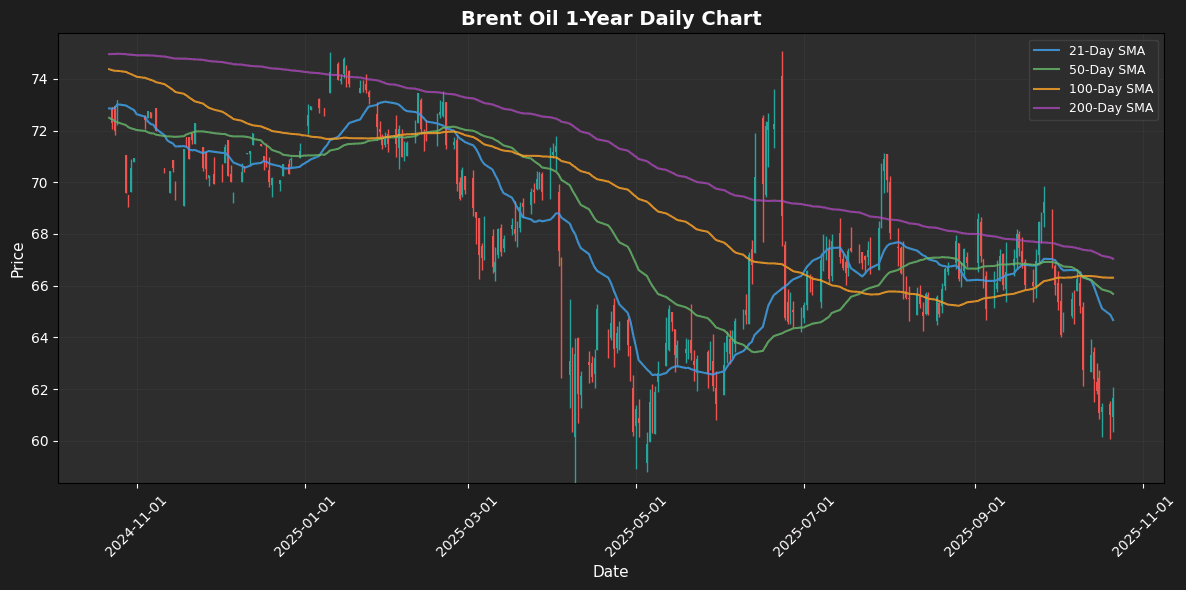
| Brent Oil | BZZ25 | $61.65 | $/barrel | +1.05% | $64.67 | $65.68 | $66.31 | $67.04 | 36.95 | -1.42 |
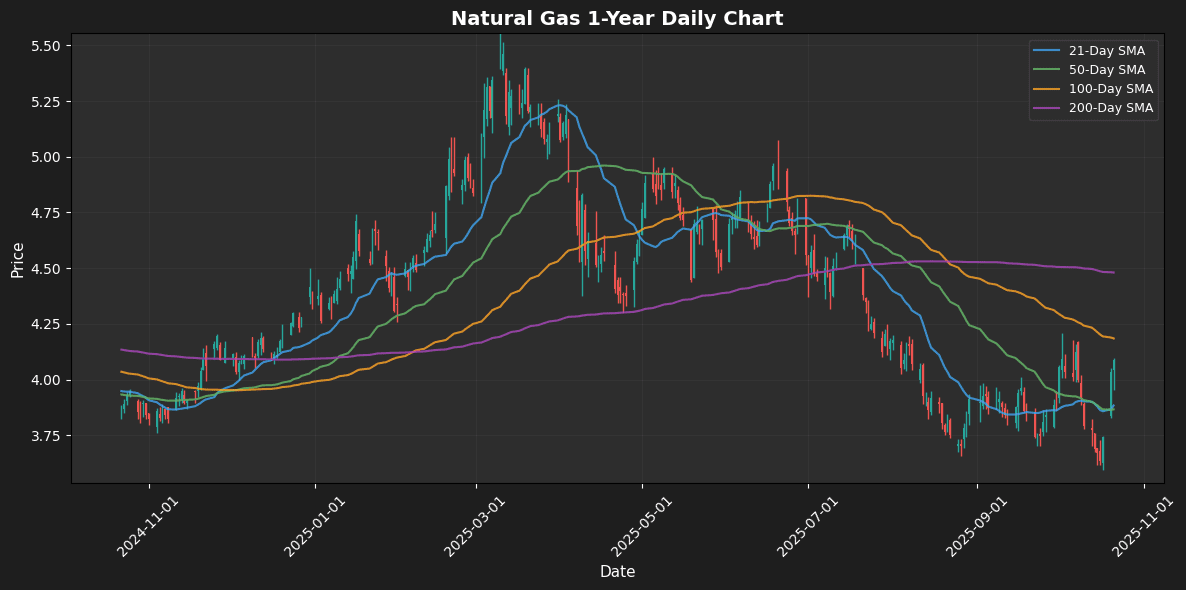
| Natural Gas | NGZ25 | $4.09 | $/MMBtu | +1.26% | $3.88 | $3.87 | $4.18 | $4.48 | 60.15 | -0.01 |
⚫ Crude Oil (WTI)
Contract: CLZ25 | Price: $57.59 $/barrel (+1.00%)

📰 Market Drivers & News
China’s robust crude oil demand continued to dominate market narratives, with refineries processing record volumes in September, outpacing imports and domestic output to create a notable surplus. This surge underscores strengthening economic activity and stockpiling amid seasonal upticks, bolstering global supply-demand balances. On the supply front, major producers maintained disciplined output cuts, while capacity expansions in non-OPEC nations added measured pressure, keeping inventories on a downward trajectory in key regions like the US and Europe.
Traders leaned bullish, with positioning reflecting bets on sustained demand growth, though caution persists over potential economic slowdowns. Near-term outlook points to a resilient market, with upside potential from accelerating global activity, tempered by watchful eyes on producer discipline.
📈 Technical Analysis
As of the current price of $57.59, Crude Oil (WTI) is demonstrating a bearish trend, showing a daily change of 1.00%. The price is trading below key moving averages: MA21 at $60.57, MA50 at $61.68, MA100 at $62.60, and MA200 at $63.35, indicating a sustained downtrend and potential resistance levels.
The Relative Strength Index (RSI) at 36.27 suggests that WTI is approaching oversold conditions, hinting at possible near-term bullish reversals. However, with the MACD at -1.44, momentum remains negative, reinforcing selling pressures.
Traders should monitor the support level around $55.00; a breach could lead to further declines. Conversely, a rally above $60.57 would be necessary to signal a shift in momentum. Short-term strategies may consider cautious entries, while long-term outlooks should remain bearish unless a clear reversal
🟤 Brent Oil
Contract: BZZ25 | Price: $61.65 $/barrel (+1.05%)

📰 Market Drivers & News
Brent crude oil has shown resilience amid a blend of supply constraints and robust demand signals, rebounding from recent pressures. Key market movers include production cuts by Kazakhstan, aligning with broader OPEC+ efforts to stabilize output amid voluntary reductions from several members. This has tightened global supply dynamics, particularly as Asian economies, led by China’s industrial rebound, drive sustained demand for energy imports.
Inventory trends reflect this balance, with draws in key stockpiles underscoring underlying tightness, though refinery maintenance in Europe tempers immediate uptake. Geopolitically, escalating tensions in the Middle East and potential U.S. policy shifts on exports add layers of uncertainty, influencing producer hedging strategies. Production decisions remain pivotal, with capacity adjustments in non-OPEC nations like the U.S. shale sector responding to these cues.
Market sentiment leans bullish, as traders increase long positions, betting on persistent fundamentals. Near-term outlook suggests steady support, though volatility looms from any policy surprises or demand slowdowns.
📈 Technical Analysis
Brent Oil is currently trading at $61.65, reflecting a daily increase of 1.05%. However, the price remains significantly below key moving averages, with MA21 at $64.67, MA50 at $65.68, MA100 at $66.31, and MA200 at $67.04. This positioning indicates a bearish trend as prices are diverging from the upward-moving averages, suggesting potential resistance around these levels.
The RSI at 36.95 signals that Brent is nearing oversold territory, which could prompt a corrective bounce; however, it is still under the 40 threshold, indicating ongoing bearish momentum. The MACD reading of -1.42 further reinforces this sentiment, indicating that downward momentum is present.
Traders should watch for a break below support at $60.00, which could trigger further declines. Conversely, a move above $64 could signify strength and a potential reversal. Overall, caution is advised, with close attention to momentum indicators for
🔵 Natural Gas
Contract: NGZ25 | Price: $4.09 $/MMBtu (+1.26%)

📰 Market Drivers & News
In the natural gas market, bullish fundamentals are gaining traction amid a mix of production dips and variable weather patterns, driving modest upward momentum in futures trading. Key developments include scheduled maintenance at major LNG export facilities, which could tighten near-term supply, while robust demand from power generation sectors counters seasonal cooling forecasts. Inventory levels remain elevated following a mild winter drawdown, yet ongoing exports to Europe—bolstered by geopolitical tensions in the region—continue to strain domestic balances. Production decisions by key operators show restraint, with some shale plays scaling back amid infrastructure constraints, potentially limiting output growth. Policy shifts toward energy security in Asia are also spurring long-term LNG commitments, adding to supply pressures. Trader sentiment leans cautiously optimistic, with positioning reflecting bets on sustained demand amid global decarbonization uncertainties. Near-term, expect volatility as weather evolves and export flows stabilize, with fundamentals supporting a resilient tone.
📈 Technical Analysis
Natural Gas is currently trading at $4.09, reflecting a daily increase of 1.26%. The price has shown bullish momentum, as indicated by the Relative Strength Index (RSI) at 60.15, suggesting that the asset is nearing overbought territory but still retains potential for further upward movement.
Examining the moving averages, the 21-day MA at $3.88 and the 50-day MA at $3.87 illustrate strong support levels. Meanwhile, the price is currently above both these short-term moving averages, which is a positive signal. However, the 100-day MA at $4.18 and the 200-day MA at $4.48 present resistance levels that traders should monitor closely.
The MACD, at -0.01, indicates a potential divergence situation, suggesting caution. Overall, bullish trend continuation appears likely as long as Natural Gas holds above the MA21 and MA50, while a break above the 100-day MA could
Disclaimer
The content on MarketsFN.com is provided for educational and informational purposes only. It does not constitute financial advice, investment recommendations, or trading guidance. All investments involve risks, and past performance does not guarantee future results. You are solely responsible for your investment decisions and should conduct independent research and consult a qualified financial advisor before acting. MarketsFN.com and its authors are not liable for any losses or damages arising from your use of this information.


