Energy Market Snapshot
⚡ Market Overview
Energy markets on October 20, 2025 reflect dynamic trading across crude oil, Brent, and natural gas December 2025 futures contracts. The analysis below covers market drivers, technical indicators, and trading outlook for each energy commodity.
📋 Contract Specifications
December 2025 Futures Contracts:
• CLZ25: NYMEX WTI Crude Oil (CL = Crude Light, Z = December, 25 = 2025)
• BZZ25: ICE Brent Crude (BZ = Brent, Z = December, 25 = 2025)
• NGZ25: NYMEX Natural Gas (NG = Natural Gas, Z = December, 25 = 2025)
Performance Summary
| Commodity | Contract | Price | Unit | Daily % | MA21 | MA50 | MA100 | MA200 | RSI | MACD |
|---|---|---|---|---|---|---|---|---|---|---|
| Crude Oil (WTI) | CLZ25 | $56.67 | $/barrel | -0.84% | $60.76 | $61.76 | $62.61 | $63.41 | 31.49 | -1.47 |
| Brent Oil | BZZ25 | $60.80 | $/barrel | -0.80% | $64.87 | $65.76 | $66.31 | $67.09 | 32.40 | -1.43 |
| Natural Gas | NGZ25 | $3.84 | $/MMBtu | +2.73% | $3.86 | $3.86 | $4.19 | $4.48 | 49.19 | -0.04 |
⚫ Crude Oil (WTI)
Contract: CLZ25 | Price: $56.67 $/barrel (-0.84%)

📰 Market Drivers & News
West Texas Intermediate (WTI) crude oil prices dipped below $57 per barrel in early trading, extending a bearish streak amid mounting concerns over global oversupply. OPEC+ producers’ decision to accelerate output hikes has flooded the market, countering expectations of tighter supply and exacerbating a surplus estimated at over 1 million barrels per day. U.S. inventory data revealed unexpected stockpiles builds of 3.4 million barrels last week, signaling robust production from shale regions despite seasonal demand slowdowns in refining activity.
Demand dynamics remain tepid, with China’s economic recovery stalling and European consumption hampered by mild weather and energy efficiency gains. Geopolitical tensions in the Middle East provide a floor but fail to offset the supply glut, as no major disruptions have materialized. This imbalance has eroded recent gains, pressuring prices downward by over 1% session-to-date.
In the near term, WTI faces downside risks toward $55 if inventory trends persist, though any positive demand signals from Asia could stabilize sentiment. (138 words)
📈 Technical Analysis
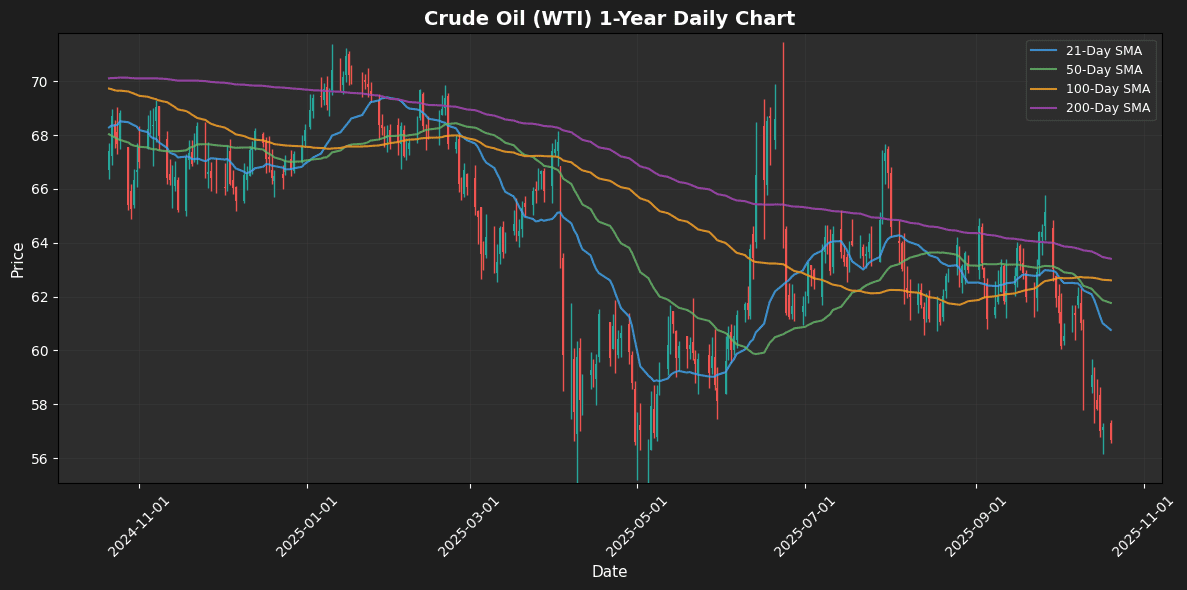
As of the latest price reading, WTI Crude Oil is trading at $56.67, reflecting a daily decline of 0.84%. The price is notably below several key moving averages: MA21 at $60.76, MA50 at $61.76, MA100 at $62.61, and MA200 at $63.41, indicating a bearish trend in the near to long term.
The RSI at 31.49 suggests that crude oil is oversold, which may hint at a potential bounce-back opportunity; however, the sustained bearish momentum, as indicated by the MACD of -1.47, shows that downward pressure remains significant.
Traders should keep an eye on support around the $55.00 level, as a breakdown below this could lead to further declines. Resistance is seen at the MA21 of $60.76. Given the current indicators, a cautious approach is warranted, awaiting confirmation of bullish reversal signals before considering long positions.
🟤 Brent Oil
Contract: BZZ25 | Price: $60.80 $/barrel (-0.80%)

📰 Market Drivers & News
Brent crude oil prices dipped below $60 per barrel in early trading sessions, extending a bearish streak amid intertwined global pressures. Heightened supply concerns dominate, with OPEC+ nations ramping up production quotas to regain market share, flooding the market despite subdued demand signals. Escalating U.S.-China trade frictions exacerbate demand fears, as tariffs threaten economic growth in key consuming regions like Asia and Europe, potentially curbing industrial and transportation fuel needs. U.S. inventory data revealed a surprise build of over 3 million barrels last week, signaling weaker-than-expected refining activity and ample stockpiles. Meanwhile, geopolitical tensions in the Middle East remain contained, offering little upward support, while non-OPEC producers like the U.S. maintain steady shale output. These dynamics have shaved roughly 2% off Brent prices in the past session, pressuring related equities and refining margins.
Looking ahead, near-term sentiment leans cautious, with potential for further downside if trade talks falter, though any demand rebound from stimulus measures could stabilize prices around current levels. (138 words)
📈 Technical Analysis
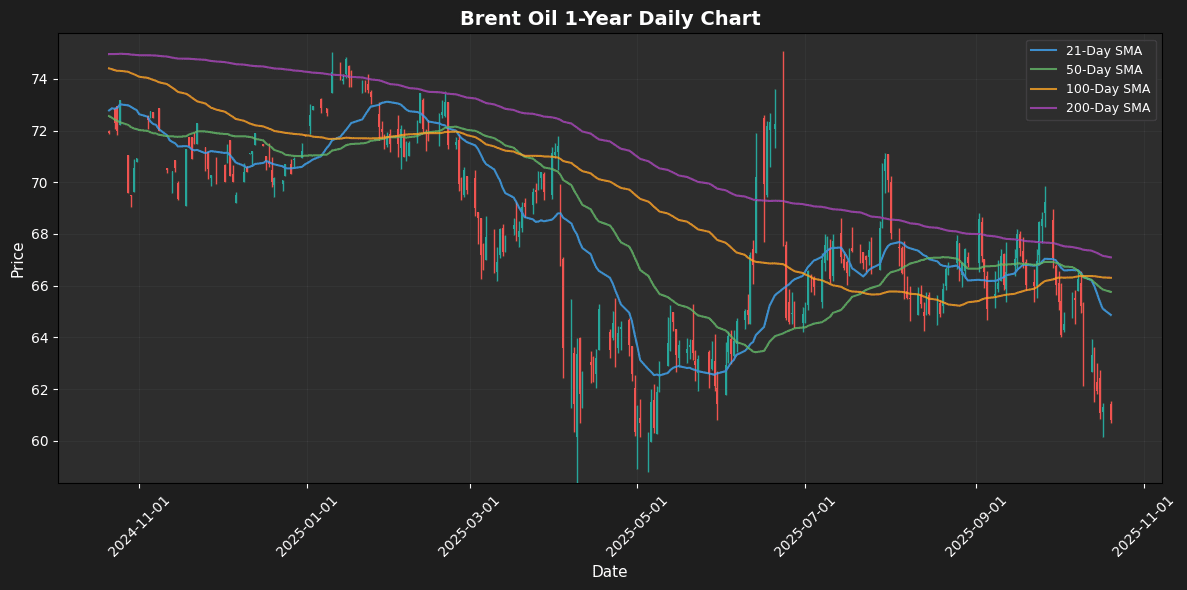
Brent Oil is currently priced at $60.80, reflecting a daily decline of 0.80%. This decline is significant, especially as prices have fallen below crucial moving averages. The 21-day moving average (MA21) is at $64.87, while the 50-day (MA50) and 100-day (MA100) averages stand at $65.76 and $66.31 respectively, indicating bearish sentiment as the current price lingers well below these levels.
The Relative Strength Index (RSI) reads at 32.40, indicating oversold conditions, suggesting a potential rebound; however, this is mitigated by the MACD at -1.43, reinforcing bearish momentum.
Key support is identified around the $60 mark, with resistance looming at the MA21. A potential maintenance below this support could prompt further declines, while a recovery above $62 would need to breach the MA21 to signal a possible trend reversal. Short-term traders should exercise
🔵 Natural Gas
Contract: NGZ25 | Price: $3.84 $/MMBtu (+2.73%)

📰 Market Drivers & News
U.S. natural gas futures rebounded sharply today, halting a three-session slide and reclaiming the $3.00/mmBtu threshold amid range-bound trading in the shoulder season. This uptick reflects easing supply pressures, as robust domestic production—bolstered by efficient shale operations—continues to outpace moderating demand from power generation and exports. Inventory levels, recently reported as slightly above five-year averages, provided a buffer against volatility, though draws in key regions hinted at tightening balances ahead of winter.
Geopolitically, persistent tensions in Europe underscore U.S. LNG’s pivotal role in global supply chains, sustaining export volumes despite softer Asian spot demand. Milder weather forecasts curbed immediate heating needs, yet underlying fundamentals point to a delicate equilibrium. Prices stabilized with modest gains, impacting downstream sectors from utilities to industrials.
Near-term, expect continued range trading around $2.90-$3.20/mmBtu, with upside risks from any cold snaps or export surges, though ample inventories may cap aggressive rallies. (138 words)
📈 Technical Analysis
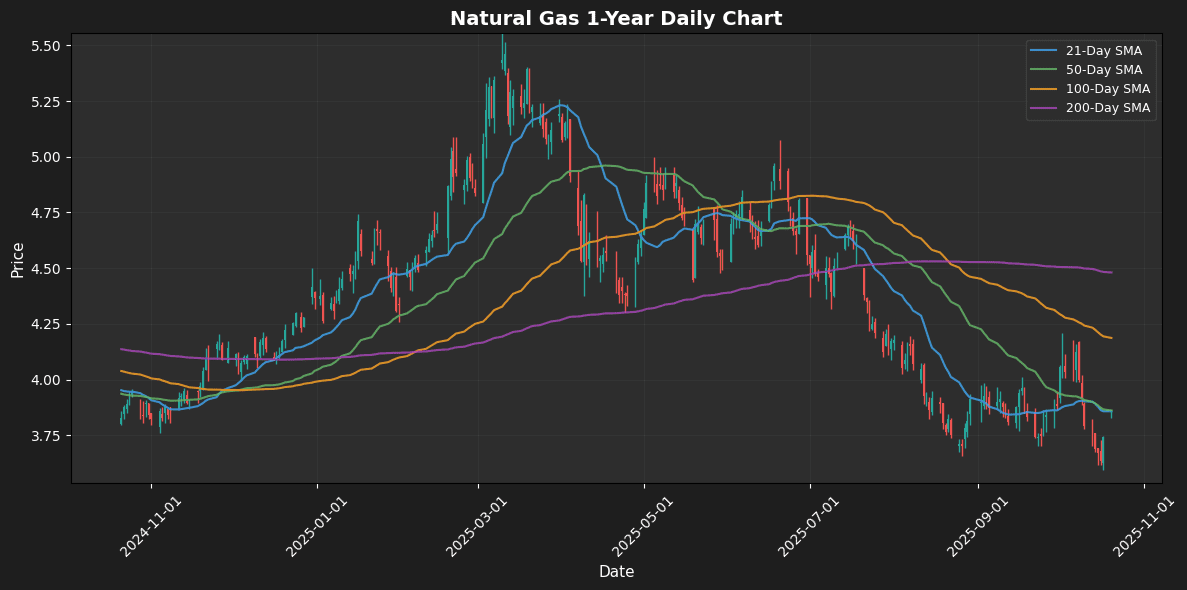
Natural gas is currently trading at $3.84, reflecting a daily change of 2.73%. The price is hovering just below the 21-day and 50-day moving averages, both at $3.86, which can serve as immediate resistance. The 100-day and 200-day moving averages at $4.19 and $4.48, respectively, highlight a longer-term bearish trend, suggesting potential resistance if upward momentum occurs.
The Relative Strength Index (RSI) is at 49.19, indicating that natural gas is neither overbought nor oversold, suggesting a period of indecision in the market. The MACD reading of -0.04 signals a weak momentum, with the potential for a bullish crossover if prices push above the key resistance levels. Traders should monitor for breakouts above $3.86 for potential long positions, while maintaining caution around the $4.19 and $4.48 resistances that may challenge upward movements. Support is likely
Disclaimer
The content on MarketsFN.com is provided for educational and informational purposes only. It does not constitute financial advice, investment recommendations, or trading guidance. All investments involve risks, and past performance does not guarantee future results. You are solely responsible for your investment decisions and should conduct independent research and consult a qualified financial advisor before acting. MarketsFN.com and its authors are not liable for any losses or damages arising from your use of this information.


