Energy Market Snapshot: Natural Gas Declines 1.39%
⚡ Market Overview
Energy markets on October 24, 2025 reflect dynamic trading across crude oil, Brent, and natural gas December 2025 futures contracts. The analysis below covers market drivers, technical indicators, and trading outlook for each energy commodity.
📋 Contract Specifications
December 2025 Futures Contracts:
• CLZ25: NYMEX WTI Crude Oil (CL = Crude Light, Z = December, 25 = 2025)
• BZZ25: ICE Brent Crude (BZ = Brent, Z = December, 25 = 2025)
• NGZ25: NYMEX Natural Gas (NG = Natural Gas, Z = December, 25 = 2025)
Performance Summary
| Commodity | Contract | Price | Unit | Daily % | MA21 | MA50 | MA100 | MA200 | RSI | MACD |
|---|---|---|---|---|---|---|---|---|---|---|
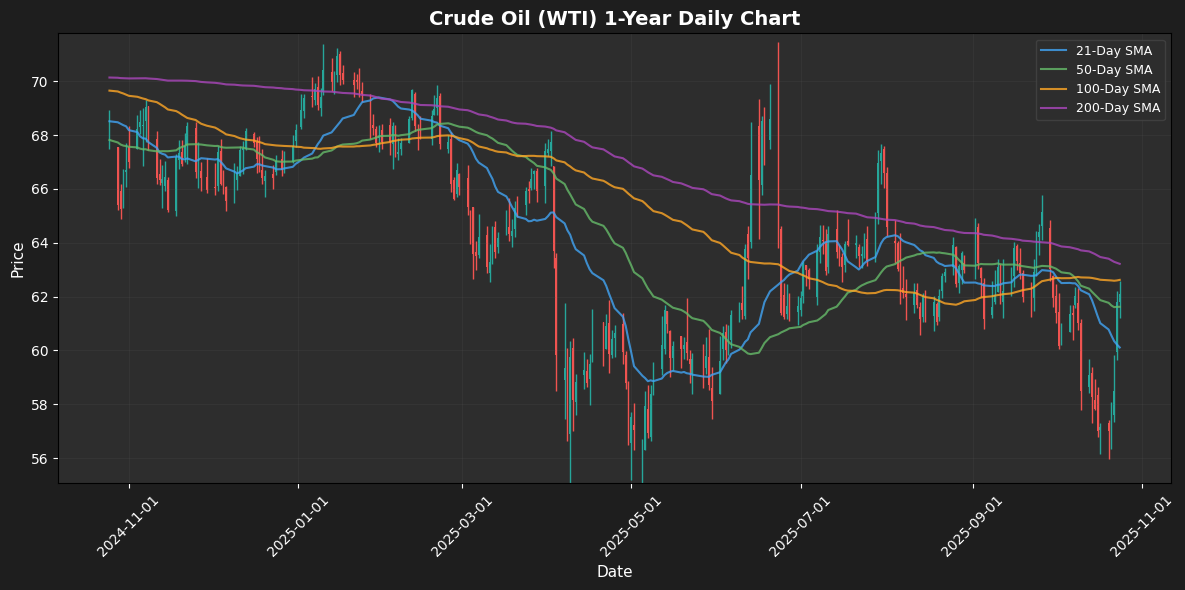
| Crude Oil (WTI) | CLZ25 | $62.08 | $/barrel | +0.47% | $60.11 | $61.62 | $62.62 | $63.22 | 57.58 | -0.71 |
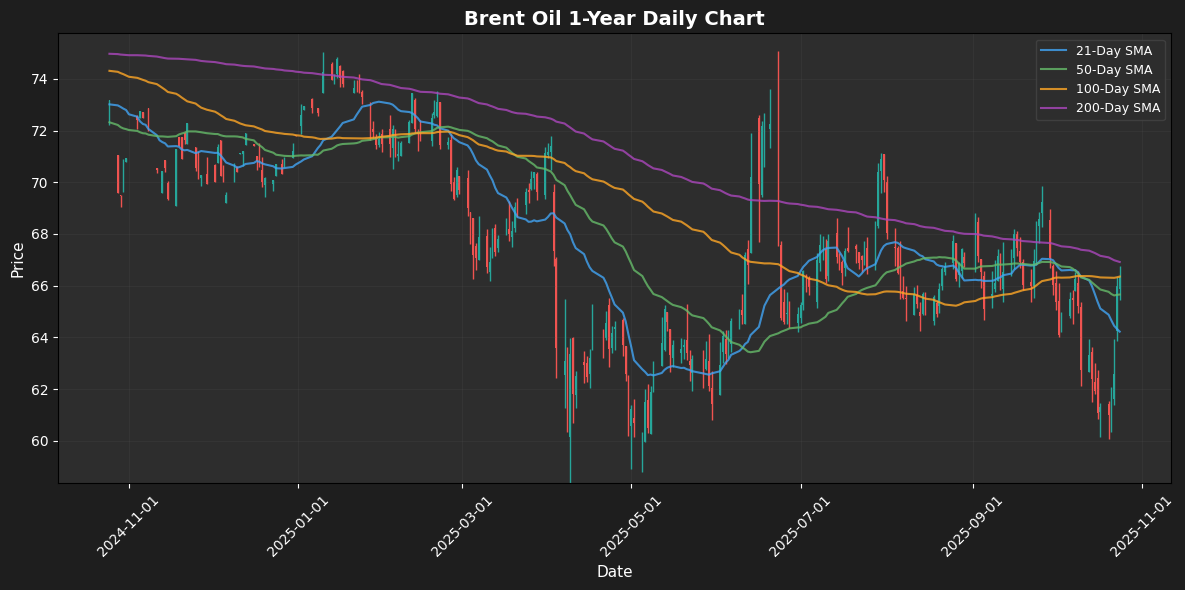
| Brent Oil | BZZ25 | $66.32 | $/barrel | +0.50% | $64.22 | $65.66 | $66.35 | $66.92 | 57.82 | -0.67 |
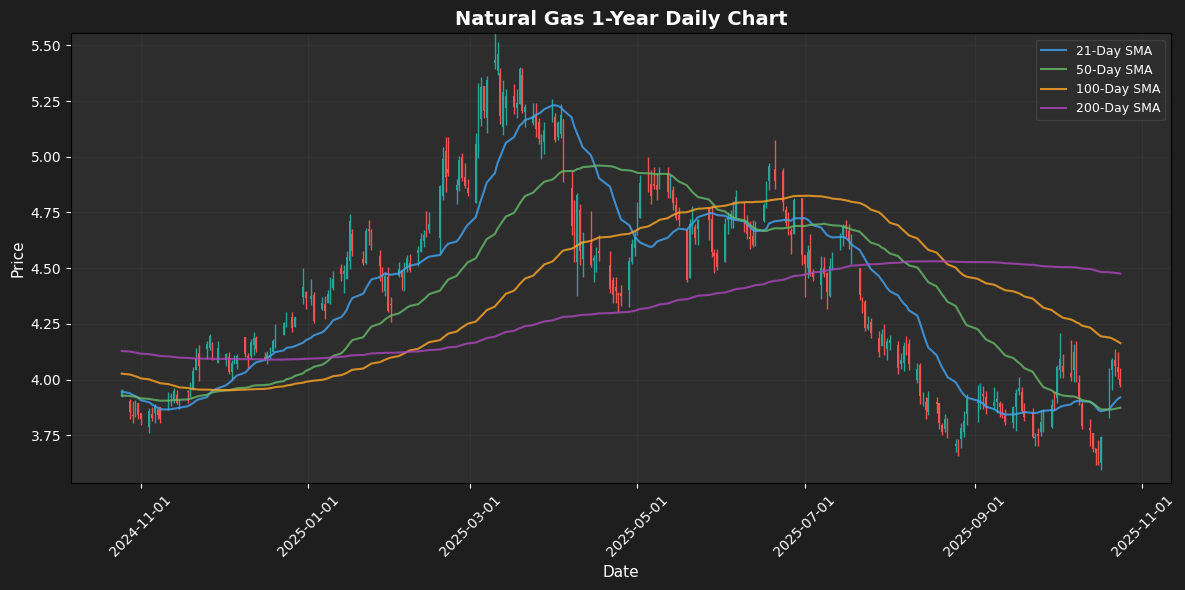
| Natural Gas | NGZ25 | $3.98 | $/MMBtu | -1.39% | $3.92 | $3.87 | $4.16 | $4.48 | 53.56 | 0.02 |
⚫ Crude Oil (WTI)
Contract: CLZ25 | Price: $62.08 $/barrel (+0.47%)

📰 Market Drivers & News
In the volatile world of crude oil markets, today’s spotlight falls on an unexpected drawdown in U.S. inventories, signaling stronger-than-anticipated refinery demand as processors ramp up operations to meet seasonal needs. This contrasts with broader supply dynamics, where OPEC+ producers maintain disciplined output cuts to balance global oversupply risks, while non-OPEC nations like the U.S. navigate higher drilling efficiencies amid fluctuating rig counts.
Geopolitical tensions in key producing regions add layers of uncertainty, with disruptions in shipping lanes potentially tightening export flows, though no major policy shifts have emerged from international forums. On the demand front, resilient economic indicators from major consumers underscore steady fuel consumption, countering fears of a slowdown.
Traders, sensing a bullish tilt from these fundamentals, have leaned into long positions, reflecting optimism over sustained tightness. Looking ahead, the near-term outlook remains constructive, with potential for further upside if inventory trends persist and geopolitical risks escalate, though watchful eyes on economic data could temper gains.
📈 Technical Analysis
As of the current price of $62.08, Crude Oil (WTI) is showing a daily change of 0.47%, indicating a slight upward momentum. The price is currently positioned between the moving averages; with the 21-day MA at $60.11 below it, suggesting short-term bullish sentiment, while the 50-day MA at $61.62 is nearby, potentially serving as a support level.
The 100-day MA at $62.62 and the 200-day MA at $63.22 represent key resistance zones. A sustained move above the 100-day MA could trigger further bullish momentum toward the 200-day MA.
The RSI at 57.58 indicates that the market is neither overbought nor oversold, suggesting that there is still room for upward movement. However, the MACD at -0.71 highlights a bearish crossover, hinting at possible weakening momentum. Traders should monitor these moving averages closely for potential crossovers and the RSI
🟤 Brent Oil
Contract: BZZ25 | Price: $66.32 $/barrel (+0.50%)

📰 Market Drivers & News
In the volatile Brent oil market, escalating U.S. sanctions on Russian energy exports have heightened supply concerns, amplifying geopolitical tensions amid ongoing conflicts in Ukraine and the Middle East. OPEC+ producers are navigating delicate production adjustments, with some members signaling potential output restraint to counter weakening demand signals from major economies facing slowdowns. Inventory trends reveal mixed dynamics: global stockpiles appear to be stabilizing, but regional draws in key hubs underscore persistent supply tightness. Demand remains fragile, buoyed by gradual recovery in industrial activity yet pressured by economic uncertainty and shifting consumer patterns. Trader sentiment leans cautious, with positioning reflecting bets on short-term disruptions rather than sustained rallies, as hedge funds trim long exposures amid technical volatility. Overall, the near-term outlook points to choppy trading, with upside risks from policy escalations offsetting demand headwinds for a balanced, watchful market.
📈 Technical Analysis
Brent Oil is currently trading at $66.32, showing a daily gain of 0.50%. The price is positioned just above the 100-day moving average (MA100) at $66.35, suggesting a potential short-term bullish bias. However, it remains below the 200-day moving average (MA200) at $66.92, which could act as a resistance level.
The 21-day moving average (MA21) at $64.22 and the 50-day moving average (MA50) at $65.66 are both below the current price, indicating a potential support zone that might provide buying opportunities if the price retraces.
The Relative Strength Index (RSI) is at 57.82, signaling that the market is not overbought, while the MACD at -0.67 suggests weak bearish momentum. Traders should watch for a break above the MA200 for stronger bullish confirmation, or a decline below the MA21 for potential downside targets
🔵 Natural Gas
Contract: NGZ25 | Price: $3.98 $/MMBtu (-1.39%)

📰 Market Drivers & News
The natural gas market is buzzing with momentum as global LNG exports surged to unprecedented levels last month, propelled by robust demand from key importing regions. This uptick underscores tightening supply-demand balances, with inventories in major markets showing modest builds amid milder weather patterns, yet winter heating needs loom large on the horizon. Geopolitical tensions persist, particularly in Europe where diversification efforts away from traditional suppliers intensify import reliance on seaborne cargoes, while policy shifts toward accelerated renewable transitions add layers of uncertainty. On the production front, expansions in liquefaction capacity across North America and the Middle East are ramping up, offsetting potential disruptions from maintenance schedules. Market sentiment leans cautiously optimistic, with traders bolstering long positions in anticipation of seasonal draws, though hedging against volatility remains prevalent. Looking ahead, the near-term outlook points to sustained firmness, driven by emerging cold snaps and ongoing export growth, barring unforeseen supply interruptions.
📈 Technical Analysis
Natural Gas is currently trading at $3.98, reflecting a daily decline of 1.39%. This price action is just above the 21-day moving average (MA21) of $3.92, suggesting immediate support at this level. The 50-day moving average (MA50) at $3.87 adds further support, while resistance is indicated by the 100-day MA at $4.16.
Momentum indicators reflect a mixed outlook; the Relative Strength Index (RSI) at 53.56 signals a neutral market, while the MACD at 0.02 suggests a convergence of momentum. Should Natural Gas break below the MA21, traders may target the MA50 at $3.87 as the next support level. Conversely, a sustained move above $4.00 could lead to a retest of the crucial resistance at $4.16.
In summary, traders should closely monitor these moving averages and momentum indicators for potential entry and exit points as Natural Gas navig
Disclaimer
The content on MarketsFN.com is provided for educational and informational purposes only. It does not constitute financial advice, investment recommendations, or trading guidance. All investments involve risks, and past performance does not guarantee future results. You are solely responsible for your investment decisions and should conduct independent research and consult a qualified financial advisor before acting. MarketsFN.com and its authors are not liable for any losses or damages arising from your use of this information.


