Energy Market Snapshot: Natural Gas Soars 4.62% Amid Supply Developments
⚡ Market Overview
Energy markets on October 20, 2025 reflect dynamic trading across crude oil, Brent, and natural gas December 2025 futures contracts. The analysis below covers market drivers, technical indicators, and trading outlook for each energy commodity.
📋 Contract Specifications
December 2025 Futures Contracts:
• CLZ25: NYMEX WTI Crude Oil (CL = Crude Light, Z = December, 25 = 2025)
• BZZ25: ICE Brent Crude (BZ = Brent, Z = December, 25 = 2025)
• NGZ25: NYMEX Natural Gas (NG = Natural Gas, Z = December, 25 = 2025)
Performance Summary
| Commodity | Contract | Price | Unit | Daily % | MA21 | MA50 | MA100 | MA200 | RSI | MACD |
|---|---|---|---|---|---|---|---|---|---|---|
| Crude Oil (WTI) | CLZ25 | $56.58 | $/barrel | -1.00% | $60.76 | $61.76 | $62.60 | $63.41 | 31.23 | -1.48 |
| Brent Oil | BZZ25 | $60.64 | $/barrel | -1.06% | $64.86 | $65.76 | $66.30 | $67.09 | 31.94 | -1.45 |
| Natural Gas | NGZ25 | $3.91 | $/MMBtu | +4.62% | $3.86 | $3.86 | $4.19 | $4.48 | 52.91 | -0.04 |
⚫ Crude Oil (WTI)
Contract: CLZ25 | Price: $56.58 $/barrel (-1.00%)

📰 Market Drivers & News
In the volatile Crude Oil (WTI) market, a surge in Chinese refining activity has notably eroded surplus stockpiles, tightening short-term supply availability as processors ramp up operations amid steady domestic fuel needs. This contrasts with broader demand headwinds, including sluggish global economic growth and a resilient U.S. dollar, which continue to weigh on consumption prospects. Inventory trends reflect this dichotomy, with reduced builds in key regions signaling potential supply discipline, though overall stockpiles remain ample due to robust non-OPEC production output.
Geopolitically, muted tensions in major producing areas have avoided disruptions, while policy shifts, such as sustained OPEC+ production curbs, aim to balance the market without aggressive hikes. Production decisions from U.S. shale operators show measured expansions, prioritizing efficiency over volume.
Market sentiment leans bearish, with traders increasing short positions amid persistent demand doubts. Near-term, expect downward pressure to persist unless upcoming inventory data or economic signals surprise to the upside, potentially stabilizing the outlook.
📈 Technical Analysis
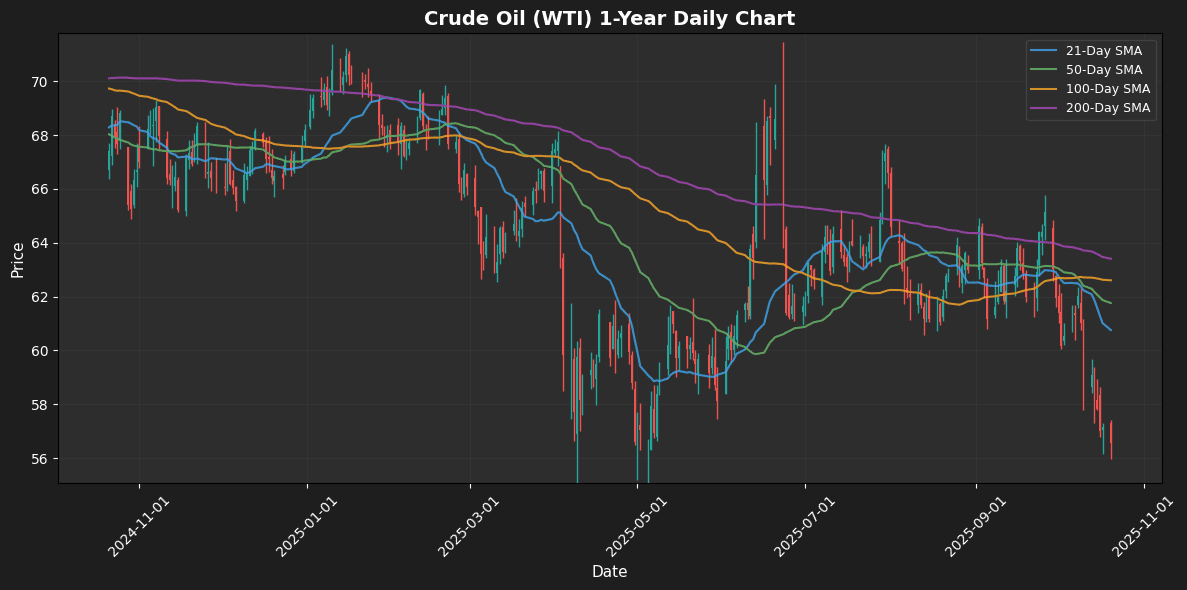
Crude Oil (WTI) currently trades at $56.58, reflecting a daily decrease of 1.00%. The price notably remains below key moving averages (MAs), with the 21-day MA at $60.76, the 50-day at $61.76, the 100-day at $62.60, and the 200-day at $63.41. This positions WTI in a bearish trend, as the price sits well below these critical resistance levels.
The Relative Strength Index (RSI) at 31.23 indicates that crude oil is in oversold territory, suggesting potential for a corrective bounce if buying interest materializes. However, the MACD reading of -1.48 reinforces the negative momentum, signaling that selling pressure remains dominant.
Traders should monitor for potential support around the psychological level of $55, with resistance established at the MAs. A decisive move above the 21-day MA could indicate a trend reversal, while sustained moves below
🟤 Brent Oil
Contract: BZZ25 | Price: $60.64 $/barrel (-1.06%)

📰 Market Drivers & News
In the volatile landscape of global energy markets, today’s Brent oil developments underscore a delicate balance between constrained supply and resilient demand. Key events include ongoing OPEC+ deliberations on output quotas, which have injected uncertainty into trading floors, while fresh inventory data revealed modest draws in major stockpiles, signaling tighter balances amid seasonal refinery maintenance.
Supply dynamics remain pressured by voluntary production cuts from key producers, limiting capacity expansions despite calls for higher output to meet winter heating needs. Demand trends show steady industrial uptake in Asia, offsetting softer European consumption influenced by economic headwinds.
Geopolitically, escalating tensions in the Middle East have heightened supply disruption risks, compounded by policy shifts toward accelerated energy transitions in Europe, potentially curbing long-term fossil fuel reliance.
Market sentiment leans cautious, with traders positioning for volatility as hedgers build defensive stances amid mixed economic signals.
Near-term outlook points to a stabilized market, barring unforeseen escalations, as fundamentals support gradual equilibrium. (138 words)
📈 Technical Analysis
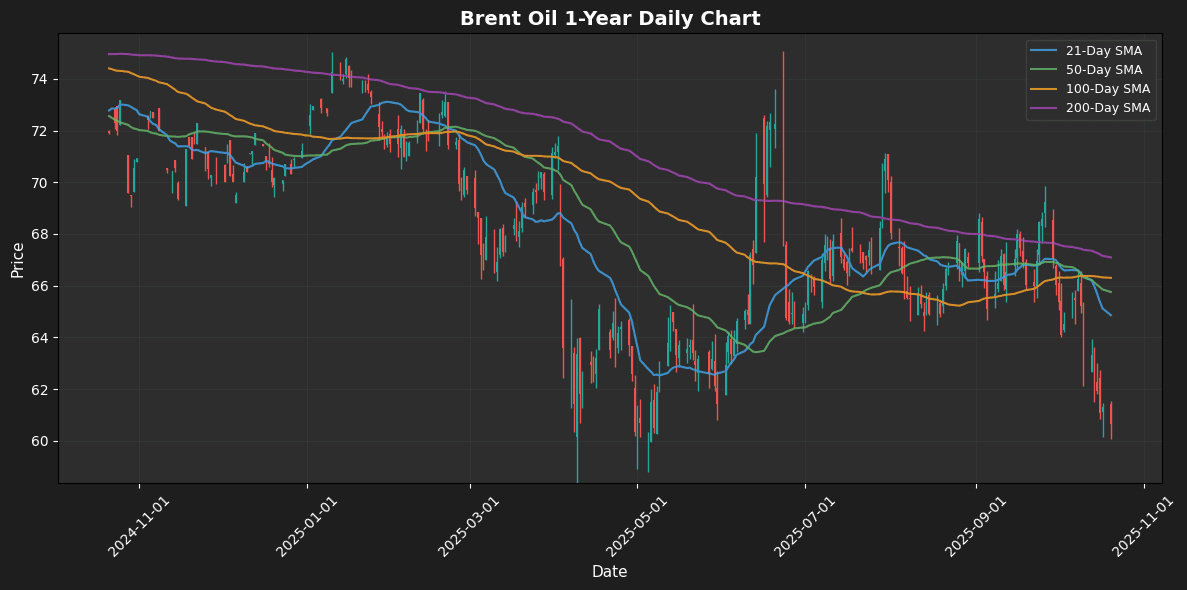
Brent Oil is currently trading at $60.64, reflecting a daily decline of 1.06%. The price is notably below critical moving averages, with the 21-day MA at $64.86, the 50-day MA at $65.76, and the 100-day MA at $66.30, confirming a bearish trend. The 200-day MA at $67.09 serves as a long-term resistance level.
The RSI is at 31.94, indicating that Brent is nearing oversold territory, suggesting potential for a short-term reversal; however, the momentum remains weak. The MACD, currently at -1.45, reinforces the downward momentum as it remains below the signal line.
Traders should watch for potential support near the previous low around $59. This level may act as a catalyst for a bounce-back if tested, while resistance lies at the MA21. In summary, a cautious approach is warranted as the outlook remains bearish, emphasizing the need for
🔵 Natural Gas
Contract: NGZ25 | Price: $3.91 $/MMBtu (+4.62%)

📰 Market Drivers & News
The natural gas market is buzzing with optimism amid surging demand from AI-driven data centers and industrial electrification, as energy firms pivot to capitalize on these trends. Key developments include expanded LNG export projects and maintenance schedules at major production hubs, which could temporarily tighten supply chains. On the demand side, warmer weather forecasts and robust power generation needs are bolstering consumption, while inventories remain ample following seasonal injections, though draws in key regions signal underlying tightness.
Geopolitically, trade tensions and proposed tariffs on critical imports like steel and aluminum are raising concerns over infrastructure costs, potentially slowing domestic expansion. Production remains resilient with steady output from shale plays, but operators are eyeing capacity upgrades to meet global commitments. Trader sentiment leans cautiously bullish, with increased long positions reflecting faith in fundamentals over policy hurdles.
Near-term, expect a balanced market with upside potential from sustained demand growth, tempered by inventory buffers and policy uncertainties.
📈 Technical Analysis
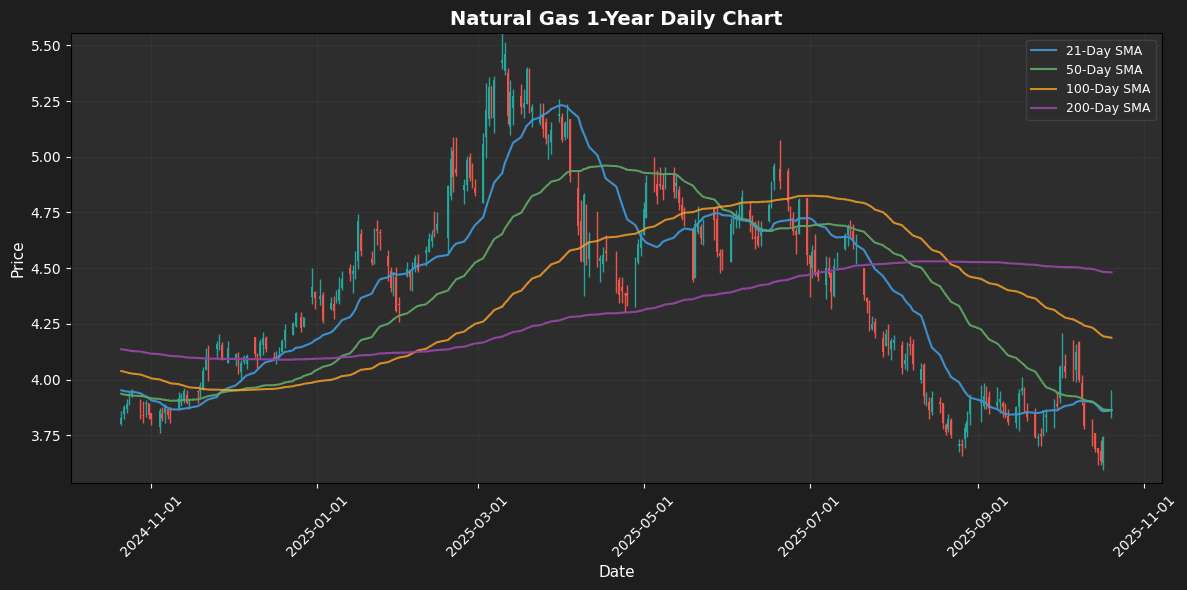
Natural Gas is currently trading at $3.91, reflecting a daily increase of 4.62%. This uptick positions the price just above the 21-day and 50-day moving averages, both at $3.86, suggesting a potential bullish trend. However, the higher moving averages – MA100 at $4.19 and MA200 at $4.48 – indicate longer-term resistance levels that may present challenges for further upside movement.
The RSI is currently at 52.91, indicating a neutral momentum, while the MACD at -0.04 suggests a lack of strong momentum either way. Traders should closely watch for a potential crossover of the MACD into positive territory, which could signal a strengthening bullish trend.
Key support is at $3.86, aligning with the MA21 and MA50, while downside risks are mitigated by the current price’s distance from lower moving averages. For a bullish outlook, a sustained move above $4.00 would be necessary to gain
Disclaimer
The content on MarketsFN.com is provided for educational and informational purposes only. It does not constitute financial advice, investment recommendations, or trading guidance. All investments involve risks, and past performance does not guarantee future results. You are solely responsible for your investment decisions and should conduct independent research and consult a qualified financial advisor before acting. MarketsFN.com and its authors are not liable for any losses or damages arising from your use of this information.


