Energy Update: Natural Gas Rallies 2.59% – RSI at 63
📊 Market Overview
Report Date: November 03, 2025
| Commodity | Price | Daily Change (%) | MA21 | MA50 | MA100 | MA200 | RSI | MACD |
|---|---|---|---|---|---|---|---|---|
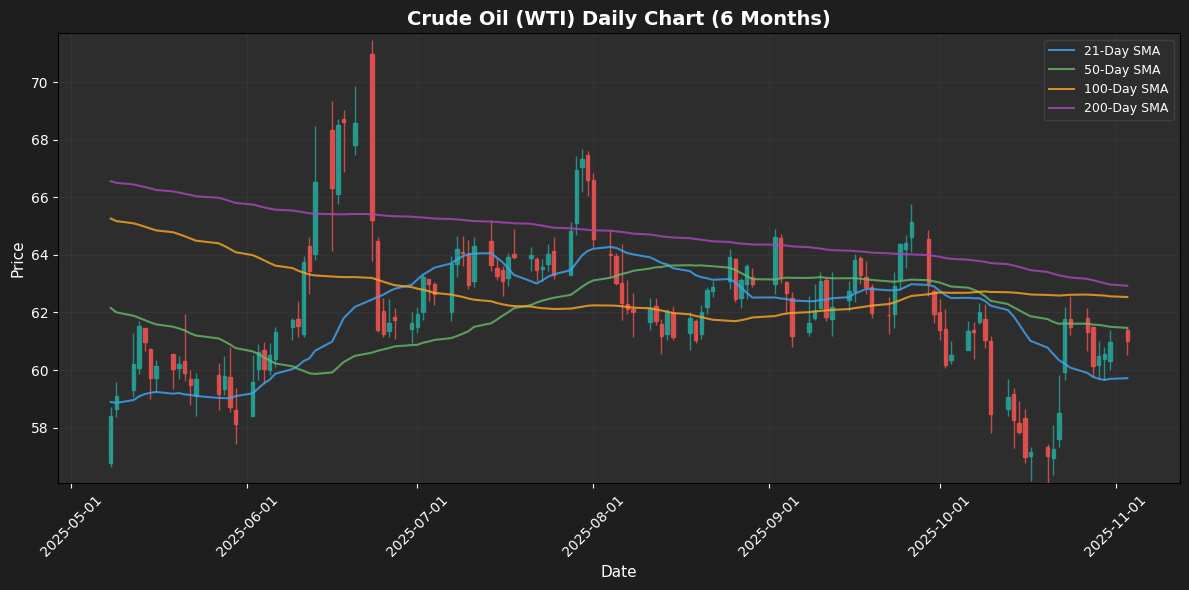
| Crude Oil (WTI) | $61.01 | +0.05% | $59.72 | $61.47 | $62.54 | $62.93 | 53.06 | -0.13 |
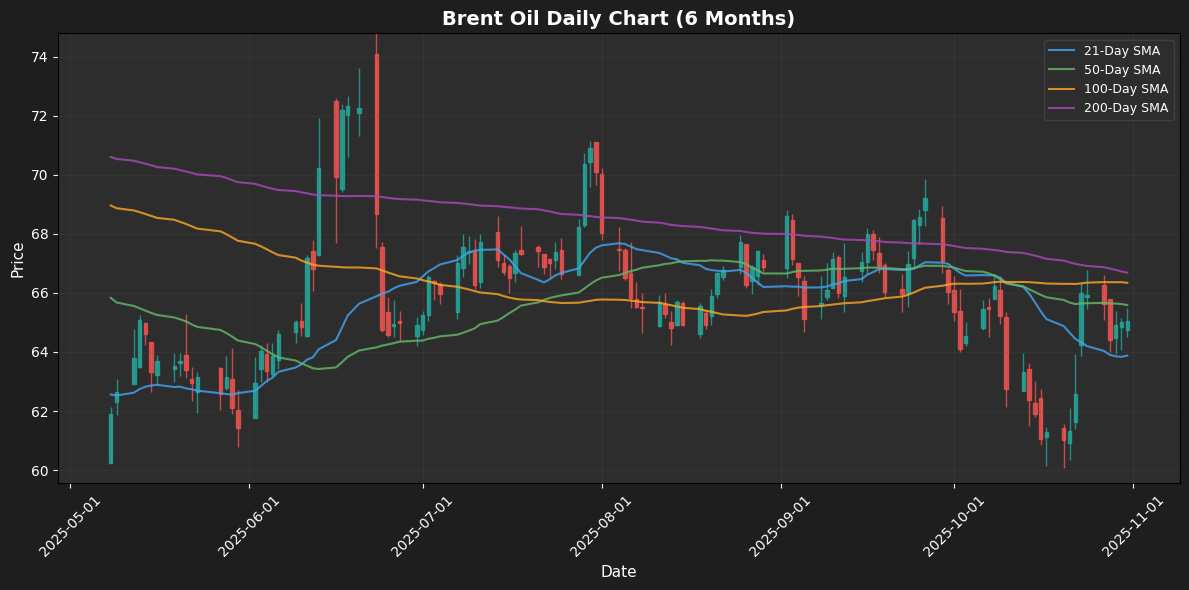
| Brent Oil | $65.06 | +0.09% | $63.88 | $65.59 | $66.34 | $66.69 | 52.42 | -0.15 |
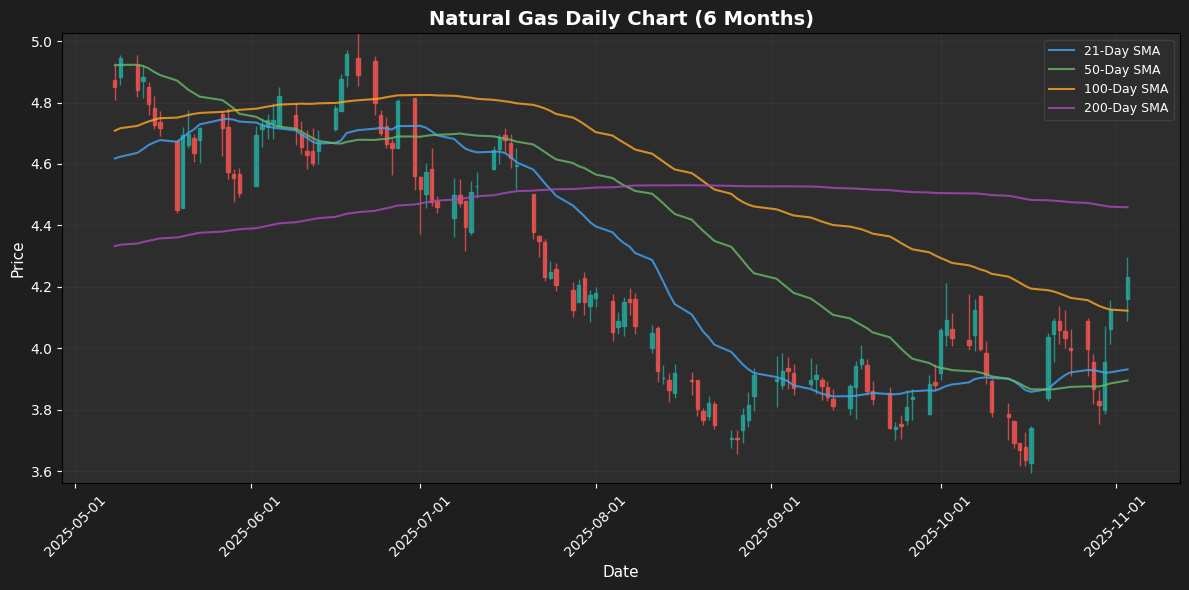
| Natural Gas | $4.23 | +2.59% | $3.93 | $3.89 | $4.12 | $4.46 | 63.47 | 0.04 |
⚡ Crude Oil (WTI)

Technical Analysis
Crude Oil (WTI) is currently trading at $61.01, reflecting a minor daily change of 0.05%. The price remains nestled between the 21-day moving average (MA21) at $59.72 and the 50-day moving average (MA50) at $61.47, suggesting a possible consolidation phase. The resistance levels appear around the MA100 ($62.54) and the MA200 ($62.93), indicating key hurdles for further upward movement.
The Relative Strength Index (RSI) is at 53.06, signaling neutral momentum, while the MACD value of -0.13 indicates a slight bearish trend but lacks strong confirmation. Overall, the price action in the near term appears stable but could be influenced by external factors. A sustained break above the MA50 could suggest a bullish trend, while failure to hold above the MA21 might lead to retesting lower support levels. Traders should watch these key levels for insights into potential market direction
⚡ Brent Oil

Technical Analysis
Brent Oil is currently trading at $65.06, reflecting a minor daily change of 0.09%. The price remains just below the 50-day moving average (MA50) at $65.59, indicating short-term resistance. The 21-day moving average (MA21) at $63.88 serves as immediate support, providing a potential floor for prices. Moreover, the longer-term indicators, including the 100-day (MA100) and 200-day (MA200) moving averages at $66.34 and $66.69, respectively, suggest a bearish bias if the price fails to break through these levels.
Momentum indicators reveal a neutral sentiment; the Relative Strength Index (RSI) at 52.42 indicates no overbought or oversold conditions, while the MACD at -0.15 suggests a slight bearish momentum. Overall, Brent Oil is at a critical juncture; a break above MA50 could trigger bullish sentiment, while failure to hold near
⚡ Natural Gas

Technical Analysis
Natural gas is currently trading at $4.23, reflecting a daily increase of 2.59%. The recent price action appears bullish, breaking above the 21-day moving average (MA21) of $3.93, which signifies strong upward momentum and a potential shift in market sentiment. Notably, the 50-day moving average (MA50) is also below the current price, reinforcing the short-term bullish case.
The RSI stands at 63.47, indicating that the market is approaching overbought conditions, but still offers room for further upside before a potential correction. Conversely, the MACD at 0.04 suggests a weakening momentum; however, a crossover above zero could signal continued bullish momentum.
Key resistance levels are identified at the MA200 of $4.46, while support is firmly established at the MA50 of $3.89. Overall, the outlook remains cautiously optimistic, contingent on sustained momentum and broader market factors. A breach of $4.46 could
Disclaimer
The content on MarketsFN.com is provided for educational and informational purposes only. It does not constitute financial advice, investment recommendations, or trading guidance. All investments involve risks, and past performance does not guarantee future results. You are solely responsible for your investment decisions and should conduct independent research and consult a qualified financial advisor before acting. MarketsFN.com and its authors are not liable for any losses or damages arising from your use of this information.


