The EUROSTOXX50 is a leading stock index representing 50 major blue-chip companies across the Eurozone. Composed of sector leaders from 11 Eurozone countries, it serves as a barometer for the region’s economic health. Widely used by investors for benchmarking and investment purposes, the index plays a crucial role in European financial markets.
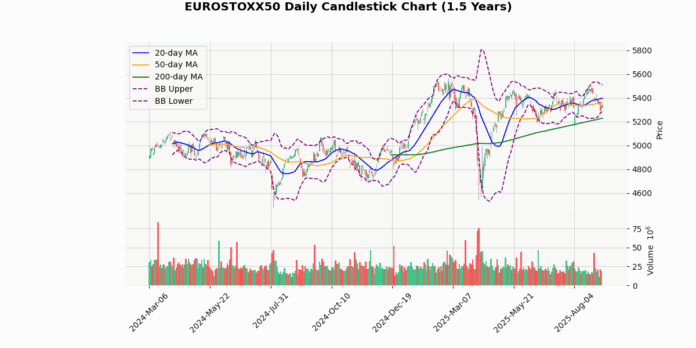
The EUROSTOXX50 index is currently priced at 5337.34, marking a modest increase of 0.23% today. Analyzing its position relative to various moving averages, the index is trading below the 20-day (5395.87) and 50-day (5359.32) averages but remains above the 200-day average (5229.01). This configuration suggests a short-term bearish trend but maintains a bullish outlook over a longer period.
The Bollinger Bands indicate a potential volatility contraction, as the index is trading closer to the lower band (5280.16) compared to the upper band (5511.58). This proximity to the lower band could signal a buying opportunity if other indicators align.
The Relative Strength Index (RSI) at 45.66 does not currently indicate overbought or oversold conditions, suggesting a neutral market sentiment. However, the Moving Average Convergence Divergence (MACD) at -5.22 with a signal line at 9.63 shows a bearish crossover, which could imply downward momentum in the near term.
The index’s current price is slightly above the 3-day low of 5290.46 and below the 3-day high of 5368.76, indicating recent trading within a narrow range. This is further supported by an Average True Range (ATR) of 51.63, pointing to moderate volatility.
Considering its year-to-date and 52-week metrics, the index has seen significant fluctuations, with current levels well above the yearly low (4540.22) yet below the high (5568.19). This suggests that while the index has recovered from its lowest points of the year, it has yet to challenge its previous peaks.
In summary, the EUROSTOXX50 is exhibiting mixed signals: bearish in the short term due to its position relative to moving averages and the MACD crossover, but maintaining a longer-term bullish stance above the 200-day moving average.
## Technical Metrics
| Metric | Value |
|---|---|
| Current Price | 5337.34 |
| Today’s Change (%) | 0.23 |
| 20-day MA | 5395.87 |
| % from 20-day MA | -1.08 |
| 50-day MA | 5359.32 |
| % from 50-day MA | -0.41 |
| 200-day MA | 5229.01 |
| % from 200-day MA | 2.07 |
| Bollinger Upper | 5511.58 |
| % from BB Upper | -3.16 |
| Bollinger Lower | 5280.16 |
| % from BB Lower | 1.08 |
| RSI (14) | 45.66 |
| MACD | -5.22 |
| MACD Signal | 9.63 |
| 3-day High | 5368.76 |
| % from 3-day High | -0.59 |
| 3-day Low | 5290.46 |
| % from 3-day Low | 0.89 |
| 52-week High | 5568.19 |
| % from 52-week High | -4.15 |
| 52-week Low | 4540.22 |
| % from 52-week Low | 17.56 |
| YTD High | 5568.19 |
| % from YTD High | -4.15 |
| YTD Low | 4540.22 |
| % from YTD Low | 17.56 |
| ATR (14) | 51.63 |
The EUROSTOXX50 index currently presents a mixed technical outlook, with its price of 5337.34 positioned below both the 20-day (5395.87) and 50-day (5359.32) moving averages, indicating a short-term bearish trend. However, the price remains above the 200-day moving average of 5229.01, suggesting a longer-term bullish sentiment.
The Bollinger Bands show the index trading near the lower band (5280.16), which could signal a potential rebound if it holds as a support level. The proximity to the lower band, combined with a relatively neutral RSI of 45.66, suggests that the index is neither overbought nor oversold, providing no strong momentum cues.
The MACD value at -5.22, below its signal line at 9.63, indicates bearish momentum in the short term, reinforcing the possibility of continued downward pressure. However, the Average True Range (ATR) of 51.63 points to moderate volatility, which could lead to potential price swings within the current trading range.
Key support and resistance levels to watch are the recent 3-day low at 5290.46 and the 3-day high at 5368.76, respectively. A break below the support could intensify selling, while a move above resistance might attract buying interest, potentially testing higher levels near the middle Bollinger Band (5395.87).
Overall, market sentiment appears cautiously bearish in the short term, with a watchful eye on key technical levels that could dictate the next directional move for the EUROSTOXX50 index.


