Flux Power Holdings, Inc., founded in 1998 by Christopher L. Anthony and Michael Johnson, specializes in designing, developing, and selling rechargeable lithium-ion energy storage systems for industrial applications, particularly targeting electric forklifts and airport ground support equipment. Headquartered in Vista, California, Flux Power aims to innovate within the energy storage sector to enhance industrial efficiency and sustainability.
Flux Power Holdings Inc. (FLUX) recently disclosed its financial results for the fourth quarter and fiscal year 2025, revealing a break-even earnings scenario for Q4. Despite not generating profit, the company reported strong revenue growth during this period, which could indicate robust sales and operational efficiency improvements. Additionally, Flux Power announced the closure of a $5 million private placement involving prefunded and common warrants, which could provide the company with essential capital for future expansions or debt reduction.
These financial maneuvers and outcomes could have mixed impacts on Flux Power’s stock. The break-even earnings report might concern investors looking for profitability, potentially putting downward pressure on the stock price. However, the strong revenue growth and successful capital raise through private placement might offset these concerns by demonstrating the company’s potential for future profitability and financial stability. Investors and stakeholders will likely monitor how these funds are utilized and whether revenue growth translates into net profits in the upcoming quarters.
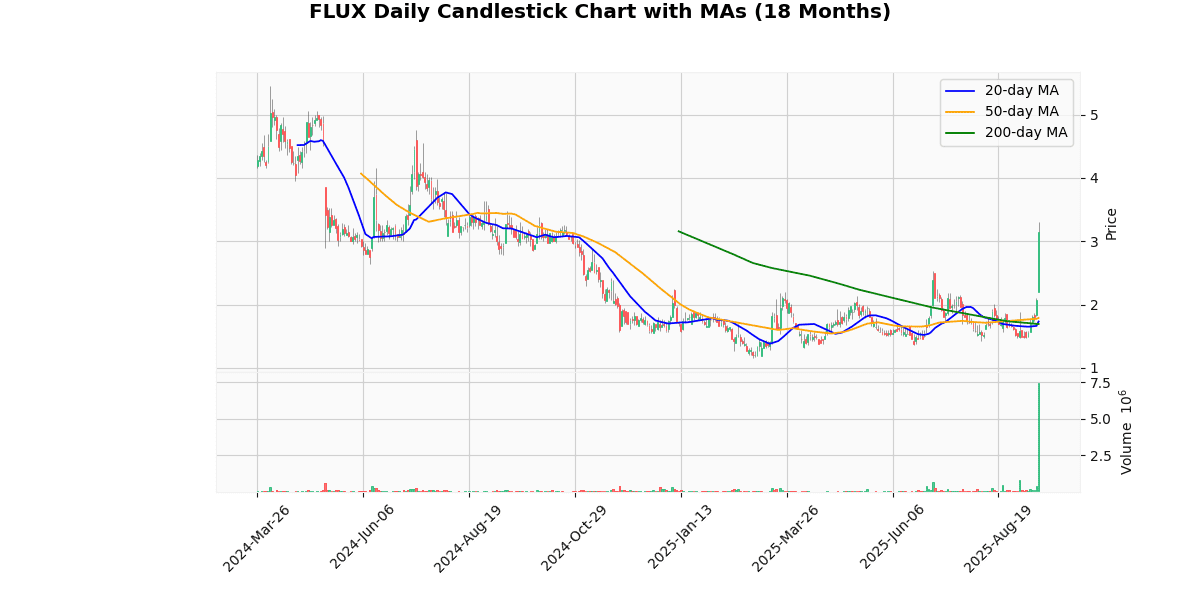
The current price of the asset is $3.15, marking a significant increase of 52.17% yesterday. This sharp rise suggests a strong buying interest or a positive market event impacting the asset. The price is nearing its 52-week high of $3.48 and has surpassed its year-to-date high of $3.31, indicating a robust upward trend in the short term.
The asset has shown substantial growth from both its 52-week and year-to-date lows, increasing by approximately 174%. This indicates a strong recovery and possibly a new bullish phase. The moving averages (MA20, MA50, MA200) show that the current price is significantly above these averages by 76% to 86%, highlighting a strong upward momentum over these periods.
The Relative Strength Index (RSI) at 84.87 suggests the asset is currently overbought, which could signal a potential pullback or price correction in the near future. The MACD at 0.14, although positive, is relatively low compared to the price change, indicating that while the momentum is upward, it might not be overwhelmingly strong.
Overall, the asset is experiencing a vigorous bullish trend, but with the high RSI, investors should be cautious of potential volatility or corrections.
## Price Chart

Flux Power Holdings, Inc. (NASDAQ: FLUX) reported a significant improvement in its financial performance for the fourth quarter and fiscal year ending June 30, 2025. The company announced a 25% increase in quarterly revenue, reaching $16.7 million, up from $13.4 million in the same quarter the previous year. Gross profit for the quarter surged 61% to $5.8 million, and gross margin expanded by 760 basis points to 34.5%.
For the fiscal year, Flux Power’s revenue grew by 9% to $66.4 million. The annual gross margin also improved, rising by 440 basis points to 32.7%. Despite higher operating expenses of $26.8 million due to costs associated with the restatement of previously issued financial statements, the company managed to reduce its operating loss to $5.0 million from $6.6 million in the prior year.
The net loss for the quarter improved to $1.2 million, or ($0.07) per share, from a net loss of $2.2 million, or ($0.13) per share in Q4 2024. The annual net loss also showed improvement at $6.7 million, or ($0.40) per share, compared to $8.3 million, or ($0.50) per share previously.
Additionally, Flux Power secured over $3.2 million in major purchase orders from North American airlines and was recognized among the Financial Times’ fastest-growing companies. The company ended the fiscal year with $1.3 million in cash, bolstered by an additional $5 million raised through a private placement.
## Earnings Trend Table
| Date | Estimate EPS | Reported EPS | Surprise % | |
|---|---|---|---|---|
| 0 | 2025-09-16 | -0.10 | -0.07 | -30.00 |
| 1 | 2025-05-08 | -0.07 | -0.12 | -66.67 |
| 2 | 2025-03-20 | -0.11 | -0.11 | -3.12 |
| 3 | 2025-01-29 | -0.13 | -0.13 | 1.52 |
| 4 | 2024-05-09 | -0.10 | -0.16 | -60.00 |
| 5 | 2024-02-08 | -0.04 | -0.05 | -15.39 |
| 6 | 2023-11-09 | -0.13 | -0.13 | -2.63 |
| 7 | 2023-09-21 | -0.05 | -0.09 | -63.64 |
Over the last eight quarters, the company has consistently reported negative earnings per share (EPS), indicating a period of financial challenges. The trend in EPS reveals a fluctuation in the magnitude of losses, with no clear pattern towards improvement or deterioration over the two-year span.
A closer examination shows that the company has missed EPS estimates on five occasions, with particularly significant deviations in Q3 2024 (-63.64% surprise), Q2 2025 (-66.67% surprise), and Q2 2024 (-60.00% surprise). These quarters highlight instances where the company’s financial performance was notably below analyst expectations, suggesting potential volatility or unpredictability in its financial management or market conditions.
Conversely, there were three quarters (Q4 2023, Q1 2025, and Q3 2025) where the reported EPS was relatively close to or slightly better than estimates, indicating some level of alignment with expectations despite the ongoing losses.
Overall, the data points to a company struggling with its financial health, with significant unpredictability in its ability to meet analyst expectations. This could be a concern for investors looking for stability and predictability in financial performance.
Disclaimer
The content on MarketsFN.com is provided for educational and informational purposes only. It does not constitute financial advice, investment recommendations, or trading guidance. All investments involve risks, and past performance does not guarantee future results. You are solely responsible for your investment decisions and should conduct independent research and consult a qualified financial advisor before acting. MarketsFN.com and its authors are not liable for any losses or damages arising from your use of this information.


