## Forex and Global News
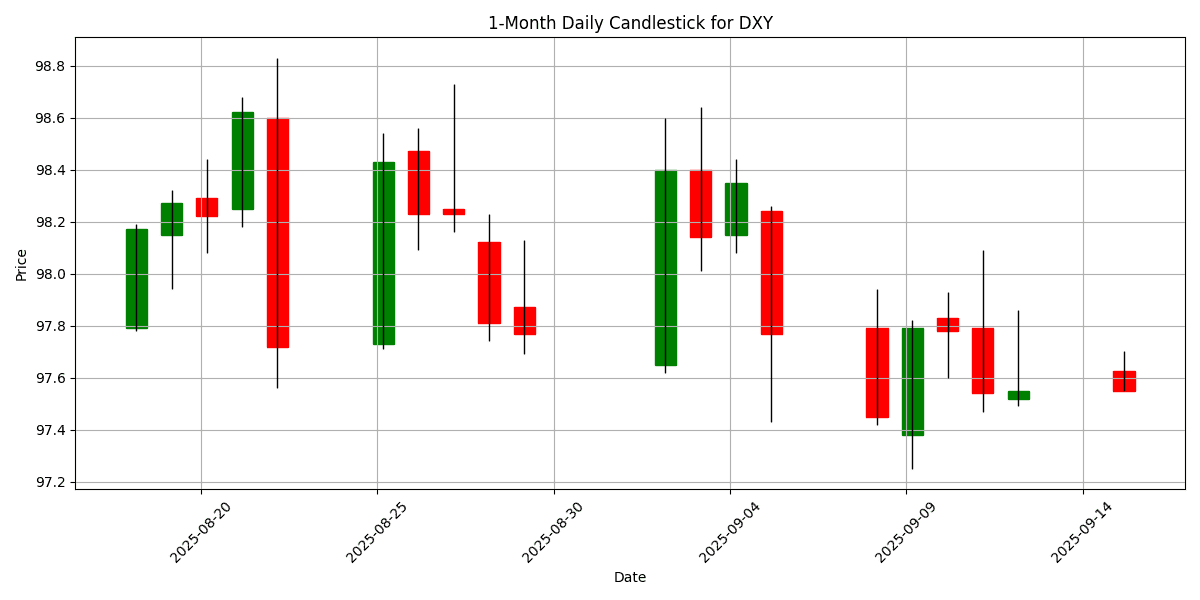
Market sentiment remains cautious ahead of the U.S. Federal Reserve’s meeting on Wednesday, where investors anticipate potential interest rate cuts. The U.S. Dollar Index (DXY) trades at 97.55, down 0.0502%, reflecting a subdued dollar as traders await clarity on monetary policy. The GBP/USD has shown resilience, marking a third consecutive weekly gain and testing the 1.3600 resistance level, buoyed by expectations surrounding the Fed and the Bank of England’s decisions.
In Europe, the Euro (EUR) remains stable, hovering around 1.1700 against the USD, amid speculation regarding the Fed’s policy direction. Meanwhile, China’s economic slowdown has deepened, with disappointing retail sales and industrial output figures, raising concerns about global demand and impacting risk sentiment. This backdrop has kept gold (XAU/USD) volatile, trading near $3,650, as traders brace for potential price movements depending on the Fed’s policy stance.
Geopolitically, U.S. and Chinese officials are engaged in trade talks in Spain, focusing on key issues including TikTok, which could influence market dynamics further. Overall, the forex market remains in a wait-and-see mode as major central bank decisions loom.
## Economic Calendar Events Today
All times are in US Eastern Time (New York).
| Date | Time | Cur | Imp | Event | Actual | Forecast |
|---|---|---|---|---|---|---|
| 2025-09-15 | 02:30 | 🇨🇭 | Medium | PPI (MoM) (Aug) | -0.6% | 0.1% |
| 2025-09-15 | 02:30 | 🇮🇳 | Medium | WPI Inflation (YoY) (Aug) | 0.52% | 0.30% |
| 2025-09-15 | 05:00 | 🇪🇺 | Medium | Trade Balance (Jul) | 11.7B | |
| 2025-09-15 | 07:30 | 🇪🇺 | Medium | ECB’s Schnabel Speaks | ||
| 2025-09-15 | 08:30 | 🇺🇸 | Medium | NY Empire State Manufacturing Index (Sep) | 4.30 | |
| 2025-09-15 | 08:30 | 🇨🇦 | Medium | Wholesale Sales (MoM) (Jul) | 1.4% | |
| 2025-09-15 | 14:30 | 🇪🇺 | Medium | ECB President Lagarde Speaks |
On September 15, 2025, several key economic events are poised to impact foreign exchange markets.
The Swiss franc (CHF) is under pressure following the release of the Producer Price Index (PPI) for August, which showed a surprising contraction of -0.6%, significantly below the forecast of 0.1%. This unexpected decline may lead to a weakening of the CHF as it raises concerns about inflationary pressures in Switzerland.
In India, the Wholesale Price Index (WPI) inflation for August came in at 0.52%, exceeding expectations of 0.30%. This positive surprise could bolster the Indian rupee (INR), as higher inflation may prompt the Reserve Bank of India to consider tightening monetary policy sooner than anticipated.
The euro (EUR) will be closely monitored with the upcoming Trade Balance data for July, expected to show a surplus of 11.7 billion euros. Additionally, speeches by ECB officials, including Isabel Schnabel and President Christine Lagarde, may provide insights into the central bank’s monetary policy direction, impacting EUR volatility.
In the U.S., the NY Empire State Manufacturing Index for September is anticipated at 4.30, which could influence the dollar (USD) depending on whether the actual figure meets or diverges from expectations.
Overall, these events highlight the potential for significant currency fluctuations, particularly for the CHF and INR.
## Major FX Group
| Name | Symbol | Price | Daily (%) | 5D (%) | 1W (%) | 1M (%) | 3M (%) | 6M (%) | YTD (%) | 12M (%) | MA50 | MA100 | MA200 | RSI | MACD |
|---|---|---|---|---|---|---|---|---|---|---|---|---|---|---|---|
| EUR/USD – Euro / U.S. Dollar | EURUSD | 1.1740 | 0.0682 | 0.3183 | 0.2291 | 0.7609 | 1.6332 | 7.3177 | 12.82 | 5.9770 | 1.1663 | 1.1548 | 1.1087 | 64.42 | 0.0022 |
| USD/JPY – U.S. Dollar / Japanese Yen | USDJPY | 147.44 | -0.1801 | 0.0312 | -0.6107 | -0.1713 | 1.8718 | -1.3476 | -6.0875 | 4.1972 | 147.53 | 145.99 | 148.80 | 50.08 | 0.0364 |
| GBP/USD – British Pound / U.S. Dollar | GBPUSD | 1.3582 | 0.1844 | 0.4504 | 0.6603 | 0.3791 | 0.1211 | 4.4727 | 8.2309 | 3.4242 | 1.3467 | 1.3472 | 1.3082 | 61.96 | 0.0024 |
| USD/CHF – U.S. Dollar / Swiss Franc | USDCHF | 0.7965 | 0.0000 | -0.1003 | -0.3353 | -1.3647 | -2.1150 | -9.1526 | -11.8175 | -6.2809 | 0.8021 | 0.8110 | 0.8494 | 41.90 | -0.0020 |
| AUD/USD – Australian Dollar / U.S. Dollar | AUDUSD | 0.6664 | 0.1955 | 1.2043 | 1.6706 | 2.5623 | 2.3498 | 4.7601 | 7.1383 | -0.9350 | 0.6527 | 0.6501 | 0.6391 | 76.94 | 0.0035 |
| USD/CAD – U.S. Dollar / Canadian Dollar | USDCAD | 1.3834 | -0.0145 | -0.0910 | 0.0000 | 0.1513 | 1.9117 | -3.2554 | -3.5945 | 1.9019 | 1.3759 | 1.3762 | 1.4021 | 50.65 | 0.0017 |
| NZD/USD – New Zealand Dollar / U.S. Dollar | NZDUSD | 0.5963 | 0.1175 | 0.6244 | 1.2618 | 0.7079 | -1.4250 | 2.4819 | 5.7323 | -3.6206 | 0.5935 | 0.5963 | 0.5836 | 67.14 | 0.0005 |
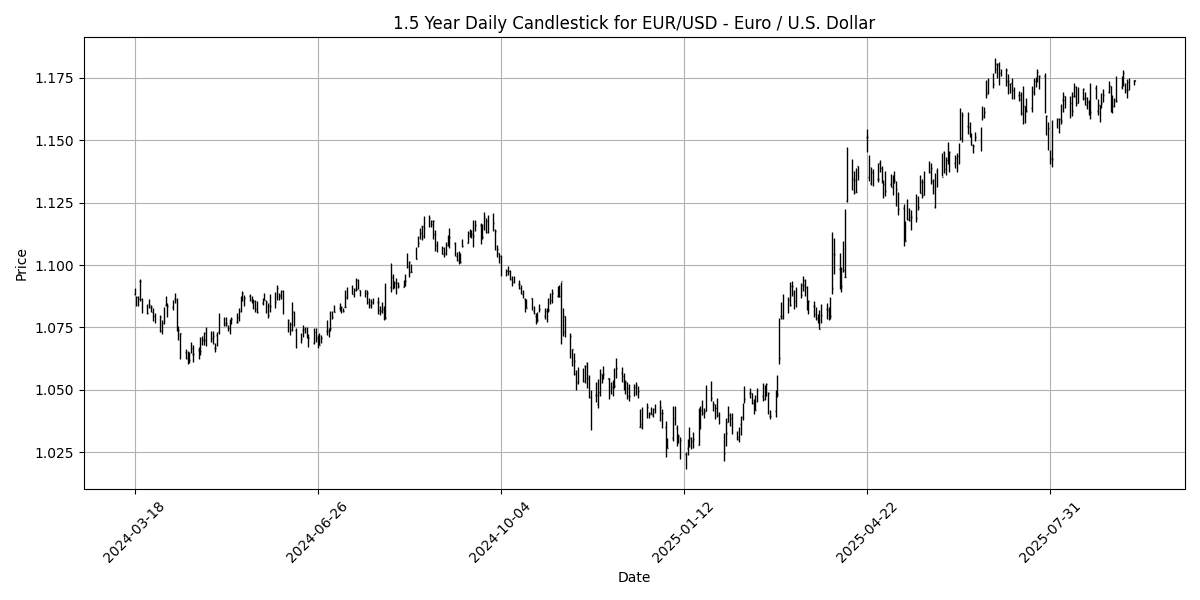
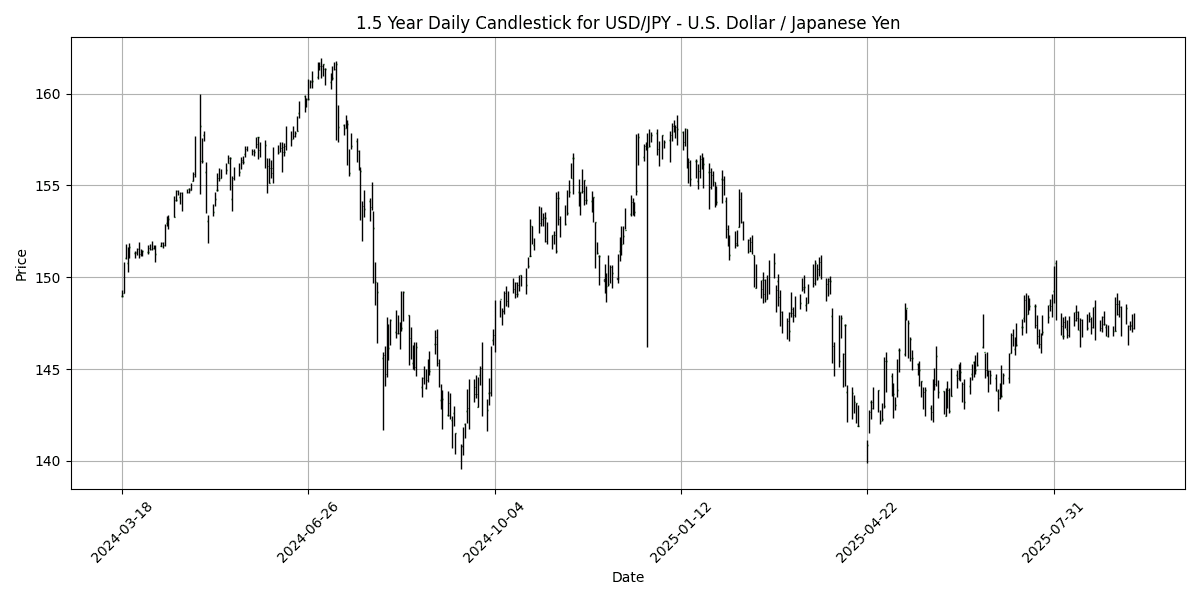
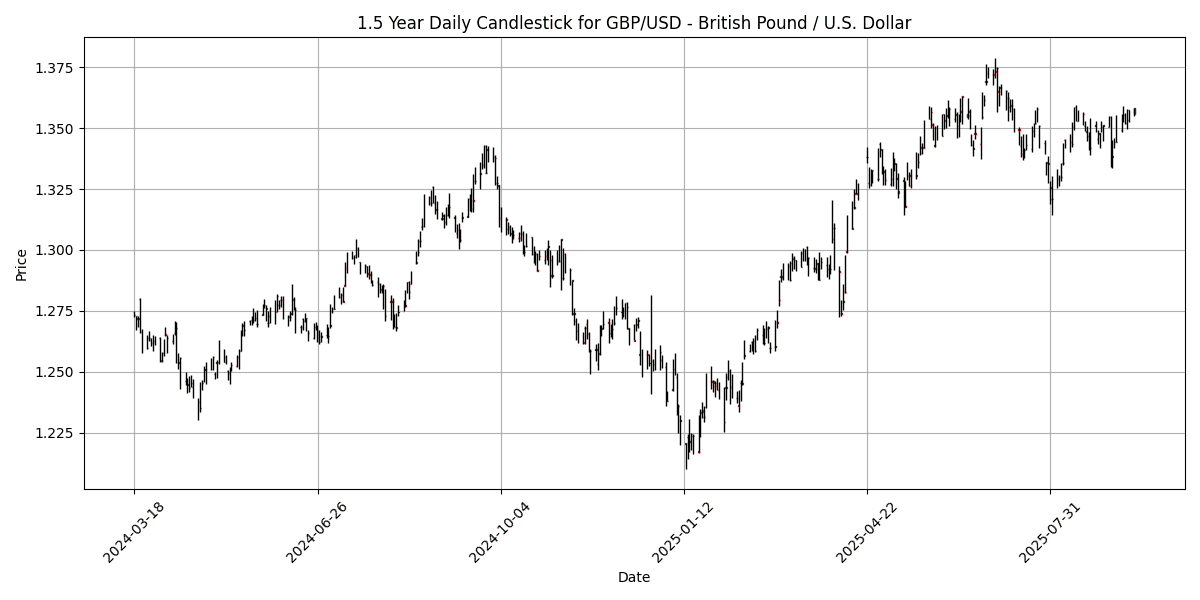
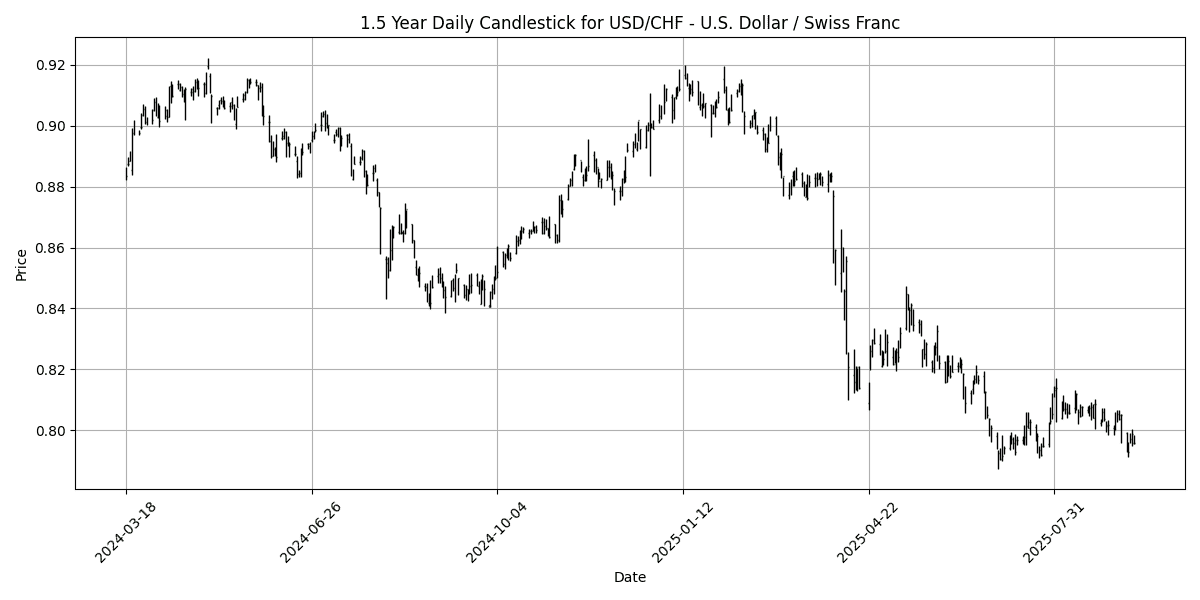
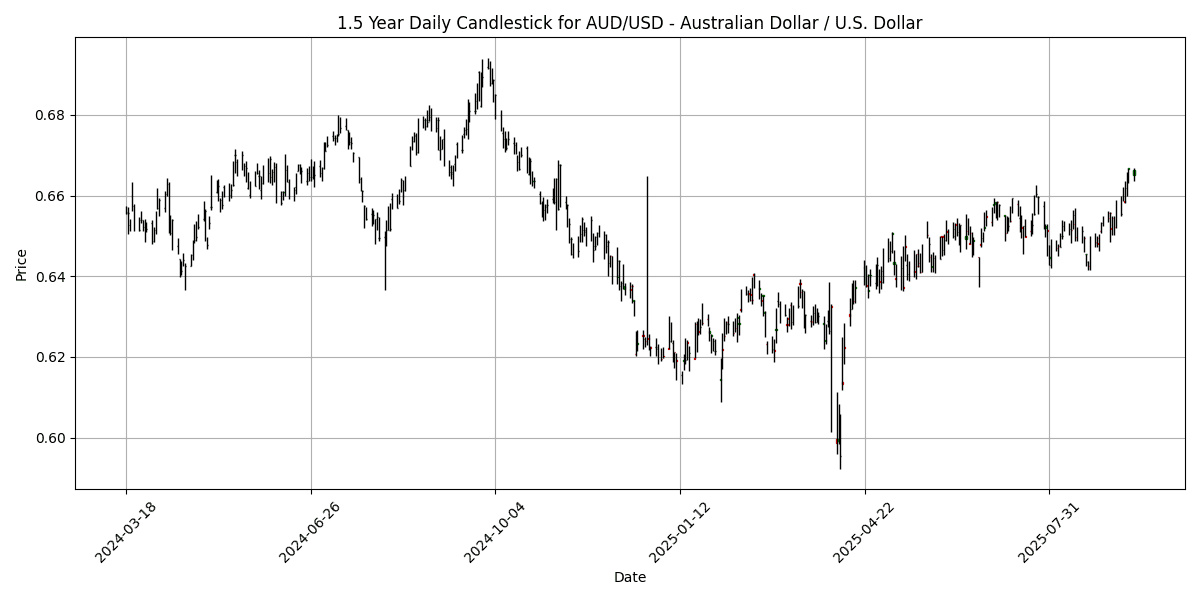
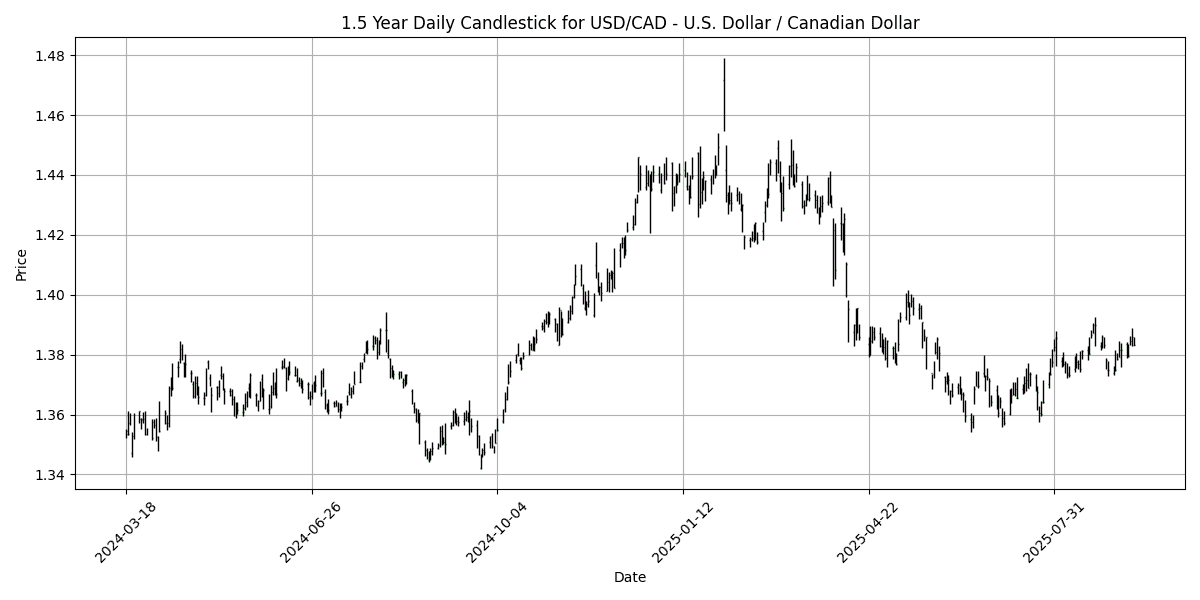

In the current forex landscape, several key pairs exhibit notable technical indicators. The AUD/USD is in an overbought condition, with an RSI of 76.94, suggesting potential price corrections ahead. The positive MACD reinforces bullish momentum, but caution is warranted due to the elevated RSI. Conversely, the USD/CHF shows oversold conditions with an RSI of 41.90 and a negative MACD, indicating bearish sentiment; this may present a buying opportunity for contrarian traders.
The EUR/USD and GBP/USD are both in neutral territory, with RSIs of 64.42 and 61.96, respectively, indicating potential for further upside but lacking immediate overbought signals. The USD/JPY maintains a balanced stance with an RSI of 50.08, reflecting indecision. Overall, traders should monitor these technical indicators closely, as shifts in momentum could lead to significant price movements across these major currency pairs.
## Cross FX Group
| Name | Symbol | Price | Daily (%) | 5D (%) | 1W (%) | 1M (%) | 3M (%) | 6M (%) | YTD (%) | 12M (%) | MA50 | MA100 | MA200 | RSI | MACD |
|---|---|---|---|---|---|---|---|---|---|---|---|---|---|---|---|
| EUR/GBP | EURGBP | 0.8641 | -0.1156 | -0.1618 | -0.4539 | 0.3566 | 1.4857 | 2.6954 | 4.2101 | 2.4422 | 0.8660 | 0.8570 | 0.8469 | 44.39 | 0.0003 |
| EUR/JPY | EURJPY | 173.05 | -0.1062 | 0.3287 | -0.4075 | 0.5685 | 3.5224 | 5.8553 | 5.9136 | 10.40 | 172.07 | 168.53 | 164.68 | 53.64 | 0.3488 |
| EUR/CHF | EURCHF | 0.9348 | 0.0642 | 0.1715 | -0.1346 | -0.6483 | -0.5437 | -2.5214 | -0.5426 | -0.7074 | 0.9355 | 0.9360 | 0.9389 | 36.72 | -0.0007 |
| EUR/AUD | EURAUD | 1.7617 | -0.1247 | -0.8649 | -1.4075 | -1.7473 | -0.7252 | 2.4518 | 5.2893 | 6.9765 | 1.7875 | 1.7763 | 1.7331 | 10.18 | -0.0048 |
| GBP/JPY | GBPJPY | 200.25 | 0.0065 | 0.4857 | 0.0500 | 0.2167 | 2.0075 | 3.0765 | 1.6523 | 7.7741 | 198.68 | 196.62 | 194.40 | 59.33 | 0.3361 |
| GBP/CHF | GBPCHF | 1.0817 | 0.1760 | 0.3618 | 0.3172 | -0.9931 | -2.0004 | -5.0866 | -4.5573 | -3.0735 | 1.0801 | 1.0922 | 1.1088 | 45.12 | -0.0012 |
| AUD/JPY | AUDJPY | 98.22 | 0.0265 | 1.2128 | 1.0213 | 2.3646 | 4.2884 | 3.3263 | 0.6156 | 3.1982 | 96.25 | 94.86 | 95.04 | 90.31 | 0.4573 |
| AUD/NZD | AUDNZD | 1.1174 | 0.0716 | 0.5733 | 0.3989 | 1.8308 | 3.8611 | 2.2174 | 1.3336 | 2.7721 | 1.0989 | 1.0898 | 1.0952 | 72.08 | 0.0047 |
| CHF/JPY | CHFJPY | 185.12 | -0.1580 | 0.1650 | -0.2585 | 1.2326 | 4.1038 | 8.6086 | 6.5145 | 11.19 | 183.98 | 180.15 | 175.47 | 63.37 | 0.5227 |
| NZD/JPY | NZDJPY | 87.89 | -0.0466 | 0.6447 | 0.6308 | 0.5342 | 0.4514 | 1.1078 | -0.7117 | 0.4124 | 87.57 | 87.01 | 86.76 | 78.16 | 0.0411 |
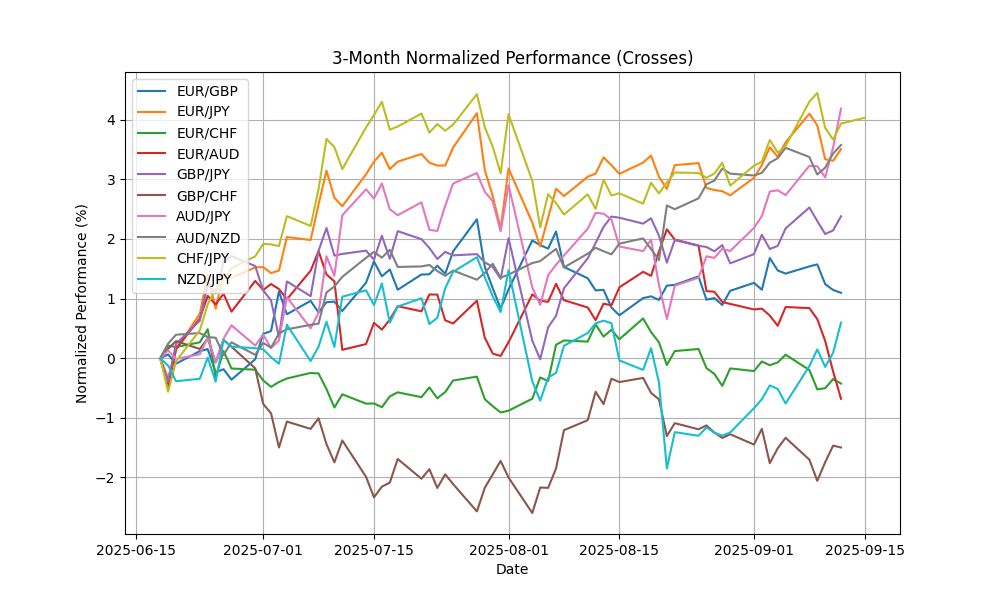
Current analysis indicates mixed conditions across the FX pairs. Notably, EUR/AUD is significantly oversold with an RSI of 10.18 and a negative MACD, suggesting potential for a corrective rebound. Conversely, AUD/JPY is in overbought territory with an RSI of 90.31, supported by a bullish MACD, indicating a possible pullback. Similarly, NZD/JPY at an RSI of 78.16 also suggests overbought conditions. EUR/CHF remains bearish with an RSI of 36.72, while other pairs like EUR/GBP and GBP/JPY exhibit neutral momentum. Traders should exercise caution, particularly with the overextended pairs, as corrections may be imminent.
## Exotics and Emerging
| Name | Symbol | Price | Daily (%) | 5D (%) | 1W (%) | 1M (%) | 3M (%) | 6M (%) | YTD (%) | 12M (%) | MA50 | MA100 | MA200 | RSI | MACD |
|---|---|---|---|---|---|---|---|---|---|---|---|---|---|---|---|
| USD/TRY – U.S. Dollar / Turkish Lira | USDTRY | 41.38 | 0.1244 | 0.2872 | 0.2914 | 1.2948 | 5.0478 | 12.75 | 17.19 | 21.78 | 40.72 | 39.93 | 38.12 | 97.12 | 0.1787 |
| USD/ZAR – U.S. Dollar / South African Rand | USDZAR | 17.34 | -0.1451 | -1.1064 | -1.4823 | -1.3682 | -2.6706 | -4.2301 | -7.5945 | -2.2493 | 17.70 | 17.84 | 18.15 | 46.12 | -0.0649 |
| USD/THB – U.S. Dollar / Thai Baht | USDTHB | 31.94 | 0.6936 | 0.5667 | -0.4364 | -1.6020 | -1.6323 | -5.0253 | -6.4413 | -4.3254 | 32.35 | 32.58 | 33.27 | 23.58 | -0.1729 |
| USD/SEK – U.S. Dollar / Swedish Krona | USDSEK | 9.3139 | -0.0815 | -0.7471 | -0.7344 | -2.7929 | -1.8577 | -7.3198 | -15.5112 | -9.2329 | 9.5499 | 9.5754 | 10.09 | 34.82 | -0.0637 |
| USD/NOK – U.S. Dollar / Norwegian Krone | USDNOK | 9.8515 | -0.0659 | -1.2490 | -1.6738 | -3.5642 | -0.1946 | -6.7166 | -13.0312 | -7.9938 | 10.14 | 10.16 | 10.59 | 29.33 | -0.0660 |
| USD/DKK – U.S. Dollar / Danish Krone | USDDKK | 6.3594 | -0.0629 | -0.3048 | -0.2181 | -0.7343 | -1.5077 | -6.7281 | -11.2658 | -5.5923 | 6.3991 | 6.4655 | 6.7490 | 47.69 | -0.0110 |
| USD/MXN – U.S. Dollar / Mexican Peso | USDMXN | 18.42 | -0.1193 | -1.0739 | -1.6173 | -2.0092 | -2.6414 | -7.4389 | -10.7051 | -5.6212 | 18.68 | 18.95 | 19.65 | 37.02 | -0.0363 |
| USD/PLN – U.S. Dollar / Polish Zloty | USDPLN | 3.6212 | -0.1186 | -0.2842 | -0.2347 | -0.9139 | -2.0013 | -5.1847 | -11.8301 | -6.3430 | 3.6477 | 3.6869 | 3.8329 | 48.32 | -0.0071 |
| USD/HUF – U.S. Dollar / Hungarian Forint | USDHUF | 332.57 | -0.0340 | -0.9300 | -0.6699 | -1.9410 | -4.4636 | -8.4329 | -15.8075 | -6.7729 | 340.05 | 346.25 | 364.58 | 42.93 | -1.6681 |
| USD/CZK – U.S. Dollar / Czech Koruna | USDCZK | 20.71 | -0.0487 | -0.4092 | -0.3843 | -1.4141 | -3.5223 | -9.3872 | -14.2575 | -8.5660 | 21.02 | 21.38 | 22.50 | 42.28 | -0.0791 |
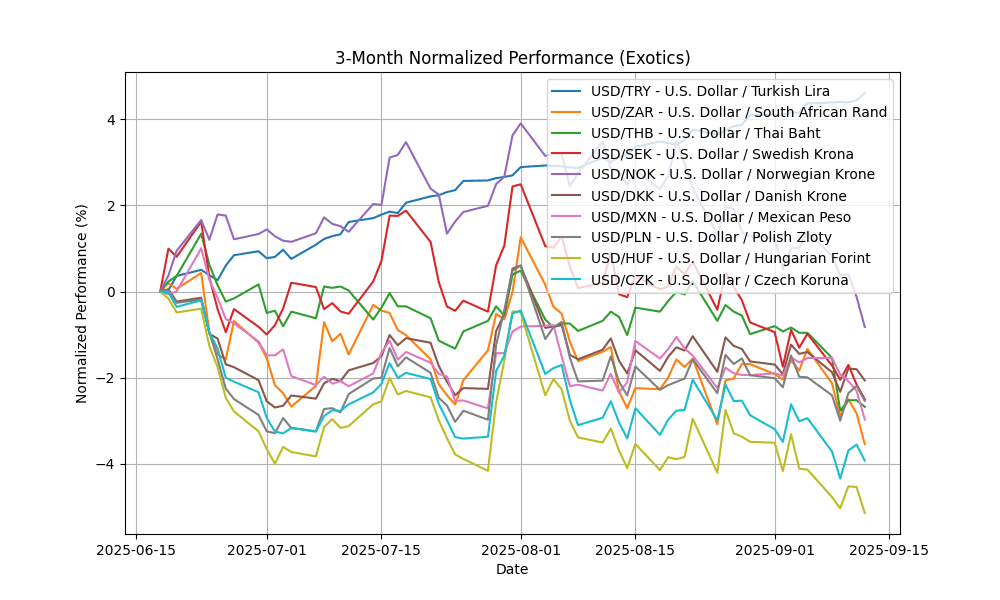
The USD/TRY is significantly overbought with an RSI of 97.12, indicating potential for a corrective pullback, supported by a positive MACD. The moving averages suggest strong upward momentum, but caution is warranted. In contrast, USD/THB, USD/NOK, and USD/SEK are in oversold territory with RSIs below 30, combined with negative MACDs, indicating bearish sentiment and potential for a rebound. The USD/ZAR remains neutral with an RSI of 46.12, reflecting a balanced market. Overall, traders should closely monitor these pairs for potential reversals, especially in the context of current economic fundamentals and geopolitical developments.


