## Forex and Global News
Global markets are closely monitoring developments ahead of the U.S. Federal Reserve’s upcoming interest rate meeting, with traders assessing the implications of various geopolitical events. The EUR/USD pair has shown bullish momentum, trading near 1.1800, its highest since early July, as investors remain optimistic ahead of the Fed’s decisions. Conversely, the USD/JPY has dipped to a one-week low, falling below 147.00, as market sentiment shifts amid central bank expectations.
In commodities, gold prices have paused their upward trajectory as traders look to cash in on gains before the release of crucial U.S. Retail Sales data and the Fed’s policy announcement. Meanwhile, U.S.-China trade talks have generated cautious optimism, impacting market sentiment across currencies.
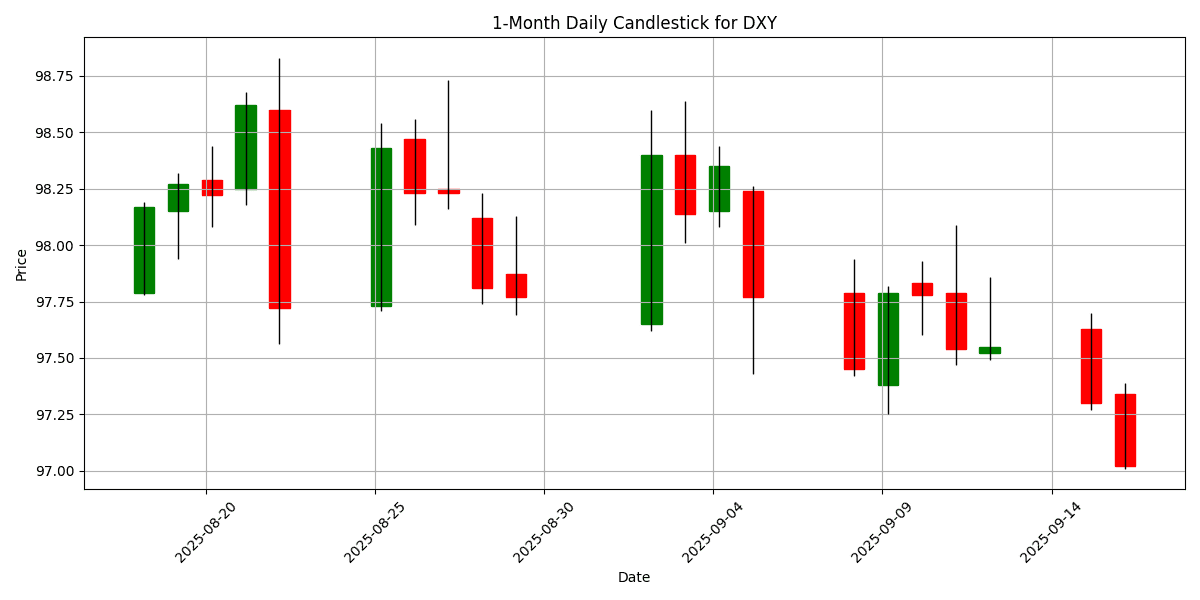
Geopolitical tensions persist, with Israel intensifying its military operations in Gaza and concerns rising in Eastern Poland regarding potential spillover effects from the ongoing conflict in Ukraine. Amidst this backdrop, the DXY index stands at 97.02, reflecting a daily change of -0.1934%.
## Economic Calendar Events Today
All times are in US Eastern Time (New York).
| Date | Time | Cur | Imp | Event | Actual | Forecast |
|---|---|---|---|---|---|---|
| 2025-09-16 | 02:00 | 🇬🇧 | Medium | Average Earnings Index +Bonus (Jul) | 4.7% | 4.7% |
| 2025-09-16 | 02:00 | 🇬🇧 | Medium | Claimant Count Change (Aug) | 17.4K | 15.3K |
| 2025-09-16 | 02:00 | 🇬🇧 | Medium | Employment Change 3M/3M (MoM) (Jul) | 232K | 220K |
| 2025-09-16 | 02:00 | 🇬🇧 | Medium | Unemployment Rate (Jul) | 4.7% | 4.7% |
| 2025-09-16 | 05:00 | 🇪🇺 | Medium | German ZEW Current Conditions (Sep) | -76.4 | -75.0 |
| 2025-09-16 | 05:00 | 🇪🇺 | Medium | German ZEW Economic Sentiment (Sep) | 37.3 | 25.3 |
| 2025-09-16 | 05:00 | 🇪🇺 | Medium | Wages in euro zone (YoY) (Q2) | 3.70% | 3.70% |
| 2025-09-16 | 05:00 | 🇪🇺 | Medium | Industrial Production (MoM) (Jul) | 0.3% | 0.4% |
| 2025-09-16 | 05:00 | 🇪🇺 | Medium | ZEW Economic Sentiment (Sep) | 26.1 | 20.3 |
| 2025-09-16 | 08:00 | 🇪🇺 | Medium | German Buba Vice President Buch Speaks | ||
| 2025-09-16 | 08:00 | 🇧🇷 | Medium | Unemployment Rate (Jul) | 5.7% | |
| 2025-09-16 | 08:15 | 🇨🇦 | Medium | Housing Starts (Aug) | 278.0K | |
| 2025-09-16 | 08:30 | 🇺🇸 | High | Core Retail Sales (MoM) (Aug) | 0.4% | |
| 2025-09-16 | 08:30 | 🇺🇸 | Medium | Export Price Index (MoM) (Aug) | -0.1% | |
| 2025-09-16 | 08:30 | 🇺🇸 | Medium | Import Price Index (MoM) (Aug) | -0.2% | |
| 2025-09-16 | 08:30 | 🇺🇸 | Medium | Retail Control (MoM) (Aug) | 0.4% | |
| 2025-09-16 | 08:30 | 🇺🇸 | High | Retail Sales (MoM) (Aug) | 0.2% | |
| 2025-09-16 | 08:30 | 🇨🇦 | Medium | Core CPI (MoM) (Aug) | ||
| 2025-09-16 | 08:30 | 🇨🇦 | Medium | Core CPI (YoY) (Aug) | ||
| 2025-09-16 | 08:30 | 🇨🇦 | Medium | CPI (MoM) (Aug) | 0.0% | |
| 2025-09-16 | 09:15 | 🇺🇸 | Medium | Industrial Production (MoM) (Aug) | 0.0% | |
| 2025-09-16 | 09:15 | 🇺🇸 | Medium | Industrial Production (YoY) (Aug) | ||
| 2025-09-16 | 10:00 | 🇺🇸 | Medium | Business Inventories (MoM) (Jul) | 0.2% | |
| 2025-09-16 | 10:00 | 🇺🇸 | Medium | Retail Inventories Ex Auto (Jul) | -0.1% | |
| 2025-09-16 | 12:30 | 🇺🇸 | Medium | Atlanta Fed GDPNow (Q3) | 3.1% | |
| 2025-09-16 | 13:00 | 🇺🇸 | Medium | 20-Year Bond Auction | ||
| 2025-09-16 | 16:30 | 🇺🇸 | Medium | API Weekly Crude Oil Stock | ||
| 2025-09-16 | 17:00 | 🇳🇿 | Medium | Westpac Consumer Sentiment (Q3) | ||
| 2025-09-16 | 18:45 | 🇳🇿 | Medium | Current Account (QoQ) (Q2) | -2.67B | |
| 2025-09-16 | 18:45 | 🇳🇿 | Medium | Current Account (YoY) (Q2) | ||
| 2025-09-16 | 19:50 | 🇯🇵 | Medium | Adjusted Trade Balance | -0.36T | |
| 2025-09-16 | 19:50 | 🇯🇵 | Medium | Exports (YoY) (Aug) | -1.9% | |
| 2025-09-16 | 19:50 | 🇯🇵 | Medium | Trade Balance (Aug) | -513.6B |
On September 16, 2025, key economic events influenced the FX markets, particularly concerning the GBP and EUR.
For the GBP, the labor market data released at 02:00 ET showed the Average Earnings Index +Bonus aligned with expectations at 4.7%. However, the Claimant Count Change surprised to the upside at 17.4K, exceeding the forecast of 15.3K, while Employment Change also outperformed, recording 232K against a forecast of 220K. The Unemployment Rate remained stable at 4.7%. These mixed results suggest a resilient labor market, potentially supporting the GBP against major currencies.
In the Eurozone, the German ZEW Economic Sentiment significantly exceeded expectations at 37.3, compared to a forecast of 25.3, signaling improved economic outlook, which may bolster the EUR. However, the ZEW Current Conditions fell short at -76.4, indicating ongoing concerns about the current economic environment. Industrial Production also slightly missed forecasts at 0.3%. Overall, the mixed data could lead to volatility in the EUR/USD pair.
In the USD sector, significant figures such as Core Retail Sales and Retail Sales are due at 08:30 ET, with expectations of 0.4% and 0.2%, respectively, which could further influence USD valuations.
## Major FX Group
| Name | Symbol | Price | Daily (%) | 5D (%) | 1W (%) | 1M (%) | 3M (%) | 6M (%) | YTD (%) | 12M (%) | MA50 | MA100 | MA200 | RSI | MACD |
|---|---|---|---|---|---|---|---|---|---|---|---|---|---|---|---|
| EUR/USD – Euro / U.S. Dollar | EURUSD | 1.1818 | 0.4334 | 0.9789 | 0.4152 | 1.4303 | 2.9206 | 8.3037 | 13.57 | 6.5794 | 1.1664 | 1.1552 | 1.1093 | 68.02 | 0.0029 |
| USD/JPY – U.S. Dollar / Japanese Yen | USDJPY | 146.91 | -0.3257 | -0.2885 | -0.3101 | -0.5308 | 1.0531 | -1.0661 | -6.4257 | 4.3448 | 147.62 | 146.07 | 148.77 | 45.24 | -0.0166 |
| GBP/USD – British Pound / U.S. Dollar | GBPUSD | 1.3640 | 0.2646 | 0.7778 | 0.6414 | 0.8078 | 1.5634 | 4.8370 | 8.6931 | 3.8210 | 1.3467 | 1.3473 | 1.3086 | 63.13 | 0.0030 |
| USD/CHF – U.S. Dollar / Swiss Franc | USDCHF | 0.7912 | -0.4404 | -0.9353 | -0.2031 | -2.0210 | -3.1425 | -9.7216 | -12.4042 | -6.6651 | 0.8020 | 0.8104 | 0.8485 | 33.83 | -0.0026 |
| AUD/USD – Australian Dollar / U.S. Dollar | AUDUSD | 0.6672 | -0.0150 | 0.7959 | 1.1202 | 2.6854 | 2.9662 | 4.8378 | 7.2669 | -0.6226 | 0.6530 | 0.6504 | 0.6393 | 74.32 | 0.0038 |
| USD/CAD – U.S. Dollar / Canadian Dollar | USDCAD | 1.3768 | -0.0581 | -0.6674 | -0.1957 | -0.3265 | 0.6168 | -3.8480 | -4.0544 | 1.4016 | 1.3766 | 1.3761 | 1.4019 | 41.78 | 0.0012 |
| NZD/USD – New Zealand Dollar / U.S. Dollar | NZDUSD | 0.5977 | 0.1005 | 0.5588 | 0.5367 | 0.9444 | -0.7041 | 2.6693 | 5.9806 | -3.0351 | 0.5934 | 0.5963 | 0.5836 | 66.71 | 0.0008 |
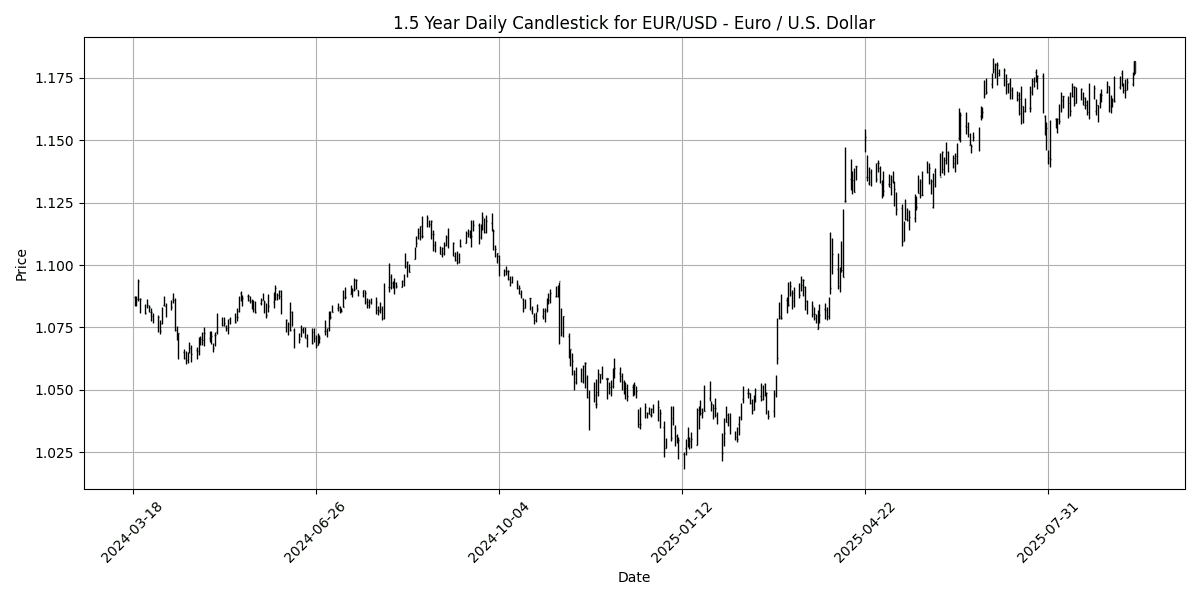
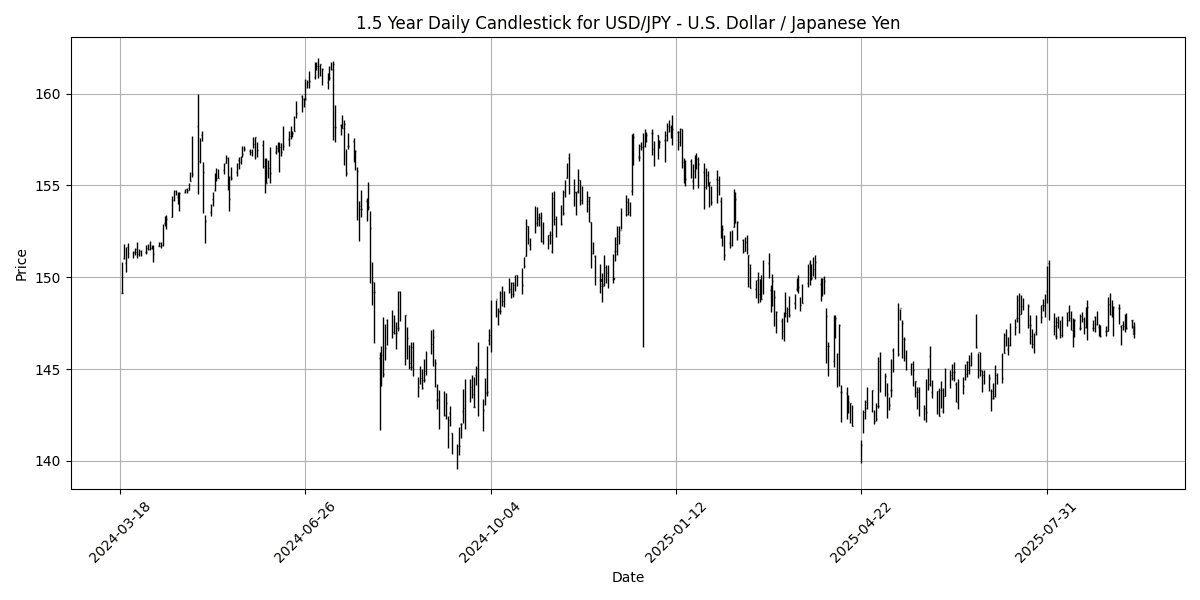
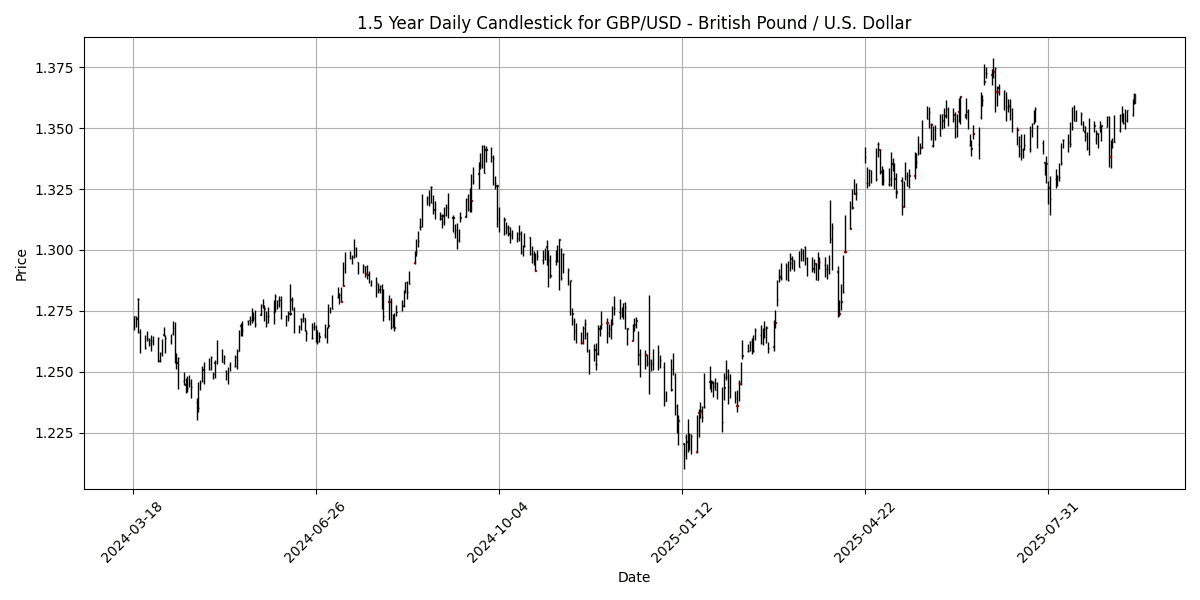
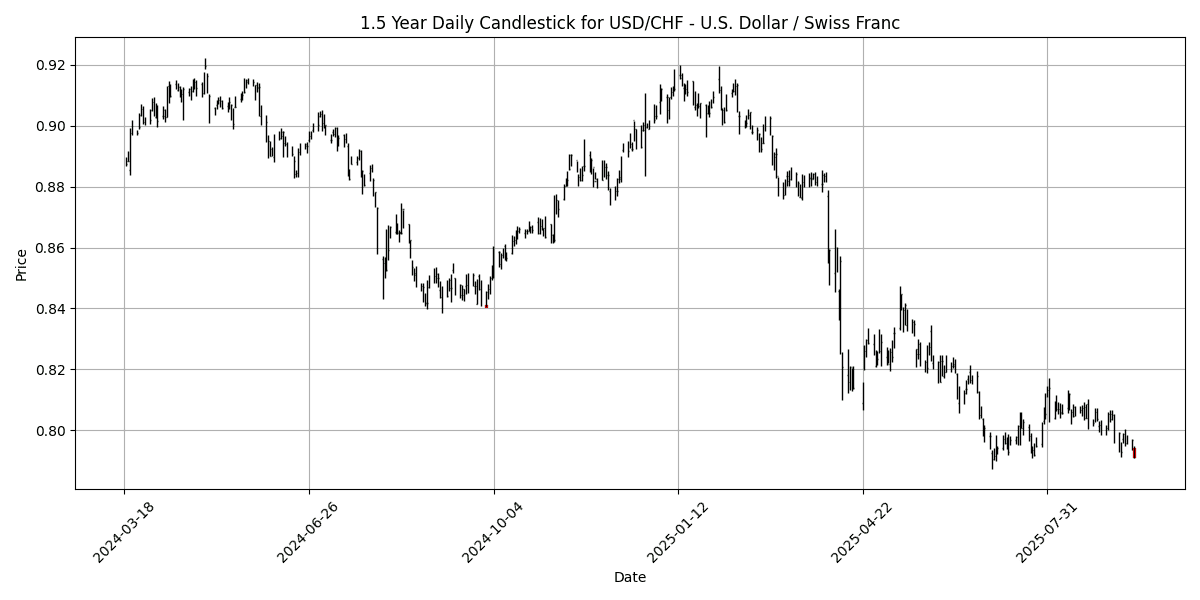
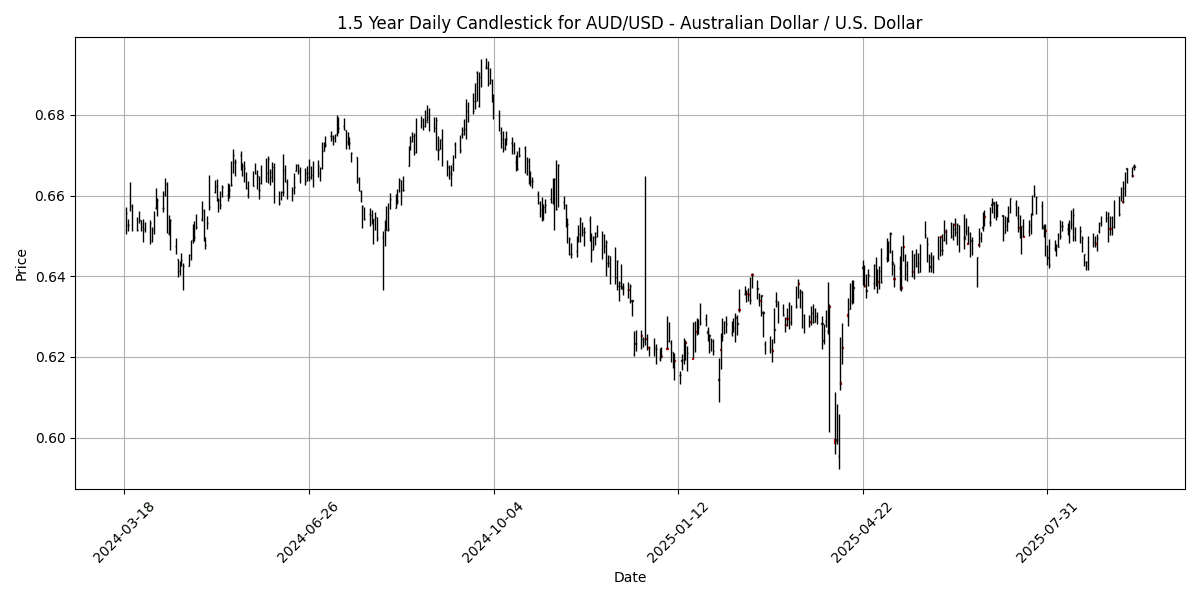
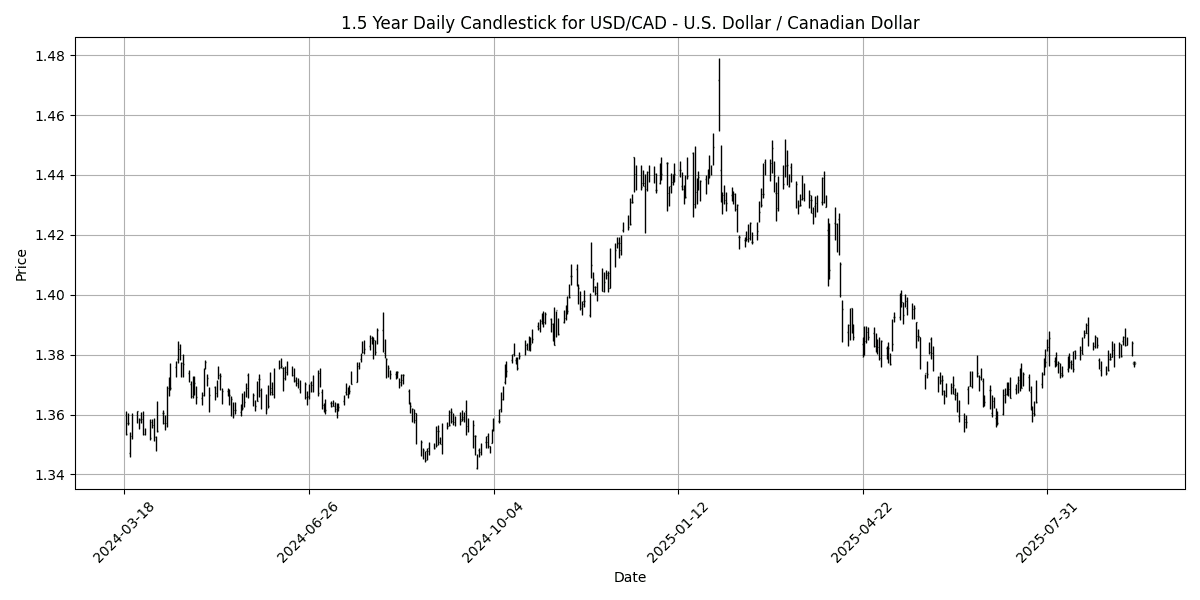

In the current forex landscape, several key pairs exhibit notable overbought and oversold conditions based on RSI, MACD, and moving average crossovers.
The AUD/USD is in an overbought territory with an RSI of 74.32, suggesting potential for a price correction. The positive MACD reinforces this bullish momentum, though traders should remain cautious of a reversal. Conversely, the USD/CHF is significantly oversold with an RSI of 33.83 and a negative MACD, indicating a bearish trend. This may present a buying opportunity if a reversal occurs.
EUR/USD is approaching overbought territory with an RSI of 68.02, while its MACD remains positive, suggesting bullish sentiment but caution is warranted. The GBP/USD also shows strength with an RSI of 63.13 but is not yet in overbought territory.
Overall, the market is mixed, with AUD/USD and USD/CHF being the primary focus for potential trading strategies based on their respective conditions
## Cross FX Group
| Name | Symbol | Price | Daily (%) | 5D (%) | 1W (%) | 1M (%) | 3M (%) | 6M (%) | YTD (%) | 12M (%) | MA50 | MA100 | MA200 | RSI | MACD |
|---|---|---|---|---|---|---|---|---|---|---|---|---|---|---|---|
| EUR/GBP | EURGBP | 0.8661 | 0.1735 | 0.1665 | -0.2568 | 0.5888 | 1.3125 | 3.2780 | 4.4513 | 2.6100 | 0.8661 | 0.8573 | 0.8473 | 56.88 | 0.0002 |
| EUR/JPY | EURJPY | 173.57 | 0.1188 | 0.6588 | 0.0830 | 0.8741 | 3.9920 | 7.1444 | 6.2355 | 11.18 | 172.17 | 168.74 | 164.83 | 68.03 | 0.4084 |
| EUR/CHF | EURCHF | 0.9348 | 0.0107 | 0.0171 | 0.1919 | -0.6483 | -0.3326 | -2.2585 | -0.5426 | -0.5786 | 0.9354 | 0.9359 | 0.9390 | 48.02 | -0.0007 |
| EUR/AUD | EURAUD | 1.7712 | 0.4480 | 0.1810 | -0.6941 | -1.2175 | -0.0429 | 3.3071 | 5.8570 | 7.2473 | 1.7862 | 1.7761 | 1.7345 | 31.26 | -0.0059 |
| GBP/JPY | GBPJPY | 200.39 | -0.0598 | 0.4935 | 0.3400 | 0.2843 | 2.6478 | 3.7301 | 1.7208 | 8.3652 | 198.77 | 196.80 | 194.50 | 65.07 | 0.4192 |
| GBP/CHF | GBPCHF | 1.0792 | -0.1757 | -0.1527 | 0.4486 | -1.2219 | -1.6172 | -5.3416 | -4.7779 | -3.0804 | 1.0799 | 1.0917 | 1.1084 | 43.91 | -0.0012 |
| AUD/JPY | AUDJPY | 97.99 | -0.3306 | 0.4799 | 0.7869 | 2.1187 | 4.0312 | 3.7075 | 0.3739 | 3.6702 | 96.38 | 94.99 | 95.05 | 84.87 | 0.5468 |
| AUD/NZD | AUDNZD | 1.1162 | -0.0985 | 0.2362 | 0.5776 | 1.7215 | 3.6754 | 2.1161 | 1.2247 | 2.4883 | 1.1003 | 1.0907 | 1.0954 | 67.96 | 0.0048 |
| CHF/JPY | CHFJPY | 185.68 | 0.1192 | 0.6563 | -0.0972 | 1.5378 | 4.3464 | 9.6224 | 6.8356 | 11.84 | 184.04 | 180.27 | 175.55 | 65.59 | 0.5842 |
| NZD/JPY | NZDJPY | 87.78 | -0.2126 | 0.2753 | 0.2204 | 0.4049 | 0.3682 | 1.5737 | -0.8393 | 1.1593 | 87.58 | 87.07 | 86.76 | 74.07 | 0.1154 |
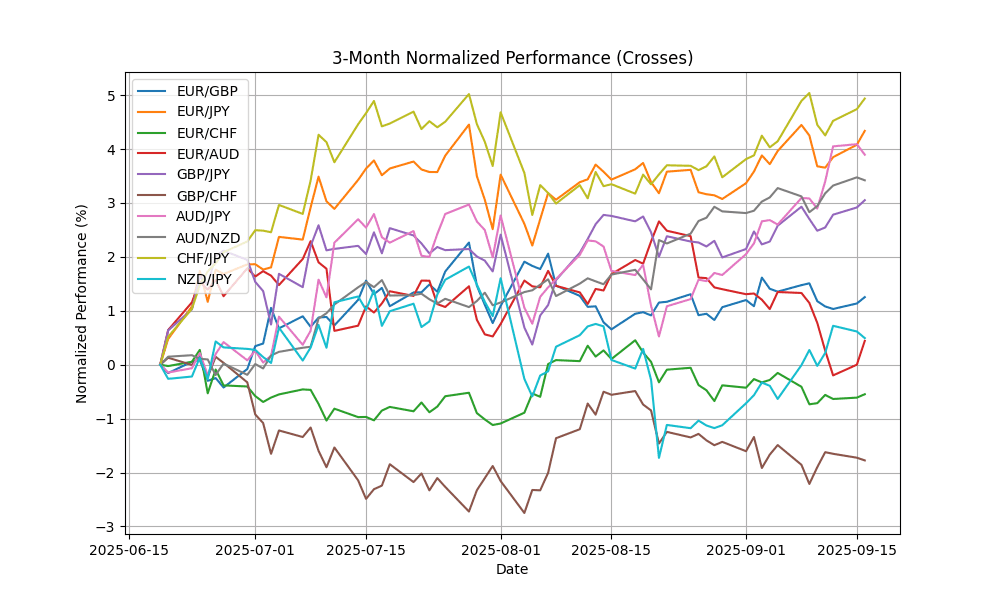
In the current analysis of key FX pairs, AUD/JPY is significantly overbought with an RSI of 84.87, suggesting potential for a corrective pullback. Similarly, NZD/JPY at 74.07 is approaching overbought territory, indicating caution. EUR/JPY, while close to overbought at 68.03, shows bullish momentum with a positive MACD. Conversely, EUR/AUD is oversold at 31.26, accompanied by a bearish MACD, indicating potential buying opportunities. Other pairs like GBP/JPY and CHF/JPY are in neutral territory, suggesting stability. Overall, traders should monitor these indicators closely for potential reversals or continuations in trend.
## Exotics and Emerging
| Name | Symbol | Price | Daily (%) | 5D (%) | 1W (%) | 1M (%) | 3M (%) | 6M (%) | YTD (%) | 12M (%) | MA50 | MA100 | MA200 | RSI | MACD |
|---|---|---|---|---|---|---|---|---|---|---|---|---|---|---|---|
| USD/TRY – U.S. Dollar / Turkish Lira | USDTRY | 41.31 | 0.0404 | 0.0732 | 0.1071 | 1.1230 | 4.5158 | 8.7184 | 17.00 | 21.65 | 40.77 | 39.98 | 38.19 | 81.87 | 0.1669 |
| USD/ZAR – U.S. Dollar / South African Rand | USDZAR | 17.36 | 0.1350 | -0.6404 | -0.5699 | -1.2368 | -3.4520 | -4.0697 | -7.4714 | -2.0465 | 17.69 | 17.82 | 18.14 | 35.61 | -0.0834 |
| USD/THB – U.S. Dollar / Thai Baht | USDTHB | 31.66 | -0.2835 | -0.3149 | -0.0631 | -2.4646 | -2.8298 | -5.6334 | -7.2615 | -4.7046 | 32.32 | 32.55 | 33.25 | 16.67 | -0.1946 |
| USD/SEK – U.S. Dollar / Swedish Krona | USDSEK | 9.2503 | -0.2405 | -0.9682 | -1.0782 | -3.4567 | -3.1055 | -8.3006 | -16.0882 | -9.4109 | 9.5401 | 9.5684 | 10.07 | 25.77 | -0.0723 |
| USD/NOK – U.S. Dollar / Norwegian Krone | USDNOK | 9.8259 | 0.0143 | -0.9865 | -1.4799 | -3.8148 | -1.1081 | -6.8856 | -13.2572 | -7.4673 | 10.13 | 10.15 | 10.58 | 19.12 | -0.0792 |
| USD/DKK – U.S. Dollar / Danish Krone | USDDKK | 6.3178 | -0.4271 | -0.9408 | -0.4091 | -1.3836 | -2.7277 | -7.5791 | -11.8463 | -6.1109 | 6.3989 | 6.4611 | 6.7414 | 32.24 | -0.0155 |
| USD/MXN – U.S. Dollar / Mexican Peso | USDMXN | 18.35 | -0.0414 | -1.2561 | -1.6377 | -2.4140 | -3.5333 | -8.3693 | -11.0740 | -4.2021 | 18.67 | 18.93 | 19.63 | 20.55 | -0.0653 |
| USD/PLN – U.S. Dollar / Polish Zloty | USDPLN | 3.5969 | -0.3629 | -1.1258 | -0.3021 | -1.5788 | -3.2909 | -6.1534 | -12.4218 | -6.7934 | 3.6483 | 3.6856 | 3.8306 | 38.56 | -0.0074 |
| USD/HUF – U.S. Dollar / Hungarian Forint | USDHUF | 329.83 | -0.3327 | -1.7278 | -1.2160 | -2.7480 | -6.1888 | -9.4719 | -16.5004 | -7.3745 | 339.73 | 345.75 | 363.96 | 24.30 | -2.1794 |
| USD/CZK – U.S. Dollar / Czech Koruna | USDCZK | 20.58 | -0.4518 | -1.1878 | -0.3718 | -2.0443 | -4.6978 | -10.0683 | -14.8056 | -9.1345 | 21.01 | 21.35 | 22.47 | 30.87 | -0.0982 |
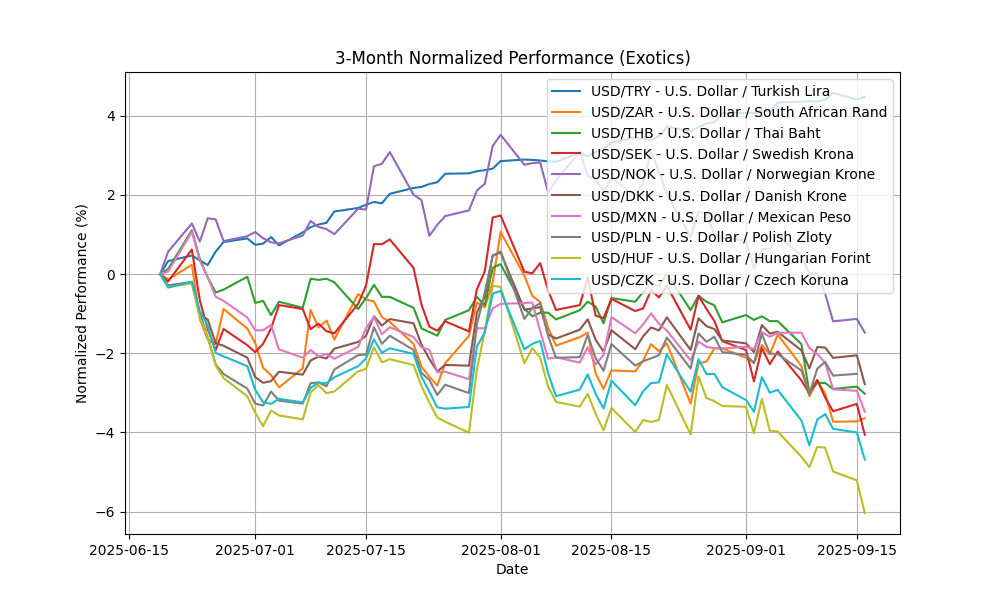
In the current analysis of the selected FX pairs, USD/TRY is significantly overbought with an RSI of 81.87, suggesting potential price corrections. The positive MACD indicates bullish momentum, but caution is warranted as the price may be due for a pullback. Conversely, USD/ZAR, USD/THB, USD/SEK, and USD/NOK exhibit oversold conditions, with RSIs below 30, indicating potential buying opportunities. Their negative MACDs further confirm bearish trends. The moving averages reflect a bearish sentiment across these pairs, particularly USD/NOK and USD/THB, where MA crossovers suggest sustained downward pressure. Traders should consider these technical indicators in their strategies.


