## Forex and Global News
In today’s forex market, the British pound (GBP) showed strength against the U.S. dollar (USD), pushing towards 1.3600 as bullish sentiment persisted despite overbought conditions. The Australian dollar (AUD) also advanced, reaching its highest level since late July, trading above 0.6600 ahead of important U.S. Nonfarm Payrolls revisions and inflation data. Conversely, the euro (EUR) experienced consolidation around 1.1750 after briefly touching 1.1780, as traders awaited key economic indicators.
Geopolitical tensions influenced market sentiment, particularly with Israel’s order for a full evacuation of Gaza City amid escalating conflict, drawing international scrutiny. Additionally, the political landscape in France worsened with the resignation of another prime minister, which may further impact the eurozone’s stability.
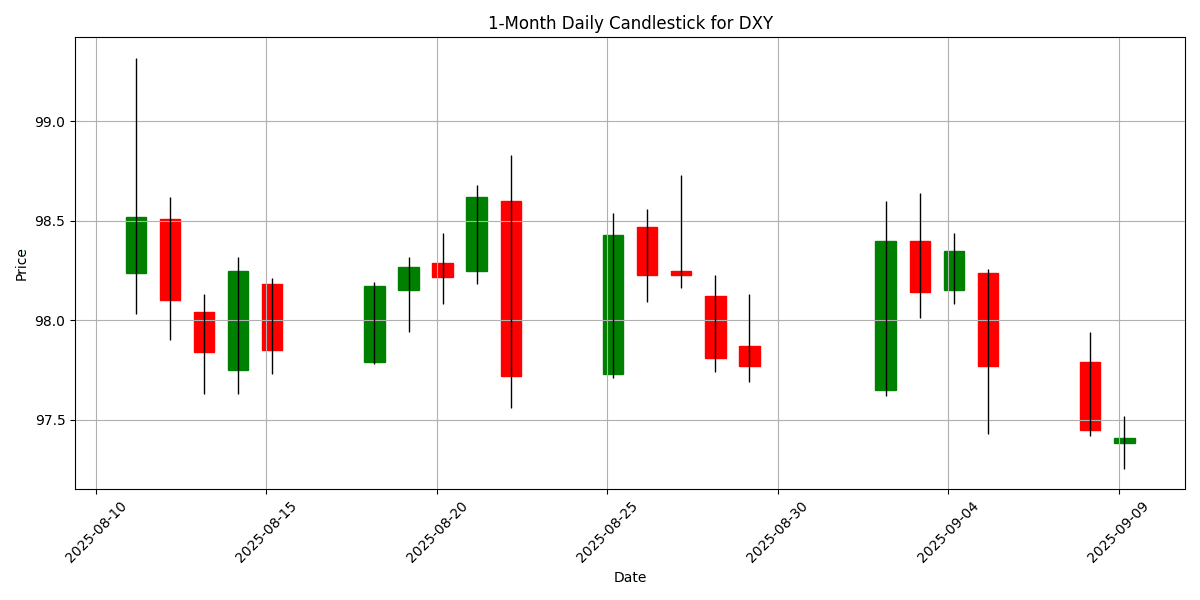
In commodities, gold (XAU/USD) continued its upward trajectory, testing levels above $3,650, supported by a bearish USD sentiment. The U.S. Dollar Index (DXY) traded at 97.41, reflecting a slight daily decline of -0.0164%. Overall, the market remains cautious ahead of critical economic releases.
## Economic Calendar Events Today
All times are in US Eastern Time (New York).
| Date | Time | Cur | Imp | Event | Actual | Forecast |
|---|---|---|---|---|---|---|
| 2025-09-09 | 05:30 | 🇿🇦 | Medium | GDP Annualized (QoQ) (Q2) | 0.8% | 0.5% |
| 2025-09-09 | 05:45 | 🇪🇺 | Medium | German 10-Year Bund Auction | 2.250% | |
| 2025-09-09 | 06:00 | 🇪🇺 | Medium | Eurogroup Meetings | ||
| 2025-09-09 | 07:30 | 🇪🇺 | Medium | German Buba President Nagel Speaks | ||
| 2025-09-09 | 10:00 | 🇺🇸 | Medium | Payrolls Benchmark, n.s.a. | ||
| 2025-09-09 | 12:00 | 🇺🇸 | Medium | EIA Short-Term Energy Outlook | ||
| 2025-09-09 | 13:00 | 🇺🇸 | Medium | 3-Year Note Auction | ||
| 2025-09-09 | 16:30 | 🇺🇸 | Medium | API Weekly Crude Oil Stock | ||
| 2025-09-09 | 21:30 | 🇨🇳 | Medium | CPI (MoM) (Aug) | 0.1% | |
| 2025-09-09 | 21:30 | 🇨🇳 | Medium | CPI (YoY) (Aug) | -0.2% | |
| 2025-09-09 | 21:30 | 🇨🇳 | Medium | PPI (YoY) (Aug) | -2.9% |
On September 9, 2025, several economic events are poised to influence FX markets significantly.
The South African Rand (ZAR) received a boost as Q2 GDP Annualized (QoQ) was reported at 0.8%, exceeding expectations of 0.5%. This positive surprise could strengthen the ZAR against major currencies as it indicates resilience in the South African economy.
In the Eurozone, the German 10-Year Bund Auction yielded 2.250%. While no forecast was provided, market participants will be closely watching the demand for German debt, which could impact the Euro (EUR) if the auction results are perceived as weak.
The Eurogroup Meetings and remarks from German Bundesbank President Nagel, scheduled for this morning, may also provide insights into Eurozone monetary policy direction, potentially influencing the EUR.
In the U.S., the Payrolls Benchmark and EIA Short-Term Energy Outlook are set for release, with expectations around labor market dynamics and energy prices that could affect the US Dollar (USD).
Later in the day, China’s CPI and PPI figures are crucial, with CPI expected at -0.2% YoY, which may further pressure the Chinese Yuan (CNY) if deflationary trends persist.
Overall, these events will likely create volatility in the FX markets, particularly for the ZAR and EUR, while the USD and CNY are also in focus.
## Major FX Group
| Name | Symbol | Price | Daily (%) | 5D (%) | 1W (%) | 1M (%) | 3M (%) | 6M (%) | YTD (%) | 12M (%) | MA50 | MA100 | MA200 | RSI | MACD |
|---|---|---|---|---|---|---|---|---|---|---|---|---|---|---|---|
| EUR/USD – Euro / U.S. Dollar | EURUSD | 1.1751 | -0.1360 | 0.7766 | 0.2995 | 0.6367 | 2.7413 | 7.9435 | 12.92 | 5.9870 | 1.1668 | 1.1533 | 1.1063 | 60.13 | 0.0017 |
| USD/JPY – U.S. Dollar / Japanese Yen | USDJPY | 146.58 | -0.5590 | -0.9454 | -0.3420 | -0.1743 | 1.2034 | -1.1451 | -6.6333 | 2.8740 | 147.31 | 145.85 | 148.83 | 43.49 | 0.0898 |
| GBP/USD – British Pound / U.S. Dollar | GBPUSD | 1.3570 | 0.1402 | 0.9554 | 0.1629 | 0.8807 | 0.4574 | 4.6722 | 8.1353 | 3.3247 | 1.3477 | 1.3461 | 1.3064 | 56.15 | 0.0010 |
| USD/CHF – U.S. Dollar / Swiss Franc | USDCHF | 0.7937 | 0.0630 | -1.2565 | -0.8061 | -1.4882 | -3.4334 | -9.9879 | -12.1275 | -5.9530 | 0.8018 | 0.8120 | 0.8507 | 34.04 | -0.0014 |
| AUD/USD – Australian Dollar / U.S. Dollar | AUDUSD | 0.6613 | 0.2273 | 1.0482 | 0.8571 | 1.3376 | 1.3145 | 4.5105 | 6.3183 | -0.8665 | 0.6523 | 0.6491 | 0.6389 | 72.88 | 0.0015 |
| USD/CAD – U.S. Dollar / Canadian Dollar | USDCAD | 1.3808 | 0.0580 | 0.1080 | 0.4408 | 0.5498 | 1.0221 | -3.8554 | -3.7757 | 1.8131 | 1.3745 | 1.3763 | 1.4024 | 42.40 | 0.0012 |
| NZD/USD – New Zealand Dollar / U.S. Dollar | NZDUSD | 0.5953 | 0.1683 | 1.2224 | 0.7908 | -0.2867 | -1.7511 | 3.7650 | 5.5550 | -3.5376 | 0.5946 | 0.5963 | 0.5835 | 57.10 | -0.0013 |
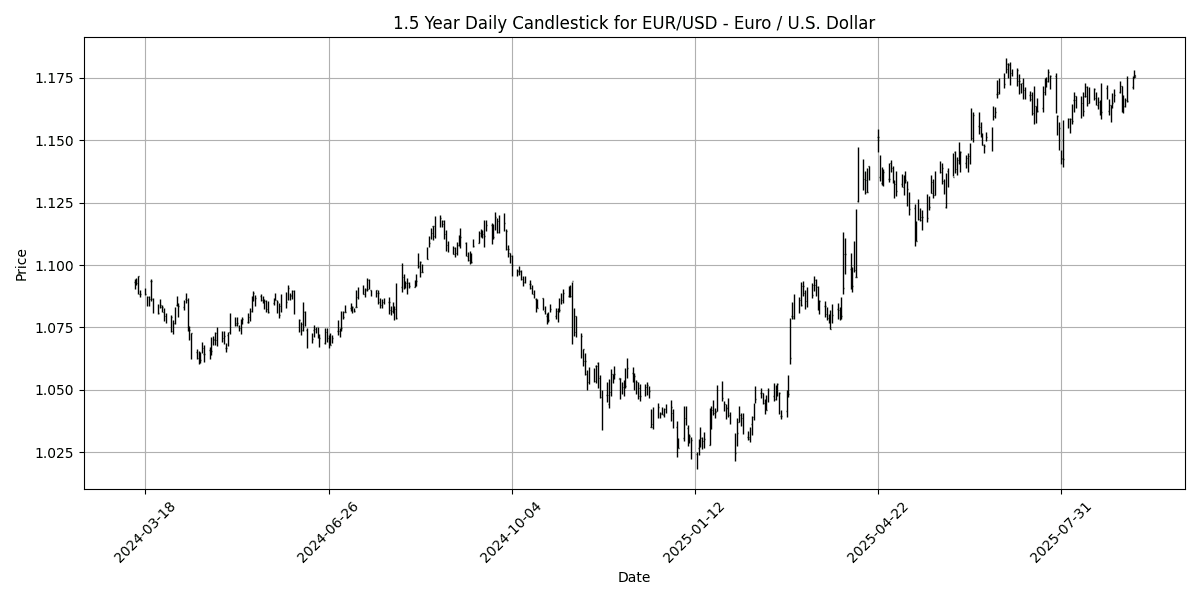
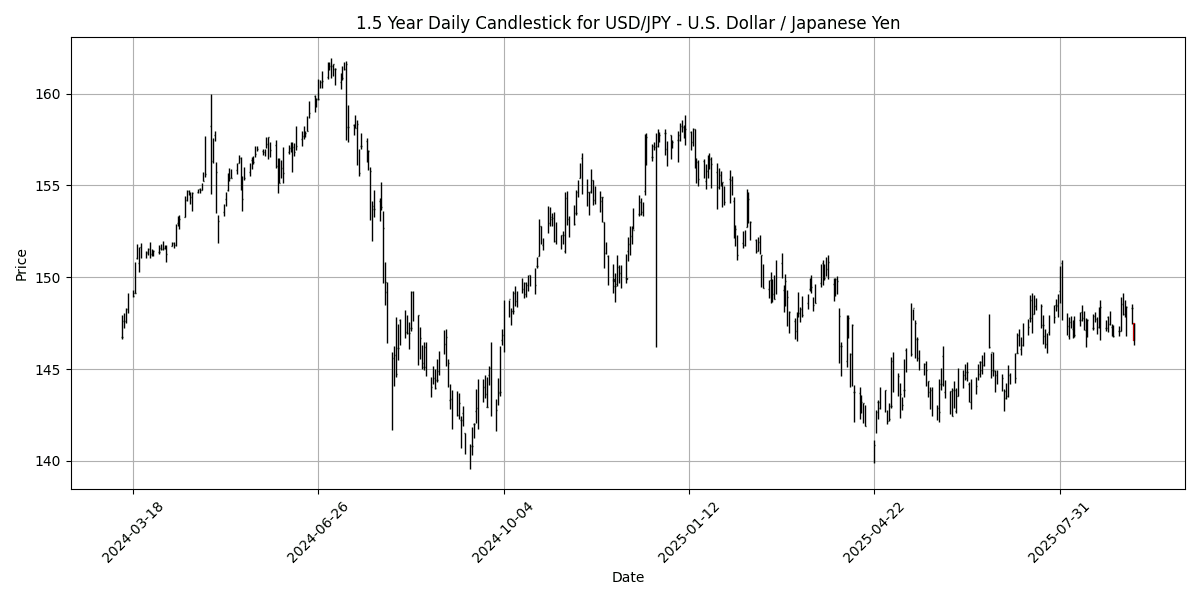
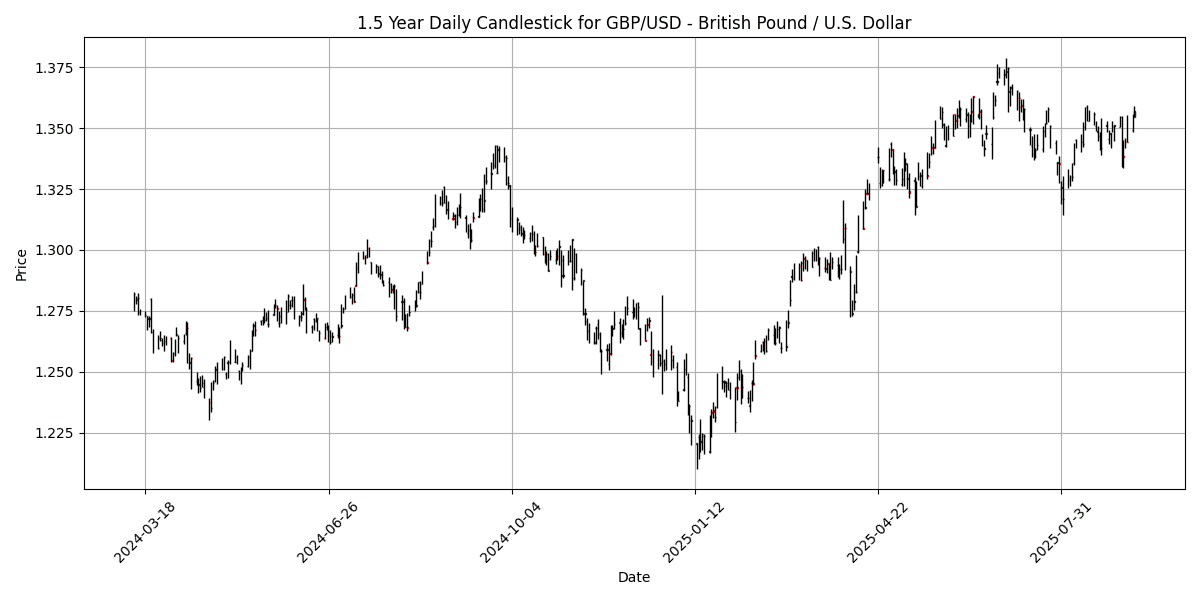
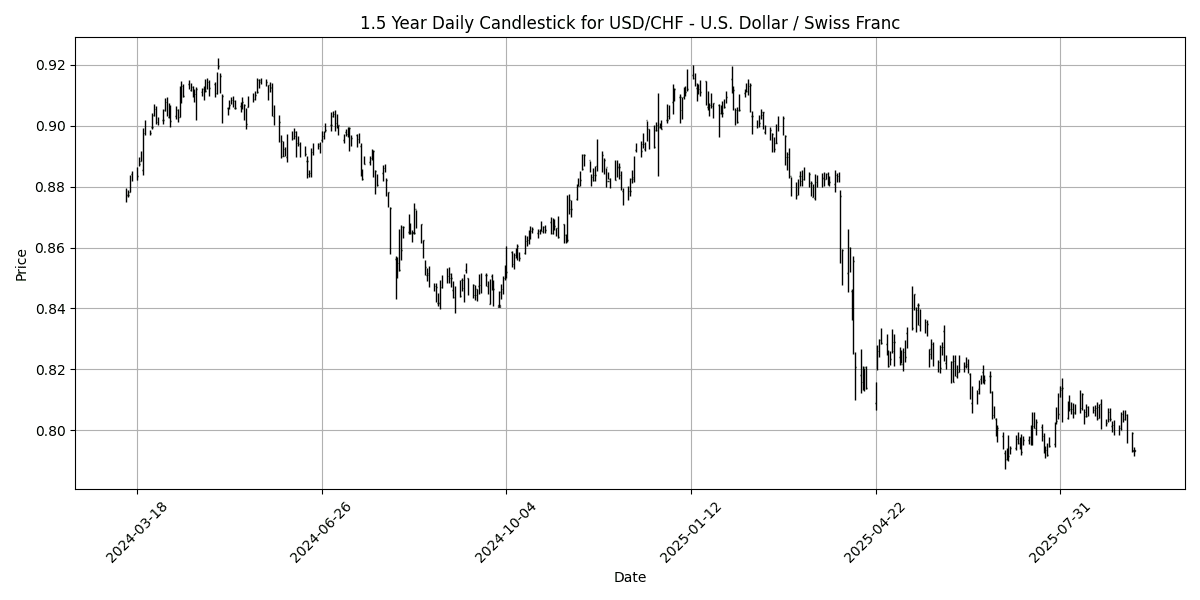
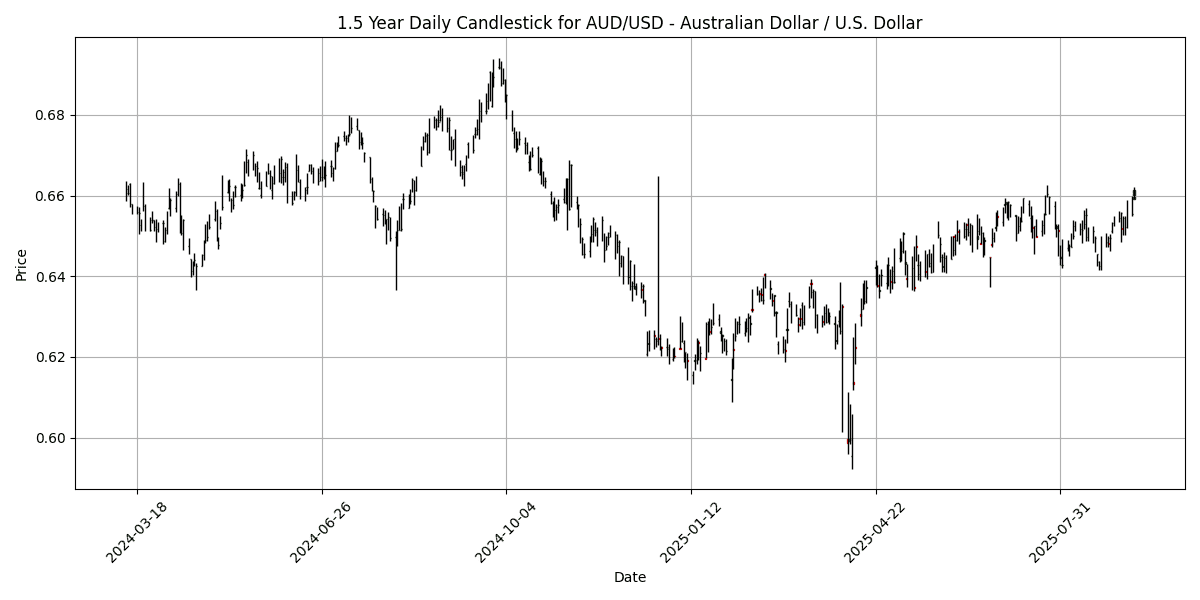
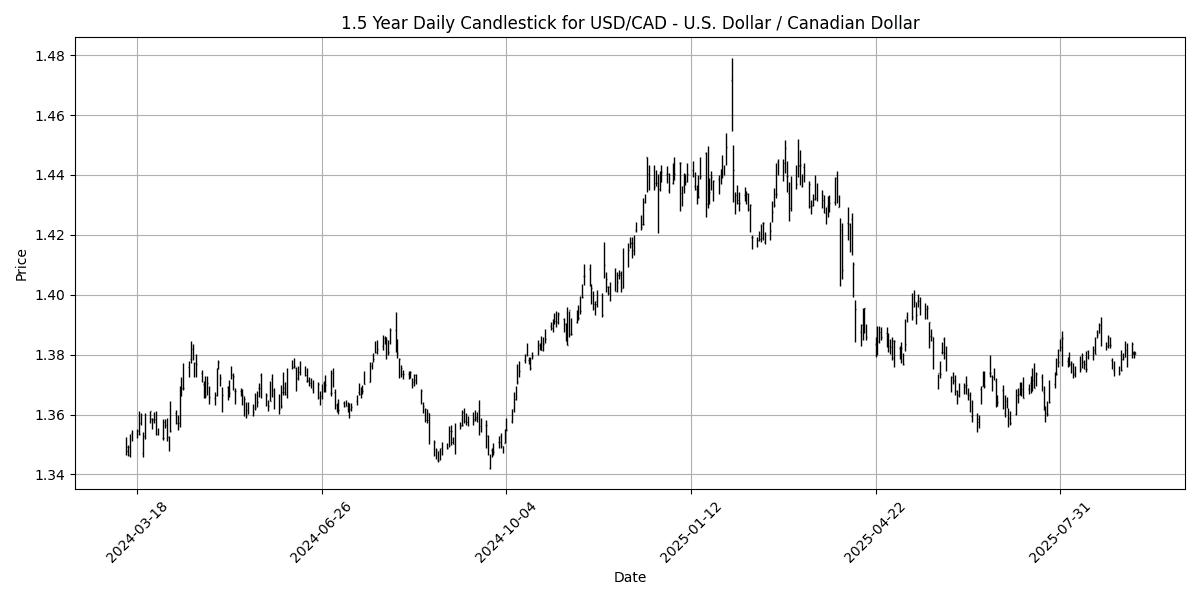
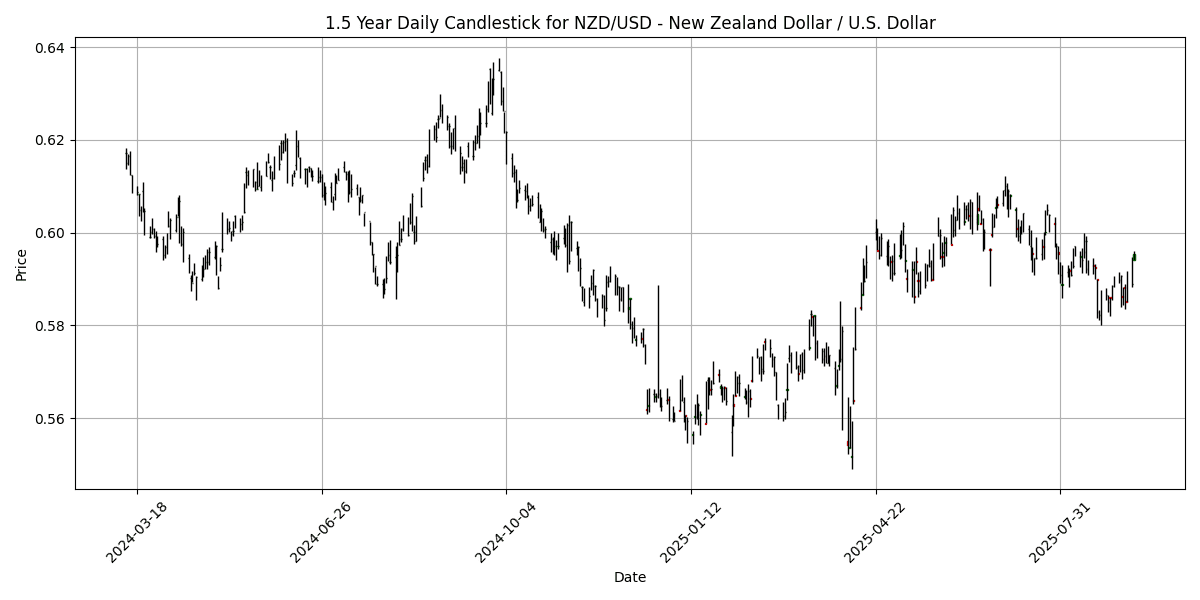
In the current forex landscape, several key pairs exhibit notable overbought and oversold conditions. The AUD/USD is approaching overbought territory with an RSI of 72.88, indicating potential for a corrective pullback, especially as the MACD remains positive. Conversely, the USD/CHF, with an RSI of 34.04 and a negative MACD, suggests it is in oversold conditions, presenting a potential buying opportunity if momentum shifts.
The EUR/USD and GBP/USD pairs show neutral RSI readings (60.13 and 56.15, respectively) with positive MACD values, indicating stable bullish momentum without immediate overbought concerns. The USD/JPY and USD/CAD are also in neutral territory, albeit closer to bearish signals given their lower RSI readings of 43.49 and 42.40, respectively.
Traders should monitor these indicators closely for potential reversals or continuations in trends, particularly in the AUD/USD and USD/CHF pairs.
## Cross FX Group
| Name | Symbol | Price | Daily (%) | 5D (%) | 1W (%) | 1M (%) | 3M (%) | 6M (%) | YTD (%) | 12M (%) | MA50 | MA100 | MA200 | RSI | MACD |
|---|---|---|---|---|---|---|---|---|---|---|---|---|---|---|---|
| EUR/GBP | EURGBP | 0.8657 | -0.2650 | -0.2029 | 0.1156 | -0.2604 | 2.2488 | 3.1025 | 4.4031 | 2.5492 | 0.8657 | 0.8567 | 0.8464 | 55.49 | 0.0006 |
| EUR/JPY | EURJPY | 172.21 | -0.6748 | -0.1959 | -0.0633 | 0.4433 | 3.9702 | 6.6924 | 5.4001 | 9.0117 | 171.87 | 168.20 | 164.46 | 51.70 | 0.3540 |
| EUR/CHF | EURCHF | 0.9324 | -0.0536 | -0.5175 | -0.5334 | -0.8834 | -0.8170 | -2.8598 | -0.7980 | -0.3495 | 0.9355 | 0.9361 | 0.9389 | 36.90 | 0.0001 |
| EUR/AUD | EURAUD | 1.7770 | -0.3589 | -0.2576 | -0.5423 | -0.6813 | 1.4183 | 3.2959 | 6.2037 | 6.9200 | 1.7888 | 1.7765 | 1.7309 | 24.10 | -0.0016 |
| GBP/JPY | GBPJPY | 198.92 | -0.3996 | 0.0121 | -0.1706 | 0.7159 | 1.6916 | 3.4867 | 0.9756 | 6.3106 | 198.51 | 196.32 | 194.26 | 47.69 | 0.2757 |
| GBP/CHF | GBPCHF | 1.0769 | 0.2047 | -0.3203 | -0.6495 | -0.6275 | -3.0047 | -5.7888 | -4.9808 | -2.8288 | 1.0805 | 1.0928 | 1.1095 | 32.32 | -0.0011 |
| AUD/JPY | AUDJPY | 96.90 | -0.3148 | 0.0578 | 0.4812 | 1.1345 | 2.5169 | 3.2928 | -0.7406 | 1.9581 | 96.07 | 94.66 | 95.03 | 71.76 | 0.2861 |
| AUD/NZD | AUDNZD | 1.1107 | 0.0631 | -0.1842 | 0.0549 | 1.6182 | 3.1070 | 0.7118 | 0.7259 | 2.8616 | 1.0970 | 1.0885 | 1.0951 | 79.26 | 0.0050 |
| CHF/JPY | CHFJPY | 184.69 | -0.5996 | 0.3334 | 0.4786 | 1.3500 | 4.8357 | 9.8438 | 6.2671 | 9.3988 | 183.70 | 179.65 | 175.16 | 64.99 | 0.4440 |
| NZD/JPY | NZDJPY | 87.23 | -0.3814 | 0.2551 | 0.4306 | -0.4690 | -0.5711 | 2.5680 | -1.4618 | -0.7837 | 87.56 | 86.94 | 86.77 | 51.65 | -0.1352 |
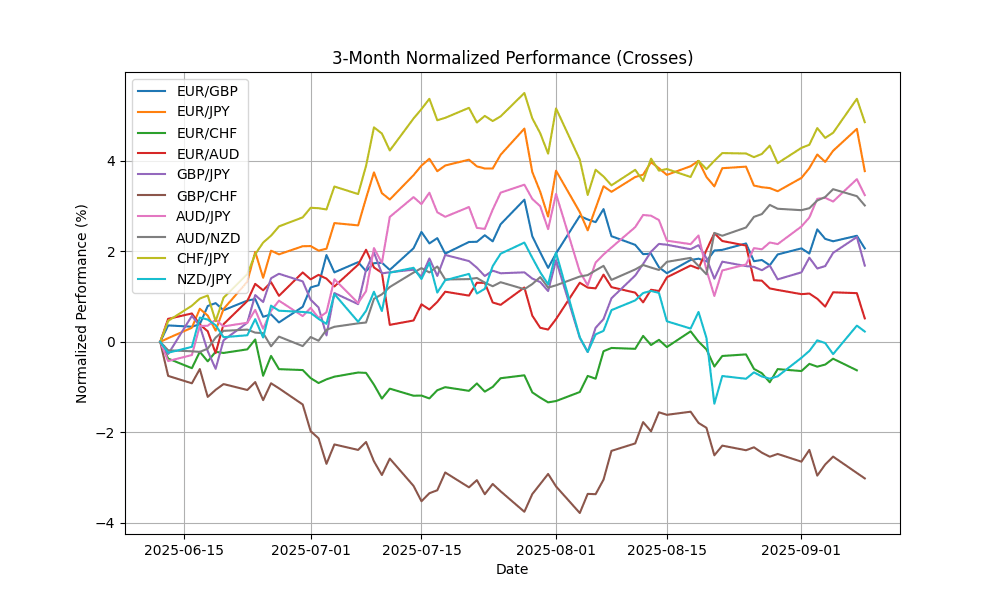
Current analysis of key FX pairs reveals notable overbought and oversold conditions. The AUD/NZD pair is significantly overbought, with an RSI of 79.26 and a positive MACD, indicating potential price corrections ahead. Similarly, AUD/JPY, with an RSI of 71.76, also suggests overbought territory. Conversely, EUR/CHF and GBP/CHF are oversold, with RSIs of 36.90 and 32.32, respectively, and negative MACDs, signaling potential buying opportunities. The overall market sentiment for pairs like EUR/GBP and EUR/JPY remains neutral, as their RSIs are within a balanced range. Monitoring these conditions will be crucial for informed trading decisions.
## Exotics and Emerging
| Name | Symbol | Price | Daily (%) | 5D (%) | 1W (%) | 1M (%) | 3M (%) | 6M (%) | YTD (%) | 12M (%) | MA50 | MA100 | MA200 | RSI | MACD |
|---|---|---|---|---|---|---|---|---|---|---|---|---|---|---|---|
| USD/TRY – U.S. Dollar / Turkish Lira | USDTRY | 41.27 | -0.0068 | 0.2779 | 0.3162 | 1.5176 | 5.3001 | 12.79 | 16.90 | 21.40 | 40.63 | 39.84 | 38.02 | 89.30 | 0.1862 |
| USD/ZAR – U.S. Dollar / South African Rand | USDZAR | 17.47 | -0.0418 | -1.0564 | -0.8455 | -1.2763 | -1.2254 | -4.7283 | -6.9150 | -1.9770 | 17.71 | 17.88 | 18.16 | 39.85 | -0.0362 |
| USD/THB – U.S. Dollar / Thai Baht | USDTHB | 31.65 | -0.0632 | -1.9213 | -1.9517 | -1.9638 | -2.9141 | -6.2778 | -7.2908 | -6.0636 | 32.39 | 32.63 | 33.31 | 20.00 | -0.1089 |
| USD/SEK – U.S. Dollar / Swedish Krona | USDSEK | 9.3662 | 0.1476 | -0.5966 | -0.1503 | -1.9711 | -2.2781 | -7.1734 | -15.0368 | -9.0499 | 9.5605 | 9.5843 | 10.11 | 32.70 | -0.0517 |
| USD/NOK – U.S. Dollar / Norwegian Krone | USDNOK | 9.9662 | -0.0882 | -0.6964 | -0.2095 | -2.3813 | -1.3010 | -6.2596 | -12.0186 | -6.9257 | 10.15 | 10.18 | 10.61 | 24.13 | -0.0476 |
| USD/DKK – U.S. Dollar / Danish Krone | USDDKK | 6.3555 | 0.1355 | -0.7108 | -0.2334 | -0.5825 | -2.5465 | -7.2475 | -11.3203 | -5.5652 | 6.3966 | 6.4718 | 6.7596 | 40.67 | -0.0088 |
| USD/MXN – U.S. Dollar / Mexican Peso | USDMXN | 18.63 | -0.1490 | -0.4335 | -0.1212 | 0.0943 | -2.2733 | -7.6777 | -9.7261 | -6.5932 | 18.69 | 18.98 | 19.67 | 33.55 | -0.0116 |
| USD/PLN – U.S. Dollar / Polish Zloty | USDPLN | 3.6217 | 0.3297 | -0.6592 | -0.4113 | -0.5492 | -2.5746 | -5.8124 | -11.8179 | -6.1566 | 3.6458 | 3.6921 | 3.8419 | 47.62 | -0.0038 |
| USD/HUF – U.S. Dollar / Hungarian Forint | USDHUF | 334.73 | 0.1712 | -0.7128 | -0.6521 | -1.4570 | -4.4453 | -8.6595 | -15.2599 | -5.7088 | 340.27 | 346.97 | 365.45 | 43.91 | -1.4027 |
| USD/CZK – U.S. Dollar / Czech Koruna | USDCZK | 20.71 | 0.1489 | -1.1163 | -0.6233 | -1.0241 | -4.2823 | -9.7874 | -14.2645 | -8.1910 | 21.03 | 21.42 | 22.55 | 39.51 | -0.0672 |
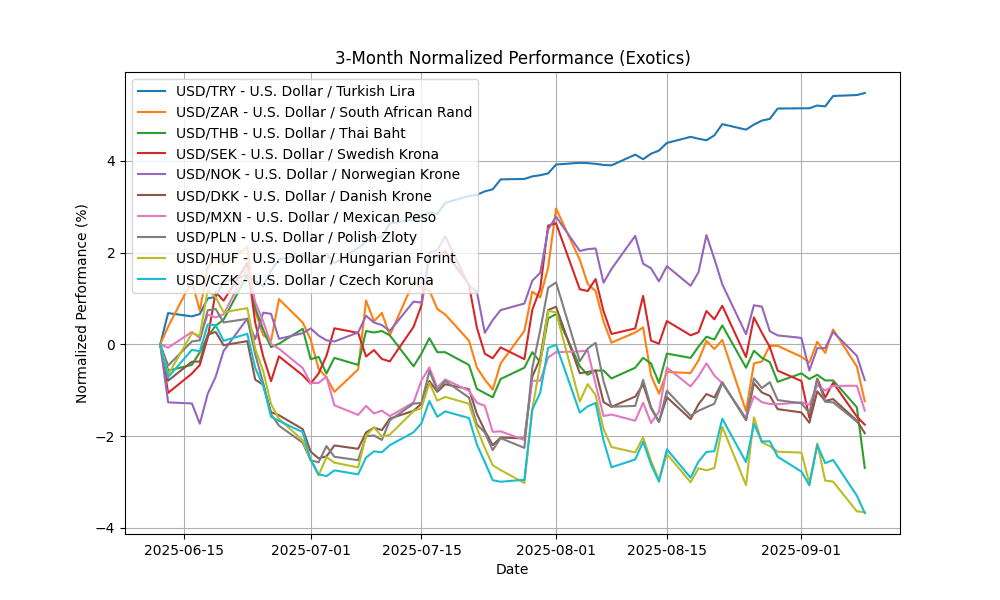
In the current analysis of key FX pairs, USD/TRY is significantly overbought with an RSI of 89.30, indicating potential for a price correction, despite a bullish MACD. Conversely, USD/ZAR, USD/THB, USD/NOK, and USD/SEK exhibit oversold conditions with RSIs below 40 and negative MACDs, suggesting potential buying opportunities as they may be undervalued. The moving averages for these pairs indicate a bearish trend, particularly for USD/NOK and USD/THB, where prices are well below their 50, 100, and 200-day MAs. Traders should exercise caution and monitor for potential reversals in these oversold pairs.


