## Forex and Global News
In today’s forex markets, the sentiment is influenced by a mix of geopolitical tensions and economic developments. President Trump’s appeal to the Supreme Court regarding his tariffs has raised concerns about potential trade disruptions, impacting market sentiment, particularly in Europe where stocks opened mixed. Meanwhile, a global bond sell-off is underway, leading to a surprising surge in gold prices, which typically decline when yields rise. This shift in investor behavior reflects a flight to safety, further bolstering gold’s appeal amidst economic uncertainty.
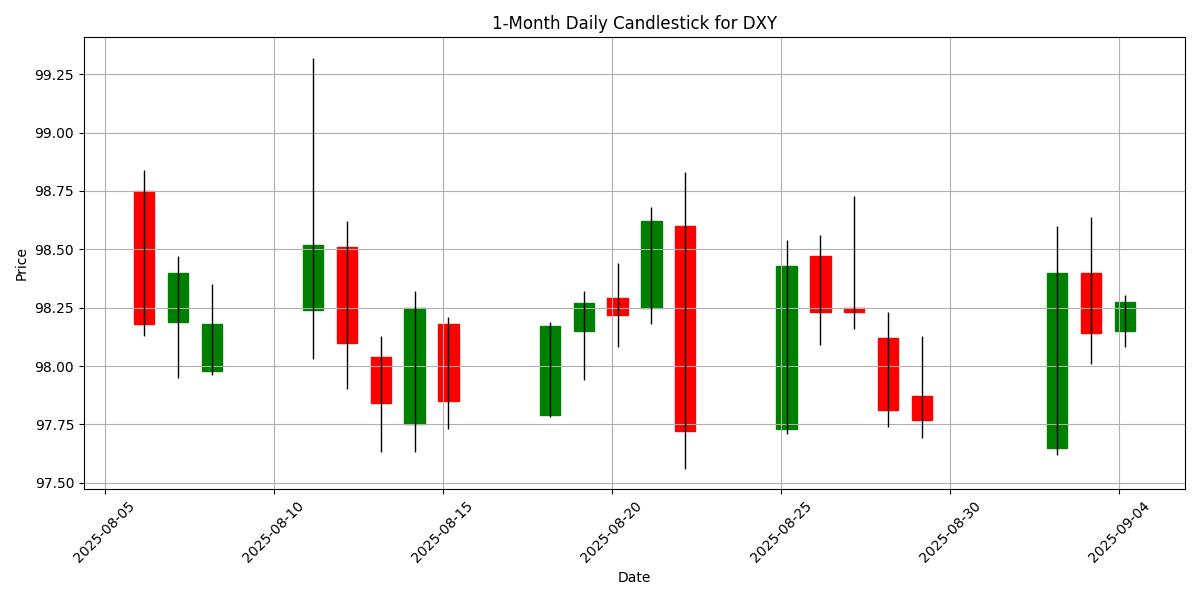
The U.S. Dollar Index (DXY) is currently at 98.28, reflecting a slight daily change of 0.0489%. The market is closely monitoring these developments, as the interplay between rising gold prices and fluctuating bond yields could influence currency valuations. The JPY and GBP are also under scrutiny as traders digest the implications of U.S. policy moves and ongoing geopolitical tensions, including the situation in Ukraine and U.S.-Mexico relations. Overall, the forex market remains cautious, balancing between risk aversion and potential economic recovery signals.
## Economic Calendar Events Today
All times are in US Eastern Time (New York).
| Date | Time | Cur | Imp | Event | Actual | Forecast |
|---|---|---|---|---|---|---|
| 2025-09-04 | 02:00 | 🇸🇪 | Medium | CPI (MoM) (Aug) | 0.8% | -0.4% |
| 2025-09-04 | 02:00 | 🇸🇪 | Medium | CPI (YoY) (Aug) | 1.1% | 1.1% |
| 2025-09-04 | 02:30 | 🇨🇭 | Medium | CPI (MoM) (Aug) | -0.1% | 0.0% |
| 2025-09-04 | 04:30 | 🇬🇧 | Medium | S&P Global Construction PMI (Aug) | 45.2 | |
| 2025-09-04 | 08:15 | 🇺🇸 | High | ADP Nonfarm Employment Change (Aug) | 73K | |
| 2025-09-04 | 08:30 | 🇺🇸 | Medium | Continuing Jobless Claims | 1,960K | |
| 2025-09-04 | 08:30 | 🇺🇸 | Medium | Exports (Jul) | ||
| 2025-09-04 | 08:30 | 🇺🇸 | Medium | Imports (Jul) | ||
| 2025-09-04 | 08:30 | 🇺🇸 | High | Initial Jobless Claims | 230K | |
| 2025-09-04 | 08:30 | 🇺🇸 | Medium | Nonfarm Productivity (QoQ) (Q2) | 2.8% | |
| 2025-09-04 | 08:30 | 🇺🇸 | Medium | Trade Balance (Jul) | -77.70B | |
| 2025-09-04 | 08:30 | 🇺🇸 | Medium | Unit Labor Costs (QoQ) (Q2) | 1.2% | |
| 2025-09-04 | 08:30 | 🇨🇦 | Medium | Trade Balance (Jul) | -5.20B | |
| 2025-09-04 | 09:45 | 🇺🇸 | Medium | S&P Global Composite PMI (Aug) | 55.4 | |
| 2025-09-04 | 09:45 | 🇺🇸 | High | S&P Global Services PMI (Aug) | 55.4 | |
| 2025-09-04 | 10:00 | 🇺🇸 | Medium | ISM Non-Manufacturing Employment (Aug) | ||
| 2025-09-04 | 10:00 | 🇺🇸 | High | ISM Non-Manufacturing PMI (Aug) | 50.9 | |
| 2025-09-04 | 10:00 | 🇺🇸 | High | ISM Non-Manufacturing Prices (Aug) | ||
| 2025-09-04 | 12:00 | 🇺🇸 | High | Crude Oil Inventories | -2.000M | |
| 2025-09-04 | 12:00 | 🇺🇸 | Medium | Cushing Crude Oil Inventories | ||
| 2025-09-04 | 12:05 | 🇺🇸 | Medium | FOMC Member Williams Speaks | ||
| 2025-09-04 | 13:00 | 🇺🇸 | Medium | Atlanta Fed GDPNow (Q3) | 3.0% | |
| 2025-09-04 | 16:30 | 🇺🇸 | Medium | Fed’s Balance Sheet | ||
| 2025-09-04 | 19:30 | 🇯🇵 | Medium | Household Spending (MoM) (Jul) | 1.3% | |
| 2025-09-04 | 19:30 | 🇯🇵 | Medium | Household Spending (YoY) (Jul) | 2.2% |
On September 4, 2025, several key economic events are poised to influence FX markets, particularly focusing on the SEK, CHF, GBP, and USD.
The Swedish Krona (SEK) reacted sharply to the CPI data released at 02:00 ET. The monthly CPI rose 0.8%, significantly surpassing the forecast of -0.4%, indicating stronger inflationary pressures. This unexpected rise may bolster the SEK as it suggests potential for tighter monetary policy from the Riksbank.
In Switzerland, the CPI data at 02:30 ET showed a slight monthly decline of -0.1%, against a forecast of 0.0%. This may exert downward pressure on the Swiss Franc (CHF) as it indicates weaker inflation dynamics.
The USD will be in focus at 08:15 ET with the ADP Nonfarm Employment Change expected at 73K, providing insights into labor market strength ahead of the more significant Nonfarm Payrolls report. Additionally, the ISM Non-Manufacturing PMI at 10:00 ET is projected at 50.9, which would suggest stagnation in the services sector, potentially impacting the USD negatively.
Overall, the day’s data releases could lead to heightened volatility in currency pairs, especially involving SEK, CHF, and USD, as traders adjust their positions based on inflation and employment signals.
## Major FX Group
| Name | Symbol | Price | Daily (%) | 5D (%) | 1W (%) | 1M (%) | 3M (%) | 6M (%) | YTD (%) | 12M (%) | MA50 | MA100 | MA200 | RSI | MACD |
|---|---|---|---|---|---|---|---|---|---|---|---|---|---|---|---|
| EUR/USD – Euro / U.S. Dollar | EURUSD | 1.1659 | -0.0343 | -0.1931 | 0.0948 | 0.6463 | 1.7912 | 8.0743 | 12.04 | 5.5221 | 1.1670 | 1.1524 | 1.1045 | 50.70 | 0.0009 |
| USD/JPY – U.S. Dollar / Japanese Yen | USDJPY | 148.31 | 0.1790 | 1.0389 | 0.6781 | 1.0368 | 3.3252 | 0.1398 | -5.5288 | 2.0378 | 147.04 | 145.63 | 148.94 | 59.03 | 0.0853 |
| GBP/USD – British Pound / U.S. Dollar | GBPUSD | 1.3435 | -0.0372 | -0.5635 | -0.5098 | 1.0339 | -1.0647 | 4.2661 | 7.0595 | 2.4472 | 1.3491 | 1.3454 | 1.3051 | 42.51 | 0.0002 |
| USD/CHF – U.S. Dollar / Swiss Franc | USDCHF | 0.8048 | 0.0995 | 0.4005 | 0.4117 | -0.2837 | -1.7638 | -8.8892 | -10.8985 | -5.3098 | 0.8017 | 0.8125 | 0.8525 | 50.82 | -0.0006 |
| AUD/USD – Australian Dollar / U.S. Dollar | AUDUSD | 0.6528 | -0.2445 | -0.0674 | 0.2549 | 0.8217 | 0.2688 | 3.0908 | 4.9518 | -2.7703 | 0.6522 | 0.6486 | 0.6387 | 55.23 | 0.0005 |
| USD/CAD – U.S. Dollar / Canadian Dollar | USDCAD | 1.3812 | 0.1305 | 0.4524 | 0.2220 | 0.3196 | 1.0632 | -3.3524 | -3.7478 | 1.9833 | 1.3734 | 1.3765 | 1.4028 | 49.89 | 0.0010 |
| NZD/USD – New Zealand Dollar / U.S. Dollar | NZDUSD | 0.5868 | -0.2041 | -0.2904 | 0.1163 | -0.8279 | -2.8846 | 2.2904 | 4.0479 | -5.1620 | 0.5956 | 0.5964 | 0.5834 | 40.53 | -0.0023 |
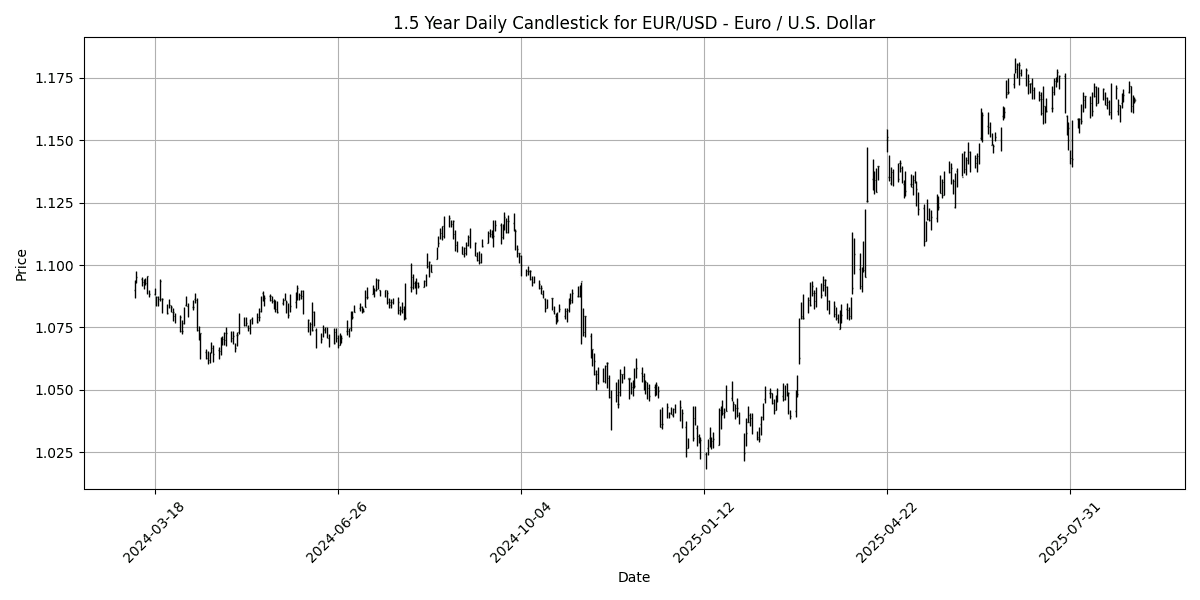
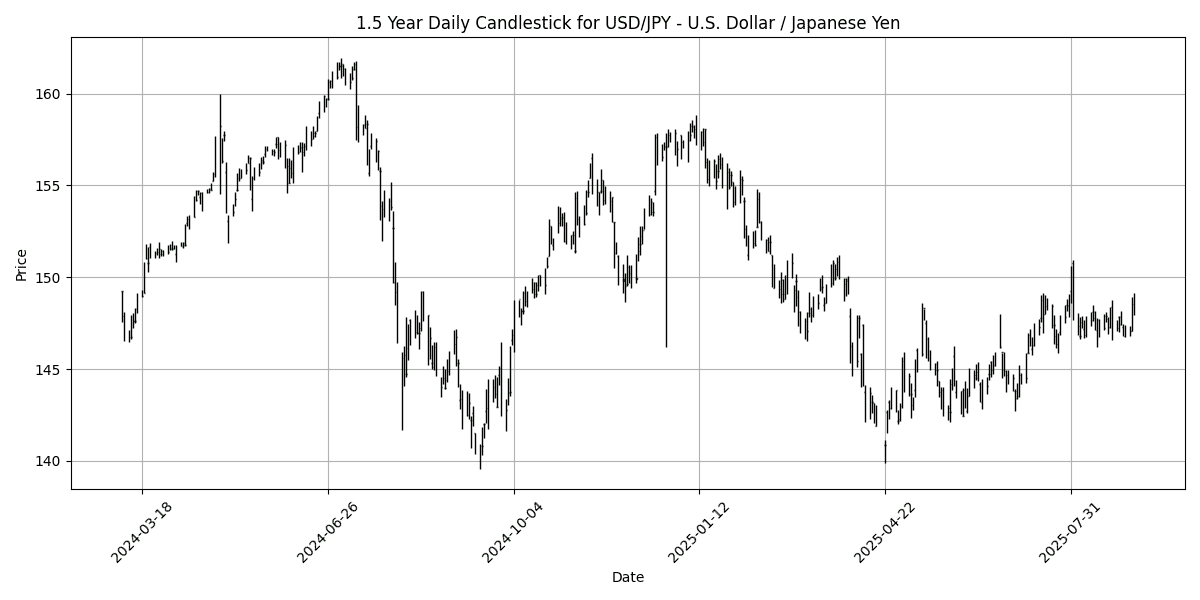
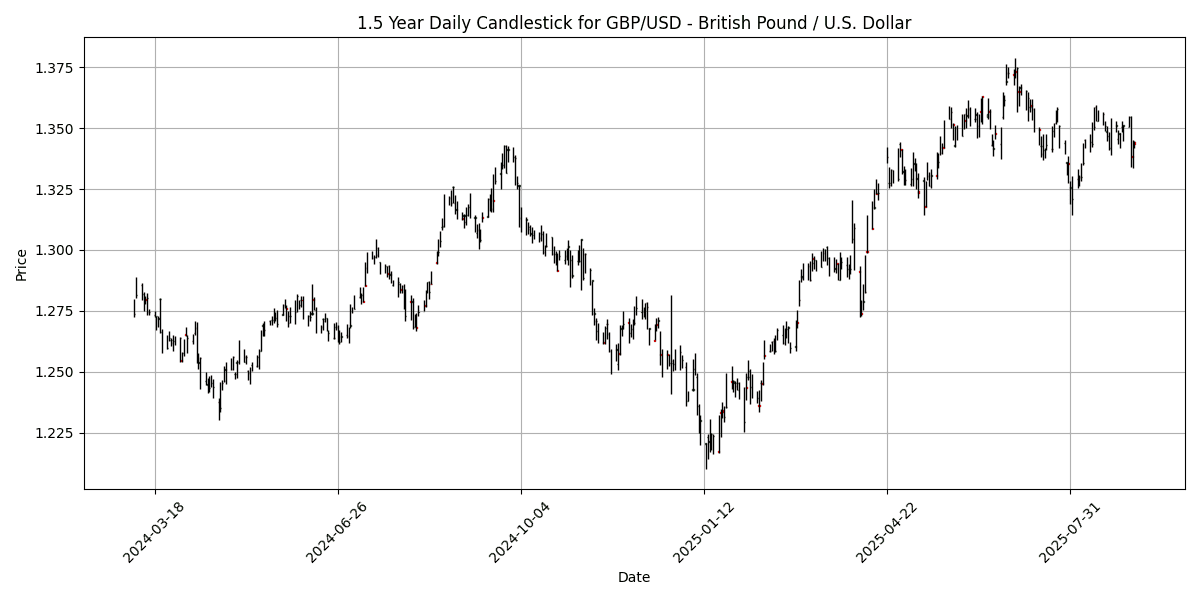
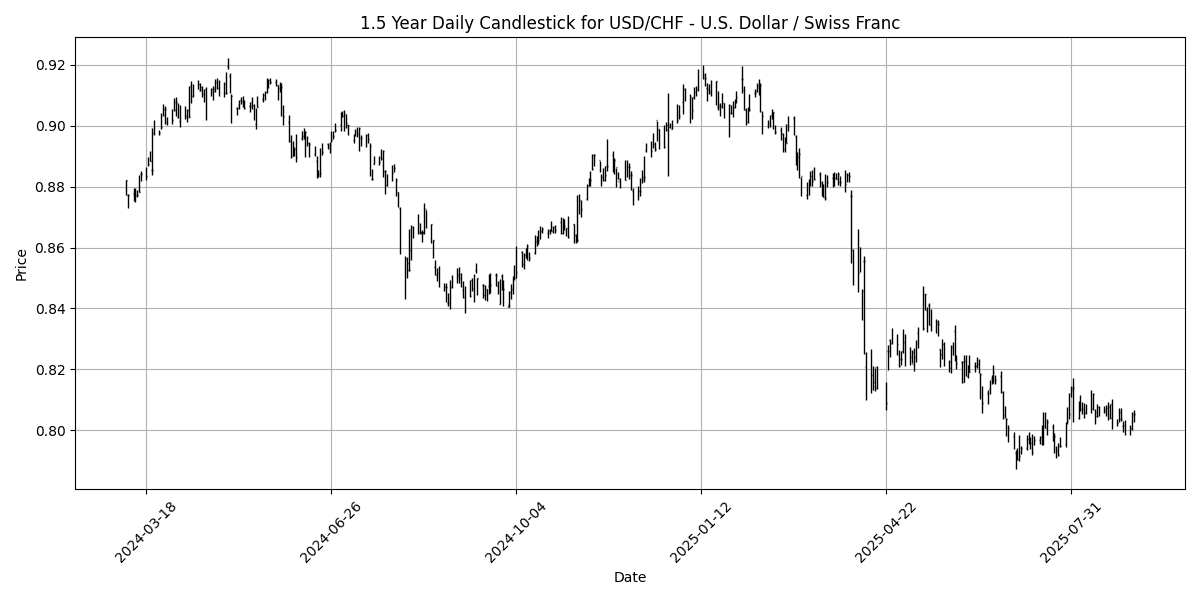
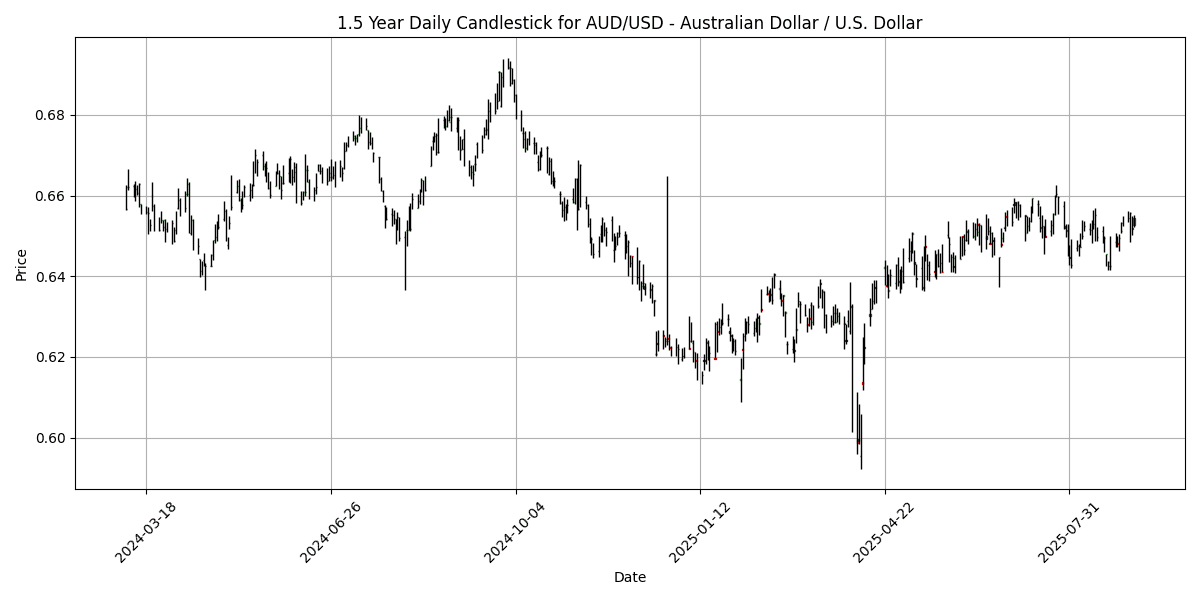
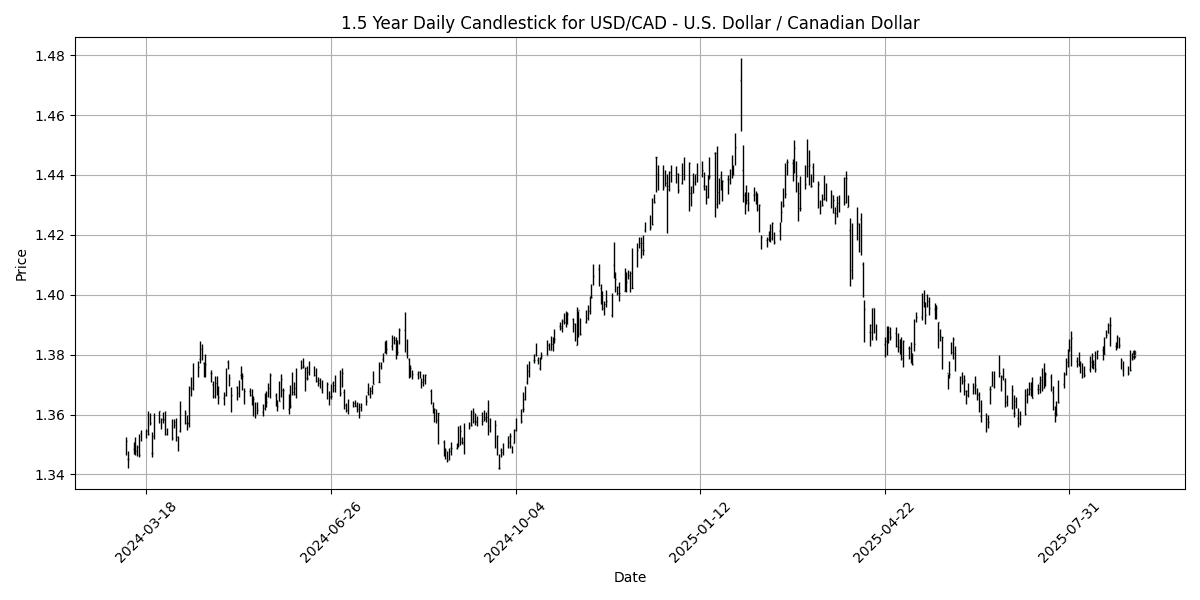
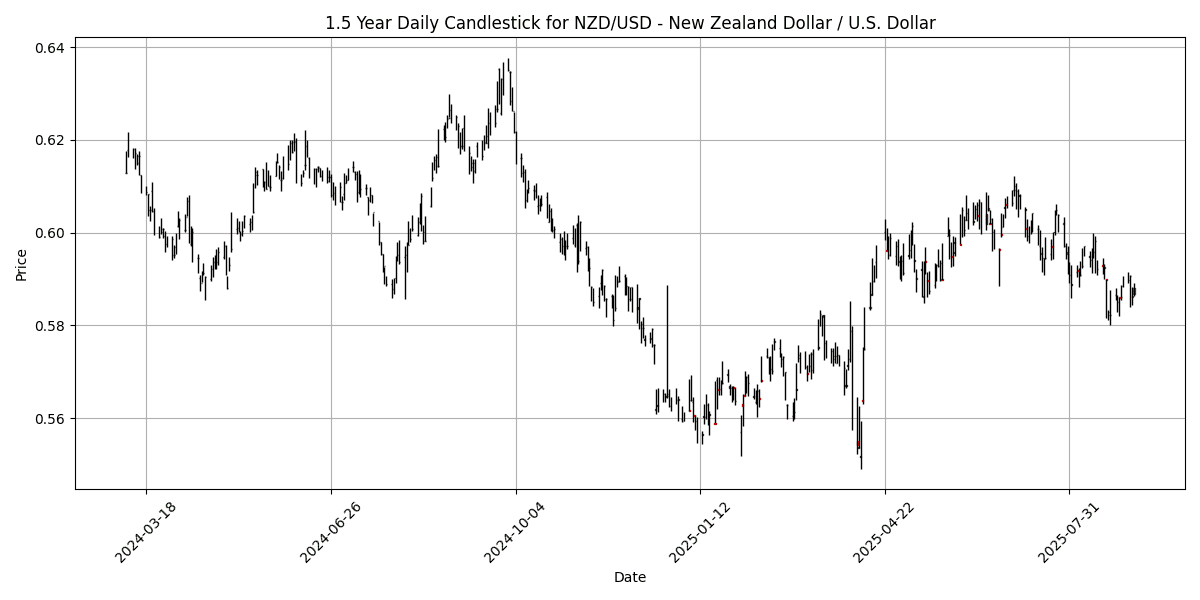
Currently, the analysis of key FX pairs reveals a mixed sentiment across the board, with no pairs in extreme overbought or oversold conditions. The EUR/USD shows a neutral RSI at 50.70, indicating a balanced market, while the MACD is slightly positive, suggesting potential bullish momentum. The USD/JPY, with an RSI of 59.03, remains in a healthy uptrend, supported by a positive MACD, although it is not yet overbought.
Conversely, GBP/USD and NZD/USD exhibit weaker conditions, with RSIs of 42.51 and 40.53, respectively, indicating potential oversold conditions. The negative MACD for NZD/USD further confirms bearish sentiment. The USD/CHF and USD/CAD both hover around neutral RSI levels, with USD/CHF showing slight bearish pressure due to its negative MACD. Overall, traders should monitor GBP/USD and NZD/USD for potential reversals, while maintaining a cautious outlook on the stronger pairs
## Cross FX Group
| Name | Symbol | Price | Daily (%) | 5D (%) | 1W (%) | 1M (%) | 3M (%) | 6M (%) | YTD (%) | 12M (%) | MA50 | MA100 | MA200 | RSI | MACD |
|---|---|---|---|---|---|---|---|---|---|---|---|---|---|---|---|
| EUR/GBP | EURGBP | 0.8674 | -0.0231 | 0.3308 | 0.5669 | -0.4236 | 2.8603 | 3.6172 | 4.6081 | 2.9567 | 0.8647 | 0.8563 | 0.8457 | 66.95 | 0.0003 |
| EUR/JPY | EURJPY | 172.86 | 0.1356 | 0.8100 | 0.7431 | 1.6620 | 5.1485 | 8.2011 | 5.7991 | 7.6526 | 171.66 | 167.87 | 164.27 | 58.87 | 0.2903 |
| EUR/CHF | EURCHF | 0.9380 | 0.0640 | 0.1805 | 0.4745 | 0.3327 | -0.0330 | -1.5554 | -0.2021 | -0.1139 | 0.9355 | 0.9358 | 0.9388 | 39.13 | 0.0001 |
| EUR/AUD | EURAUD | 1.7859 | 0.1964 | -0.1225 | -0.1554 | -0.1744 | 1.5212 | 4.8414 | 6.7356 | 8.5139 | 1.7894 | 1.7768 | 1.7275 | 47.04 | 0.0003 |
| GBP/JPY | GBPJPY | 199.28 | 0.1573 | 0.4795 | 0.1770 | 2.0965 | 2.2280 | 4.4254 | 1.1553 | 4.5580 | 198.43 | 195.99 | 194.16 | 45.13 | 0.2302 |
| GBP/CHF | GBPCHF | 1.0813 | 0.0833 | -0.1524 | -0.0896 | 0.7594 | -2.8097 | -4.9916 | -4.5926 | -2.9789 | 1.0814 | 1.0929 | 1.1100 | 33.26 | -0.0004 |
| AUD/JPY | AUDJPY | 96.78 | -0.0568 | 0.9376 | 0.9008 | 1.8425 | 3.5766 | 3.2088 | -0.8605 | -0.8137 | 95.88 | 94.40 | 95.08 | 55.42 | 0.1216 |
| AUD/NZD | AUDNZD | 1.1123 | -0.0449 | 0.2110 | 0.1278 | 1.6579 | 3.2364 | 0.7747 | 0.8710 | 2.5363 | 1.0949 | 1.0873 | 1.0950 | 78.07 | 0.0051 |
| CHF/JPY | CHFJPY | 184.25 | 0.0625 | 0.6319 | 0.2574 | 1.3170 | 5.1797 | 9.9005 | 6.0139 | 7.7486 | 183.40 | 179.25 | 174.92 | 68.00 | 0.2450 |
| NZD/JPY | NZDJPY | 87.00 | -0.0057 | 0.7329 | 0.7866 | 0.1912 | 0.3356 | 2.4252 | -1.7193 | -3.2333 | 87.60 | 86.83 | 86.82 | 39.49 | -0.2885 |
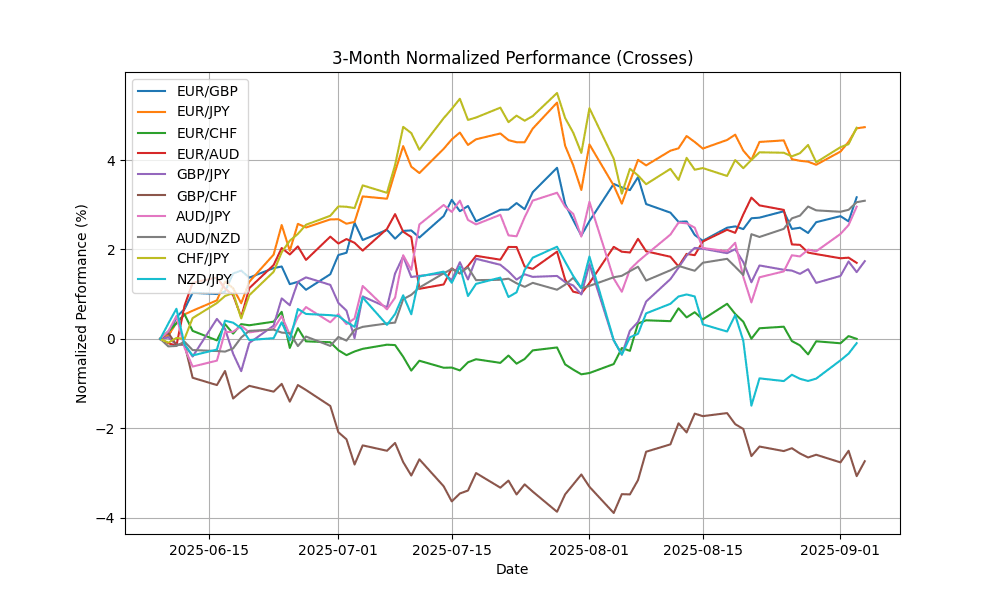
In the current analysis of key FX pairs, AUD/NZD is notably overbought with an RSI of 78.07, indicating potential for a price correction. Conversely, GBP/CHF is deeply oversold at an RSI of 33.26, coupled with a bearish MACD, suggesting further downside risk. EUR/CHF, with an RSI of 39.13, also reflects oversold conditions, warranting caution. The remaining pairs, including EUR/GBP and EUR/JPY, show neutral conditions with RSIs below 70, while MACD readings indicate mixed momentum. Attention should be given to MA crossovers, particularly in GBP/CHF, which may signal a reversal opportunity as the market adjusts to these technical indicators.
## Exotics and Emerging
| Name | Symbol | Price | Daily (%) | 5D (%) | 1W (%) | 1M (%) | 3M (%) | 6M (%) | YTD (%) | 12M (%) | MA50 | MA100 | MA200 | RSI | MACD |
|---|---|---|---|---|---|---|---|---|---|---|---|---|---|---|---|
| USD/TRY – U.S. Dollar / Turkish Lira | USDTRY | 41.09 | -0.1330 | -0.1300 | 0.0855 | 1.0132 | 4.5936 | 12.61 | 16.38 | 20.85 | 40.54 | 39.75 | 37.92 | 71.76 | 0.1791 |
| USD/ZAR – U.S. Dollar / South African Rand | USDZAR | 17.74 | 0.4046 | 0.3458 | 0.3456 | -0.9916 | 0.2138 | -2.1049 | -5.4511 | -1.0976 | 17.72 | 17.93 | 18.17 | 60.54 | -0.0312 |
| USD/THB – U.S. Dollar / Thai Baht | USDTHB | 32.29 | 0.1862 | 0.0930 | -0.3395 | -0.0619 | -0.9205 | -4.1811 | -5.4161 | -5.7419 | 32.42 | 32.67 | 33.35 | 42.20 | -0.0372 |
| USD/SEK – U.S. Dollar / Swedish Krona | USDSEK | 9.4439 | 0.1708 | -0.3635 | -0.8773 | -2.0722 | -1.2712 | -7.0335 | -14.3320 | -8.2746 | 9.5655 | 9.5939 | 10.14 | 38.96 | -0.0396 |
| USD/NOK – U.S. Dollar / Norwegian Krone | USDNOK | 10.09 | 0.5640 | 0.2752 | 0.1832 | -1.5718 | 0.2394 | -7.2757 | -10.9107 | -5.4747 | 10.15 | 10.19 | 10.63 | 40.91 | -0.0370 |
| USD/DKK – U.S. Dollar / Danish Krone | USDDKK | 6.4045 | 0.0609 | 0.2341 | -0.0593 | -0.5830 | -1.6639 | -7.3788 | -10.6365 | -5.1382 | 6.3950 | 6.4788 | 6.7741 | 56.50 | -0.0053 |
| USD/MXN – U.S. Dollar / Mexican Peso | USDMXN | 18.73 | 0.1508 | 0.4518 | 0.4466 | -0.7254 | -2.1756 | -7.6114 | -9.1978 | -5.3593 | 18.70 | 19.02 | 19.70 | 44.67 | -0.0115 |
| USD/PLN – U.S. Dollar / Polish Zloty | USDPLN | 3.6523 | 0.2058 | 0.1446 | -0.2499 | -0.9814 | -2.2038 | -5.5552 | -11.0729 | -5.6836 | 3.6449 | 3.6960 | 3.8491 | 58.68 | -0.0019 |
| USD/HUF – U.S. Dollar / Hungarian Forint | USDHUF | 338.01 | 0.1838 | -0.3858 | -0.5089 | -1.8668 | -4.0017 | -8.6462 | -14.4296 | -5.1224 | 340.67 | 347.87 | 366.56 | 55.30 | -0.8048 |
| USD/CZK – U.S. Dollar / Czech Koruna | USDCZK | 20.98 | 0.1595 | 0.0010 | -0.3445 | -1.1126 | -3.0730 | -9.5414 | -13.1725 | -7.6081 | 21.04 | 21.45 | 22.60 | 48.68 | -0.0390 |
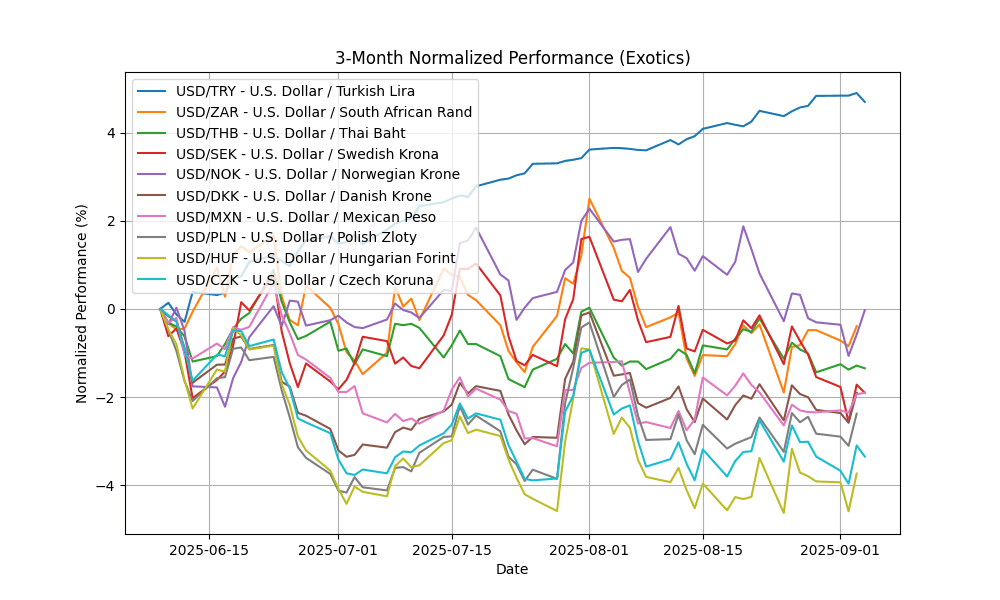
In the current analysis of key FX pairs, USD/TRY is notably overbought with an RSI of 71.76, indicating potential price correction. The positive MACD supports the bullish momentum, while MA crossovers suggest continued strength. Conversely, USD/ZAR shows a neutral RSI of 60.54, with a bearish MACD, hinting at a potential downtrend. The remaining pairs, including USD/THB, USD/SEK, and USD/NOK, exhibit oversold conditions with RSIs below 50 and negative MACDs, indicating weakness. Traders should closely monitor these indicators for potential reversal opportunities, particularly in the USD/TRY and USD/ZAR pairs.


