## Forex and Global News
In today’s forex and global market news, the U.S. dollar (USD) remains under pressure as geopolitical tensions escalate. Former President Trump’s recent remarks labeling the India-U.S. trade relationship as a “totally one-sided disaster” come amid heightened tariff concerns, including a 50% tariff on imports from India and secondary duties on Russian oil. This has contributed to a cautious market sentiment, particularly in Europe, where stocks opened lower in anticipation of inflation data and further tariff implications.
Additionally, the Shanghai Cooperation Organization (SCO) summit highlighted China’s ambitions for a new global order, challenging U.S. dominance, which may impact currency valuations. In commodities, gold (XAU/USD) has seen volatility, briefly reaching record highs above $3,500 before stabilizing ahead of the U.S. ISM Manufacturing PMI report.
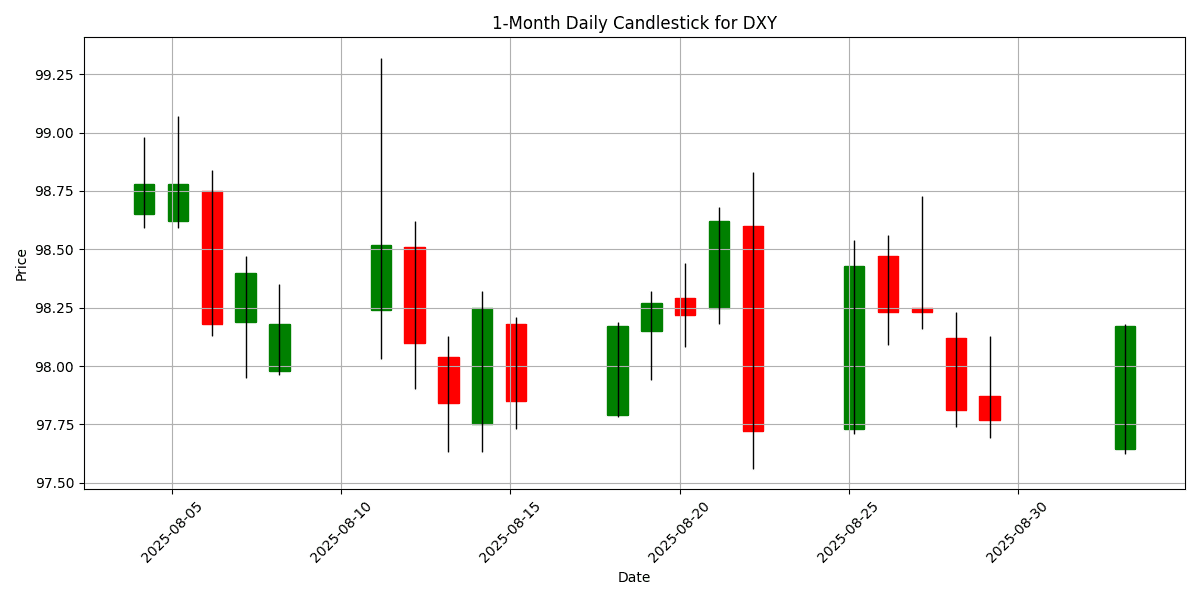
The DXY index is currently at 98.17, reflecting a daily change of 0.4101%, indicating mixed sentiment in the forex market amid these geopolitical and economic developments.
## Economic Calendar Events Today
All times are in US Eastern Time (New York).
| Date | Time | Cur | Imp | Event | Actual | Forecast |
|---|---|---|---|---|---|---|
| 2025-09-02 | 03:00 | 🇪🇺 | Medium | Spanish Unemployment Change (Aug) | 21.9K | 14.2K |
| 2025-09-02 | 04:00 | 🇧🇷 | Medium | IPC-Fipe Inflation Index (MoM) (Aug) | ||
| 2025-09-02 | 05:00 | 🇪🇺 | Medium | Core CPI (YoY) (Aug) | 2.2% | |
| 2025-09-02 | 05:00 | 🇪🇺 | Medium | CPI (MoM) (Aug) | ||
| 2025-09-02 | 05:00 | 🇪🇺 | High | CPI (YoY) (Aug) | 2.1% | |
| 2025-09-02 | 07:30 | 🇪🇺 | Medium | ECB’s Elderson Speaks | ||
| 2025-09-02 | 08:00 | 🇧🇷 | Medium | GDP (YoY) (Q2) | 2.1% | |
| 2025-09-02 | 08:00 | 🇧🇷 | Medium | GDP (QoQ) (Q2) | 0.3% | |
| 2025-09-02 | 09:45 | 🇺🇸 | High | S&P Global Manufacturing PMI (Aug) | 53.3 | |
| 2025-09-02 | 10:00 | 🇺🇸 | Medium | Construction Spending (MoM) (Jul) | -0.1% | |
| 2025-09-02 | 10:00 | 🇺🇸 | Medium | ISM Manufacturing Employment (Aug) | ||
| 2025-09-02 | 10:00 | 🇺🇸 | High | ISM Manufacturing PMI (Aug) | 49.0 | |
| 2025-09-02 | 10:00 | 🇺🇸 | High | ISM Manufacturing Prices (Aug) | 65.1 | |
| 2025-09-02 | 10:00 | 🇪🇺 | Medium | German Buba President Nagel Speaks | ||
| 2025-09-02 | 13:00 | 🇺🇸 | Medium | Atlanta Fed GDPNow (Q3) | 3.5% | |
| 2025-09-02 | 14:00 | 🇺🇸 | High | U.S. President Trump Speaks | ||
| 2025-09-02 | 20:30 | 🇯🇵 | Medium | au Jibun Bank Services PMI (Aug) | 52.7 | |
| 2025-09-02 | 21:30 | 🇦🇺 | Medium | GDP (QoQ) (Q2) | 0.5% | |
| 2025-09-02 | 21:30 | 🇦🇺 | Medium | GDP (YoY) (Q2) | ||
| 2025-09-02 | 21:45 | 🇨🇳 | Medium | Caixin Services PMI (Aug) | 52.4 |
On September 2, 2025, several key economic events are poised to impact foreign exchange (FX) markets significantly.
The Spanish Unemployment Change for August reported a rise of 21.9K, significantly overshooting the forecast of 14.2K. This unexpected increase may weaken the euro (EUR) as it raises concerns about the labor market’s health in Spain, potentially leading to a more dovish stance from the European Central Bank (ECB).
At 5:00 AM EDT, the Eurozone’s Core CPI and CPI figures will be released, with the market anticipating a Core CPI of 2.2% and a CPI YoY of 2.1%. Any deviation from these expectations could influence EUR volatility, particularly if inflation pressures are stronger than anticipated.
In the U.S., the ISM Manufacturing PMI is expected to show a contraction at 49.0, indicating a slowdown in manufacturing. This could weaken the U.S. dollar (USD) if confirmed, especially in conjunction with the construction spending data, which is forecasted to decline by 0.1%.
Overall, the combination of weaker employment data in Spain and potential signs of economic slowdown in the U.S. may lead to increased volatility in both the EUR and USD, impacting currency trading strategies.
## Major FX Group
| Name | Symbol | Price | Daily (%) | 5D (%) | 1W (%) | 1M (%) | 3M (%) | 6M (%) | YTD (%) | 12M (%) | MA50 | MA100 | MA200 | RSI | MACD |
|---|---|---|---|---|---|---|---|---|---|---|---|---|---|---|---|
| EUR/USD – Euro / U.S. Dollar | EURUSD | 1.1678 | -0.3158 | 0.2580 | 0.5125 | 2.2257 | 2.5784 | 8.1803 | 12.22 | 5.7326 | 1.1669 | 1.1517 | 1.1033 | 50.10 | 0.0011 |
| USD/JPY – U.S. Dollar / Japanese Yen | USDJPY | 148.47 | 0.8834 | 0.7800 | 0.4350 | -1.5301 | 3.2175 | -0.2908 | -5.4333 | 1.4237 | 147.00 | 145.59 | 148.98 | 54.15 | 0.0990 |
| GBP/USD – British Pound / U.S. Dollar | GBPUSD | 1.3441 | -0.7751 | -0.4654 | -0.0930 | 1.7497 | -0.6683 | 4.2592 | 7.1073 | 2.3801 | 1.3498 | 1.3448 | 1.3042 | 44.48 | 0.0008 |
| USD/CHF – U.S. Dollar / Swiss Franc | USDCHF | 0.8024 | 0.2499 | 0.1123 | -0.4676 | -1.4129 | -2.4900 | -9.9125 | -11.1643 | -5.6555 | 0.8019 | 0.8129 | 0.8533 | 34.57 | -0.0006 |
| AUD/USD – Australian Dollar / U.S. Dollar | AUDUSD | 0.6517 | -0.6100 | 0.0860 | 0.5539 | 1.3674 | 0.7874 | 2.8226 | 4.7749 | -3.7087 | 0.6520 | 0.6481 | 0.6387 | 48.04 | 0.0001 |
| USD/CAD – U.S. Dollar / Canadian Dollar | USDCAD | 1.3766 | 0.1091 | -0.1117 | -0.6732 | -0.6567 | 0.3719 | -3.9934 | -4.0684 | 2.0535 | 1.3731 | 1.3769 | 1.4030 | 45.78 | 0.0015 |
| NZD/USD – New Zealand Dollar / U.S. Dollar | NZDUSD | 0.5866 | -0.6605 | 0.0822 | 0.2875 | -0.3854 | -2.3329 | 2.3805 | 4.0124 | -6.1440 | 0.5962 | 0.5964 | 0.5834 | 36.27 | -0.0026 |
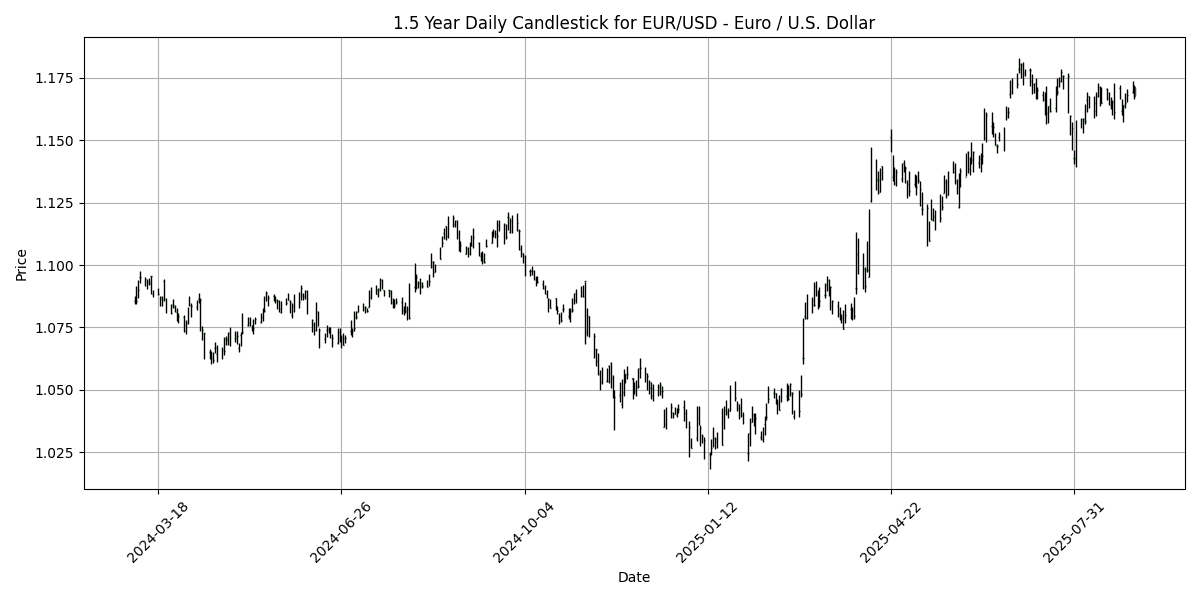
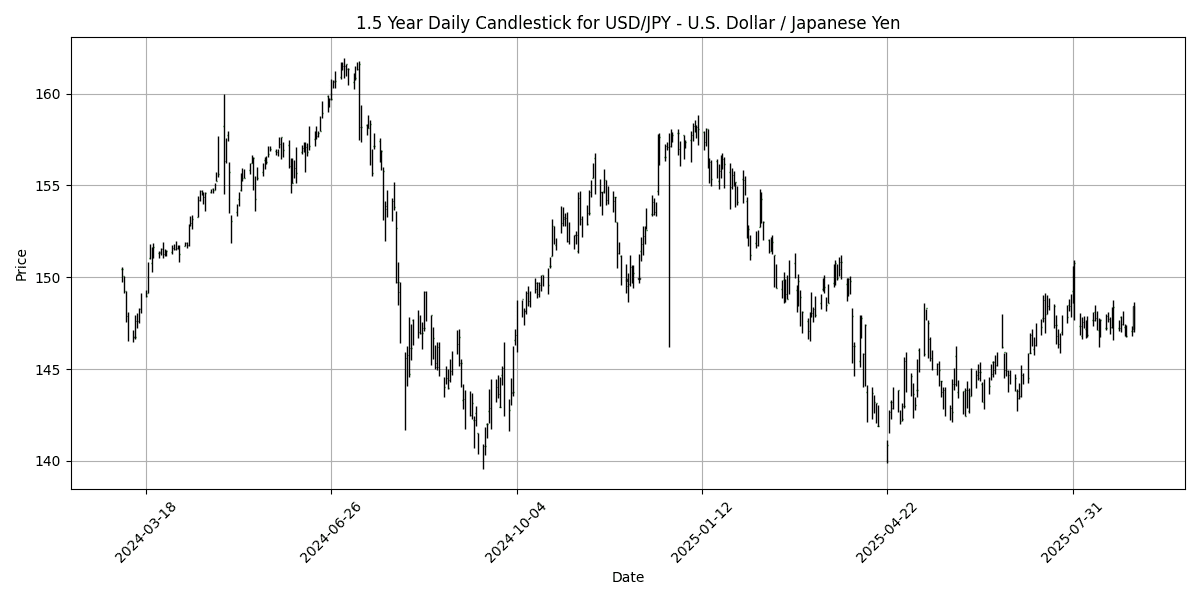
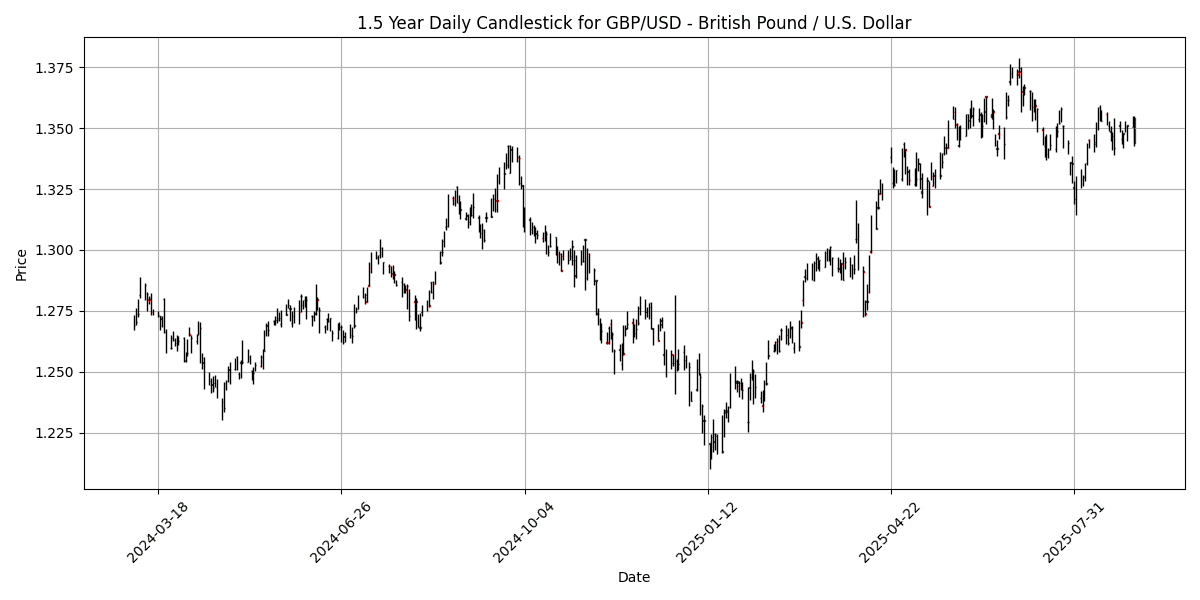
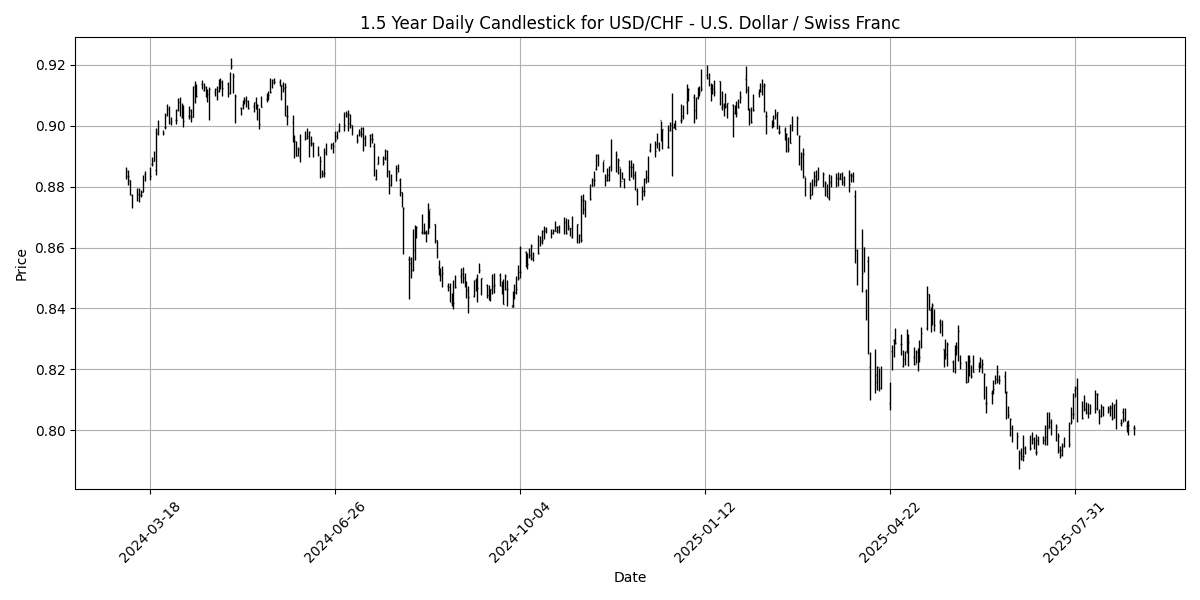
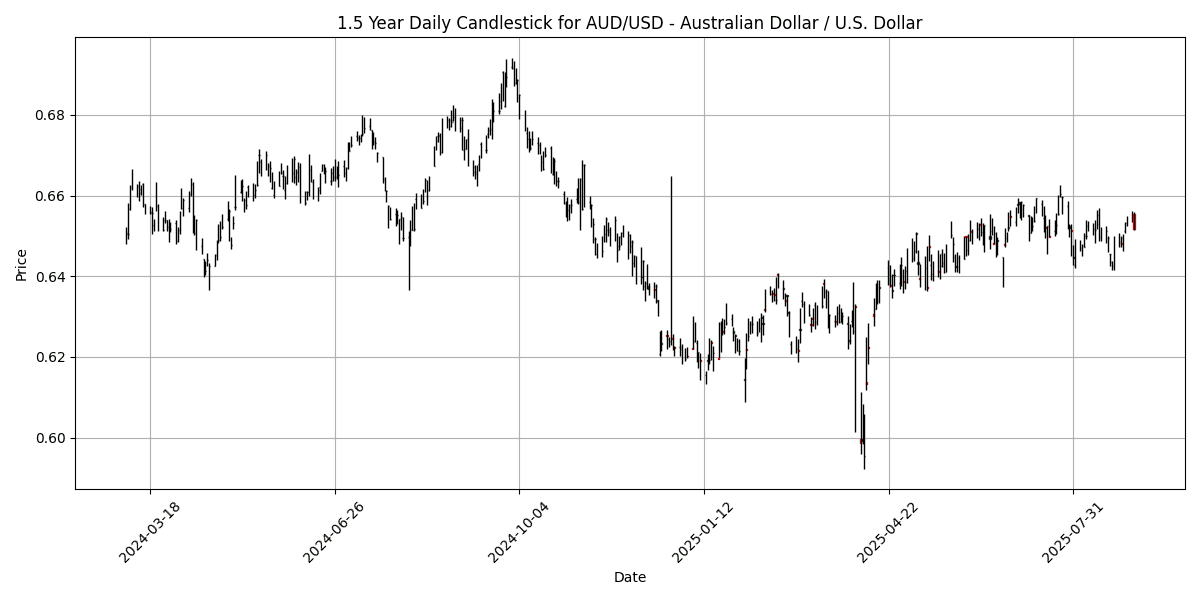
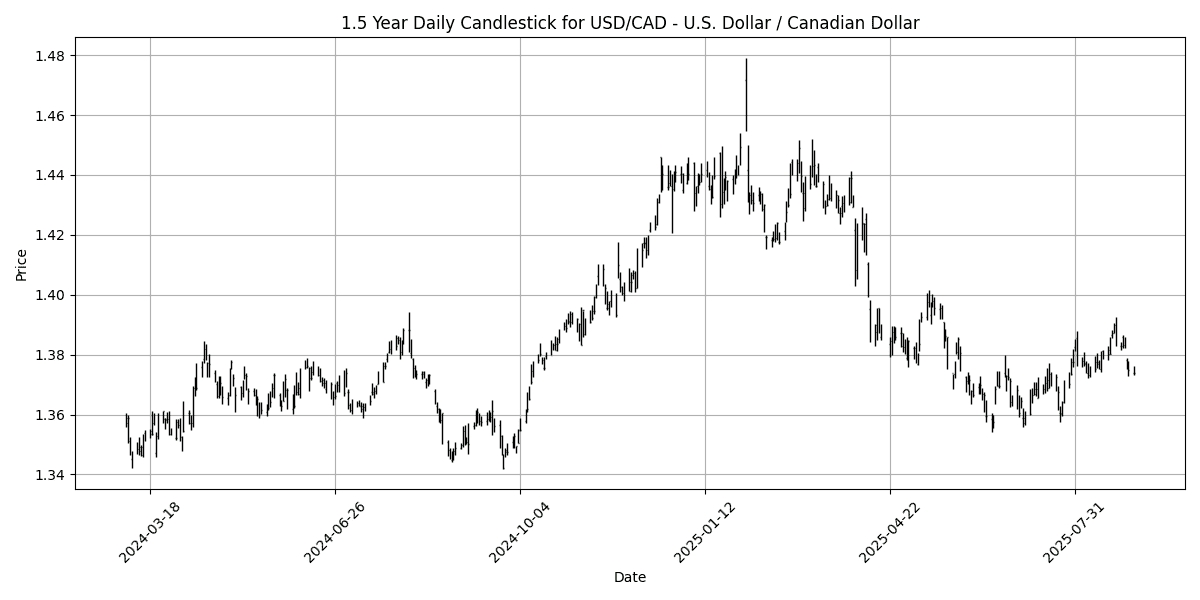
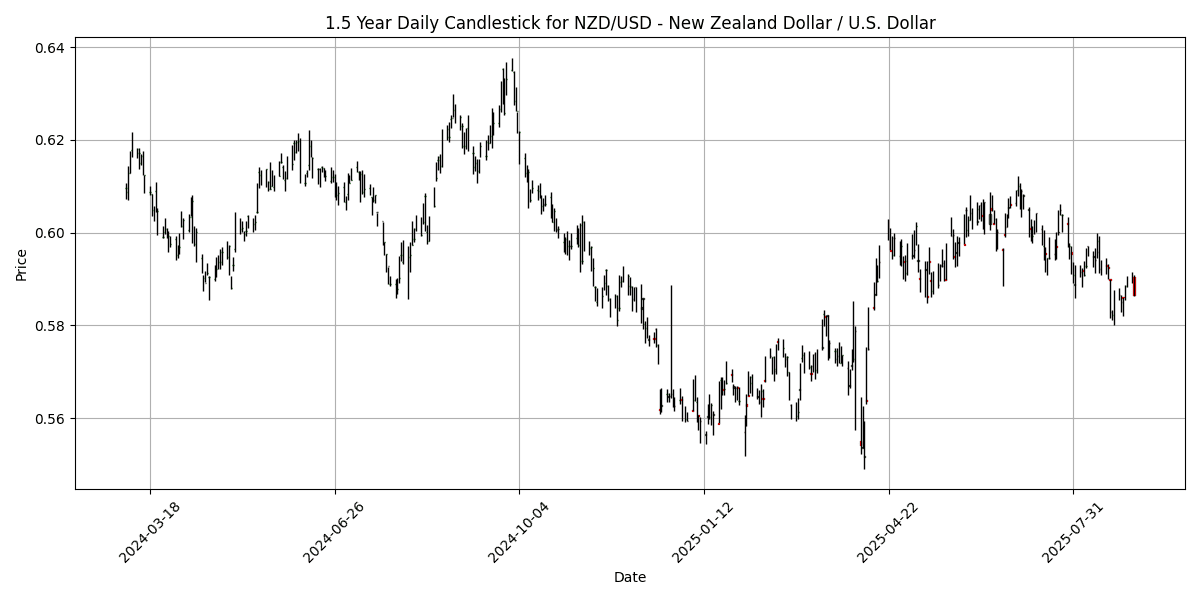
Analyzing the current technical indicators for the selected FX pairs reveals a generally neutral to bearish sentiment across the board. The EUR/USD pair shows an RSI of 50.10, indicating a balanced market with no immediate overbought or oversold conditions. Similarly, the USD/JPY pair, with an RSI of 54.15, reflects stability, bolstered by a positive MACD, suggesting bullish momentum.
Conversely, GBP/USD is showing signs of weakness with an RSI of 44.48, indicating potential oversold conditions, while the negative MACD hints at bearish sentiment. The USD/CHF pair is notably oversold at an RSI of 34.57, accompanied by a negative MACD, suggesting further downside risk. The NZD/USD pair, with an RSI of 36.27, also indicates oversold conditions. Overall, while some pairs exhibit stability, others are leaning towards bearish territory, warranting caution for traders.
## Cross FX Group
| Name | Symbol | Price | Daily (%) | 5D (%) | 1W (%) | 1M (%) | 3M (%) | 6M (%) | YTD (%) | 12M (%) | MA50 | MA100 | MA200 | RSI | MACD |
|---|---|---|---|---|---|---|---|---|---|---|---|---|---|---|---|
| EUR/GBP | EURGBP | 0.8687 | 0.4858 | 0.7177 | 0.6290 | 0.4579 | 3.2593 | 3.7514 | 4.7649 | 3.2704 | 0.8642 | 0.8563 | 0.8454 | 52.99 | -0.0001 |
| EUR/JPY | EURJPY | 173.30 | 0.5512 | 0.9972 | 0.9425 | 0.6236 | 5.8367 | 7.8247 | 6.0660 | 7.1905 | 171.43 | 167.57 | 164.12 | 48.66 | 0.1628 |
| EUR/CHF | EURCHF | 0.9367 | -0.0640 | 0.3353 | 0.0363 | 0.7573 | -0.0075 | -2.5722 | -0.3405 | -0.3002 | 0.9354 | 0.9357 | 0.9387 | 41.00 | 0.0001 |
| EUR/AUD | EURAUD | 1.7922 | 0.3134 | 0.1968 | 0.0167 | 0.8718 | 1.8006 | 5.2316 | 7.1121 | 9.8209 | 1.7896 | 1.7771 | 1.7258 | 52.95 | 0.0016 |
| GBP/JPY | GBPJPY | 199.46 | 0.0662 | 0.2710 | 0.3017 | 0.1582 | 2.4906 | 3.9238 | 1.2503 | 3.7875 | 198.35 | 195.66 | 194.09 | 46.33 | 0.2054 |
| GBP/CHF | GBPCHF | 1.0782 | -0.5442 | -0.3761 | -0.5882 | 0.2995 | -3.1615 | -6.0875 | -4.8661 | -3.3351 | 1.0820 | 1.0927 | 1.1104 | 32.01 | -0.0003 |
| AUD/JPY | AUDJPY | 96.69 | 0.2374 | 0.7986 | 0.9227 | -0.2476 | 3.9691 | 2.4661 | -0.9608 | -2.3975 | 95.79 | 94.27 | 95.12 | 46.68 | 0.0080 |
| AUD/NZD | AUDNZD | 1.1109 | 0.0811 | 0.0018 | 0.2590 | 1.7569 | 3.1975 | 0.4340 | 0.7441 | 2.5979 | 1.0930 | 1.0864 | 1.0950 | 74.08 | 0.0049 |
| CHF/JPY | CHFJPY | 184.99 | 0.6245 | 0.6584 | 0.9056 | -0.1281 | 5.8422 | 10.67 | 6.4380 | 7.5042 | 183.22 | 179.07 | 174.83 | 62.46 | 0.1481 |
| NZD/JPY | NZDJPY | 87.02 | 0.1658 | 0.8051 | 0.6640 | -1.9515 | 0.7514 | 2.0272 | -1.7012 | -4.8024 | 87.62 | 86.75 | 86.86 | 34.74 | -0.3779 |
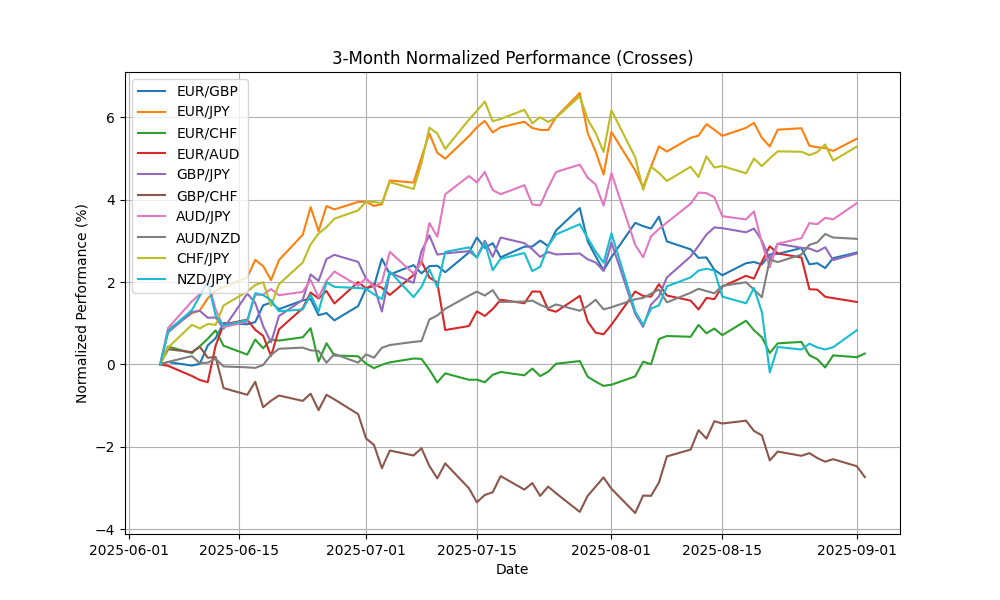
In the current analysis, the AUD/NZD pair is notably overbought with an RSI of 74.08, indicating potential reversal risks. Conversely, GBP/CHF is significantly oversold at an RSI of 32.01, suggesting a possible opportunity for a bullish correction. The MACD readings across most pairs, including EUR/JPY and GBP/JPY, remain positive, indicating bullish momentum, while EUR/CHF and NZD/JPY exhibit bearish tendencies with negative MACD values. Moving averages show upward momentum in pairs like EUR/JPY and AUD/NZD, but the bearish crossover in GBP/CHF signals caution. Traders should closely monitor these indicators for potential entry and exit points.
## Exotics and Emerging
| Name | Symbol | Price | Daily (%) | 5D (%) | 1W (%) | 1M (%) | 3M (%) | 6M (%) | YTD (%) | 12M (%) | MA50 | MA100 | MA200 | RSI | MACD |
|---|---|---|---|---|---|---|---|---|---|---|---|---|---|---|---|
| USD/TRY – U.S. Dollar / Turkish Lira | USDTRY | 41.15 | 0.0406 | 0.2455 | 0.3639 | 1.2048 | 5.1300 | 13.02 | 16.56 | 20.79 | 40.49 | 39.68 | 37.85 | 86.10 | 0.1908 |
| USD/ZAR – U.S. Dollar / South African Rand | USDZAR | 17.69 | 0.4680 | 0.0373 | 0.4236 | -2.8724 | -0.8968 | -3.3248 | -5.7416 | -0.7530 | 17.73 | 17.96 | 18.18 | 44.85 | -0.0387 |
| USD/THB – U.S. Dollar / Thai Baht | USDTHB | 32.34 | 0.1859 | -0.1852 | -0.4310 | -1.2218 | -0.8280 | -3.7213 | -5.2696 | -4.6580 | 32.44 | 32.69 | 33.38 | 48.17 | -0.0239 |
| USD/SEK – U.S. Dollar / Swedish Krona | USDSEK | 9.4076 | 0.2291 | -1.2583 | -1.8904 | -3.8524 | -2.1296 | -7.6560 | -14.6612 | -8.4013 | 9.5706 | 9.6047 | 10.16 | 35.09 | -0.0250 |
| USD/NOK – U.S. Dollar / Norwegian Krone | USDNOK | 10.00 | 0.1412 | -0.7192 | -1.2764 | -3.1315 | -1.2637 | -8.3146 | -11.7131 | -5.7029 | 10.15 | 10.20 | 10.64 | 33.16 | -0.0354 |
| USD/DKK – U.S. Dollar / Danish Krone | USDDKK | 6.3932 | 0.3233 | -0.2356 | -0.5092 | -2.1567 | -2.4182 | -7.4773 | -10.7942 | -5.3224 | 6.3964 | 6.4831 | 6.7812 | 43.98 | -0.0051 |
| USD/MXN – U.S. Dollar / Mexican Peso | USDMXN | 18.76 | 0.6119 | 0.5844 | 0.4120 | -0.5540 | -2.4141 | -8.0508 | -9.0732 | -4.7696 | 18.71 | 19.07 | 19.73 | 50.13 | -0.0218 |
| USD/PLN – U.S. Dollar / Polish Zloty | USDPLN | 3.6534 | 0.4095 | -0.2199 | -0.3051 | -2.3603 | -2.5814 | -5.0068 | -11.0461 | -5.8761 | 3.6458 | 3.6986 | 3.8539 | 45.22 | -0.0025 |
| USD/HUF – U.S. Dollar / Hungarian Forint | USDHUF | 339.28 | 0.6733 | -0.1342 | -0.7741 | -3.0288 | -4.2790 | -8.0085 | -14.1073 | -4.5411 | 340.98 | 348.31 | 367.07 | 47.61 | -0.7903 |
| USD/CZK – U.S. Dollar / Czech Koruna | USDCZK | 20.94 | 0.4269 | -0.5340 | -0.9135 | -2.6274 | -4.1104 | -9.4514 | -13.3377 | -7.5554 | 21.06 | 21.49 | 22.65 | 44.84 | -0.0377 |
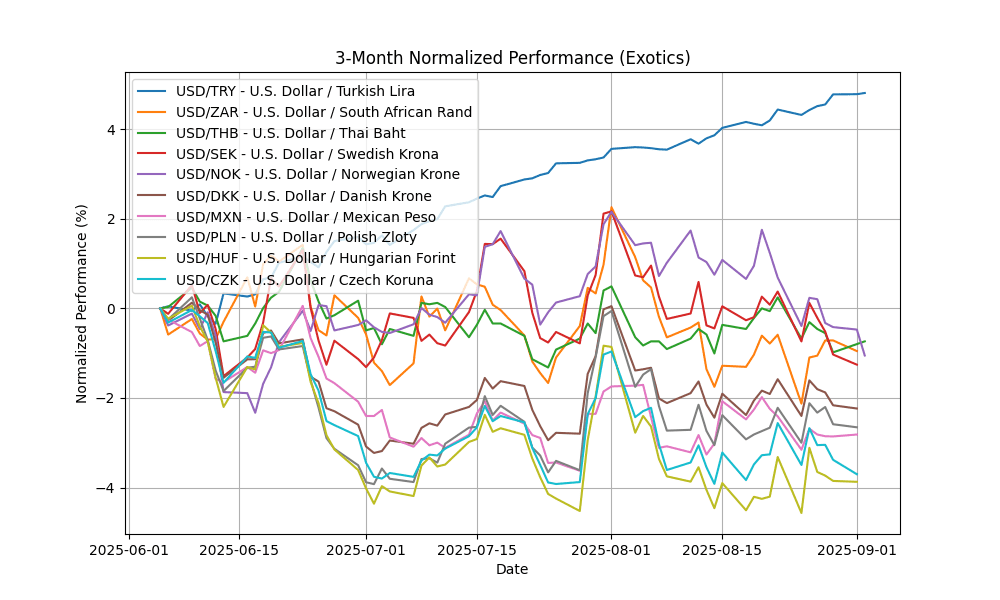
In the current analysis of key FX pairs, USD/TRY stands out with an RSI of 86.10, indicating extreme overbought conditions, supported by a positive MACD of 0.1908. This suggests potential for a corrective pullback. Conversely, USD/ZAR, USD/THB, USD/SEK, and USD/NOK exhibit bearish signals, with RSIs below 50, negative MACDs, and MA crossovers indicating downtrends. The oversold conditions in these pairs may present buying opportunities if fundamental factors align. Traders should remain cautious with USD/TRY due to its overbought status while monitoring the potential for reversals in the other pairs.


