## Forex and Global News
In the forex market today, the U.S. dollar (USD) faced mixed sentiment as the ongoing government shutdown continued to weigh on investor confidence. The GBP/USD pair struggled to maintain momentum, retreating below the 1.3500 level, while the EUR/USD remained stagnant around 1.1750, showing little reaction to the political turmoil in the U.S. Meanwhile, Japan’s yen (JPY) weakened significantly, driven by the election of conservative leader Sanae Takaichi, which propelled Japanese stocks to record highs and pushed the yen past the 150 mark against the USD.
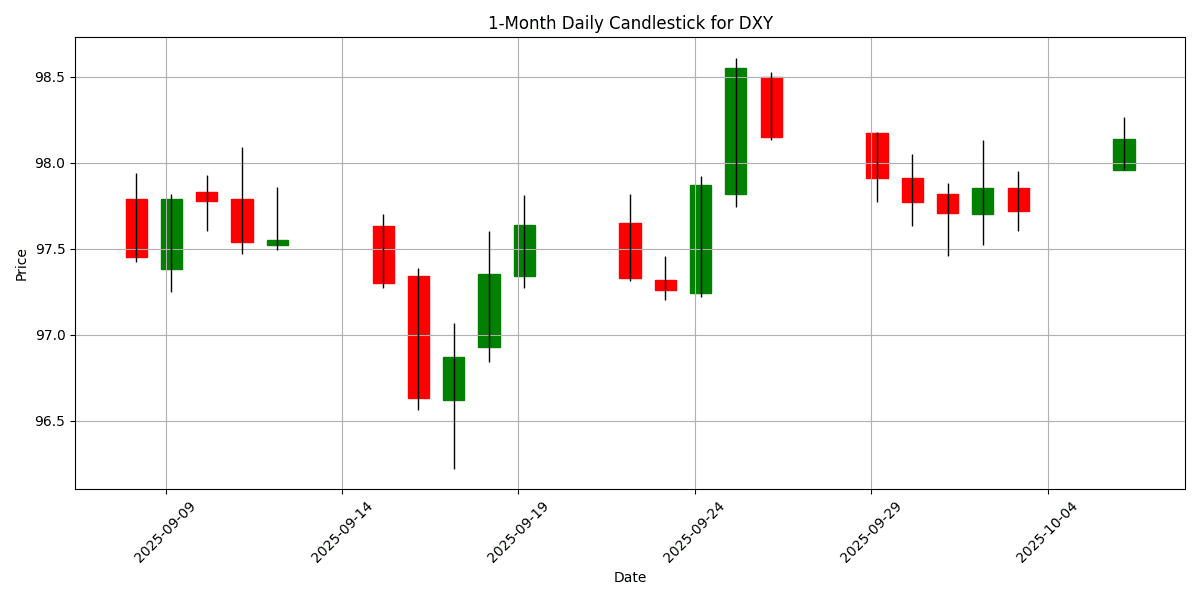
Gold (XAU/USD) continued its impressive rally, reaching an all-time high near $3,925 as safe-haven demand surged amidst U.S. political uncertainty. Analysts predict further gains could see gold approaching the $4,000 mark. The DXY index, which measures the dollar against a basket of currencies, was trading at 98.14, with a daily change of 0.0826%. Overall, geopolitical tensions and domestic political dynamics are shaping the forex landscape, influencing major currency movements and commodity prices.
## Economic Calendar Events Today
All times are in US Eastern Time (New York).
| Date | Time | Cur | Imp | Event | Actual | Forecast |
|---|---|---|---|---|---|---|
| 2025-10-06 | 03:15 | 🇪🇺 | Medium | ECB’s De Guindos Speaks | ||
| 2025-10-06 | 04:00 | 🇪🇺 | Medium | ECB’s Lane Speaks | ||
| 2025-10-06 | 04:30 | 🇬🇧 | Medium | S&P Global Construction PMI (Sep) | 46.1 | |
| 2025-10-06 | 13:00 | 🇪🇺 | Medium | ECB President Lagarde Speaks | ||
| 2025-10-06 | 13:30 | 🇬🇧 | Medium | BoE Gov Bailey Speaks | ||
| 2025-10-06 | 17:00 | 🇳🇿 | Medium | NZIER Business Confidence (Q3) | ||
| 2025-10-06 | 19:30 | 🇯🇵 | Medium | Household Spending (MoM) (Aug) | 0.1% | |
| 2025-10-06 | 19:30 | 🇯🇵 | Medium | Household Spending (YoY) (Aug) | 1.4% |
On October 6, 2025, several key economic events are set to influence the FX markets, particularly concerning the Euro (EUR) and British Pound (GBP).
At 03:15 and 04:00 ET, ECB Vice President Luis de Guindos and Chief Economist Philip Lane will deliver speeches. Market participants will be closely monitoring these addresses for insights into the ECB’s monetary policy stance, especially in light of recent inflation trends and economic growth concerns in the Eurozone.
At 04:30 ET, the S&P Global Construction PMI for September is expected to come in at 46.1 for the GBP. A reading below 50 indicates contraction, which could weigh on the Pound if confirmed, suggesting ongoing challenges in the UK construction sector.
Later, at 13:00 ET, ECB President Christine Lagarde’s speech will be pivotal, as any unexpected comments on interest rates or economic outlook could lead to volatility in the EUR.
BoE Governor Andrew Bailey speaks at 13:30 ET, where any hints on future rate hikes will be closely scrutinized for their potential impact on the GBP.
The session concludes with Japan’s household spending data at 19:30 ET, with forecasts of 0.1% MoM and 1.4% YoY, which could affect the JPY based on consumer spending trends. Overall, the day is poised for significant currency fluctuations based on these key events.
## Major FX Group
| Name | Symbol | Price | Daily (%) | 5D (%) | 1W (%) | 1M (%) | 3M (%) | 6M (%) | YTD (%) | 12M (%) | MA50 | MA100 | MA200 | RSI | MACD |
|---|---|---|---|---|---|---|---|---|---|---|---|---|---|---|---|
| EUR/USD – Euro / U.S. Dollar | EURUSD | 1.1711 | -0.0683 | -0.2117 | 0.0237 | 0.4640 | -0.2176 | 6.6532 | 12.54 | 6.1204 | 1.1681 | 1.1621 | 1.1183 | 45.37 | 0.0008 |
| USD/JPY – U.S. Dollar / Japanese Yen | USDJPY | 150.14 | 0.5445 | 1.4460 | 0.4899 | 1.1875 | 2.9097 | 2.9428 | -4.3683 | 2.2453 | 147.83 | 146.50 | 148.38 | 62.16 | 0.2749 |
| GBP/USD – British Pound / U.S. Dollar | GBPUSD | 1.3456 | 0.1563 | 0.0938 | 0.3562 | 0.0857 | -1.2303 | 5.1990 | 7.2268 | 2.4809 | 1.3465 | 1.3500 | 1.3144 | 39.13 | -0.0015 |
| USD/CHF – U.S. Dollar / Swiss Franc | USDCHF | 0.7973 | -0.0251 | 0.1382 | -0.0226 | -0.9725 | 0.0176 | -5.7186 | -11.7289 | -6.3993 | 0.8013 | 0.8053 | 0.8418 | 53.54 | -0.0009 |
| AUD/USD – Australian Dollar / U.S. Dollar | AUDUSD | 0.6618 | 0.4249 | 0.1104 | 0.9765 | 1.4719 | 1.7200 | 11.13 | 6.3987 | -3.3911 | 0.6546 | 0.6529 | 0.6411 | 41.03 | 0.0013 |
| USD/CAD – U.S. Dollar / Canadian Dollar | USDCAD | 1.3943 | -0.1504 | 0.1401 | 0.0344 | 0.9265 | 2.0322 | -2.1750 | -2.8349 | 2.9140 | 1.3820 | 1.3760 | 1.3992 | 74.54 | 0.0041 |
| NZD/USD – New Zealand Dollar / U.S. Dollar | NZDUSD | 0.5839 | 0.3437 | 0.7420 | 1.0521 | -0.2068 | -2.8098 | 5.8079 | 3.5336 | -6.0844 | 0.5893 | 0.5951 | 0.5843 | 32.04 | -0.0029 |
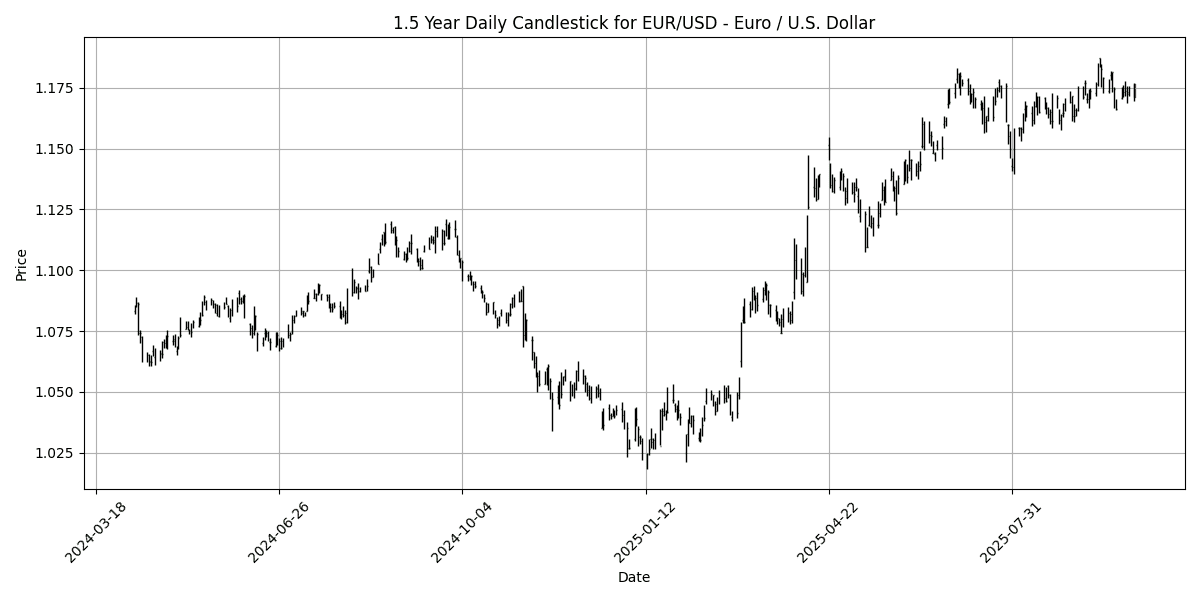
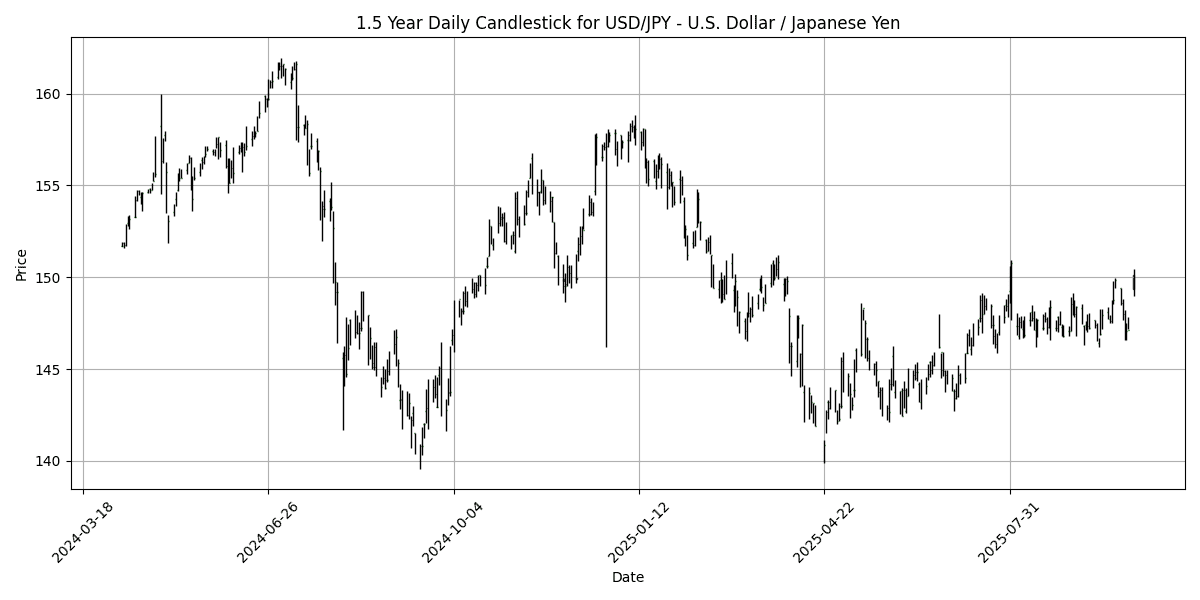
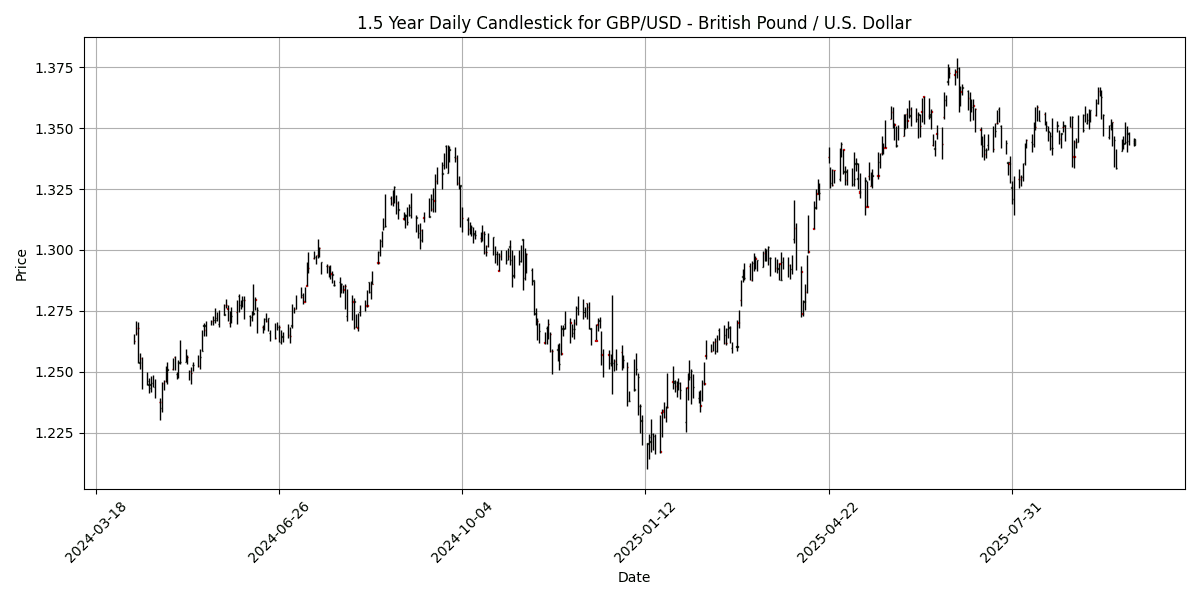
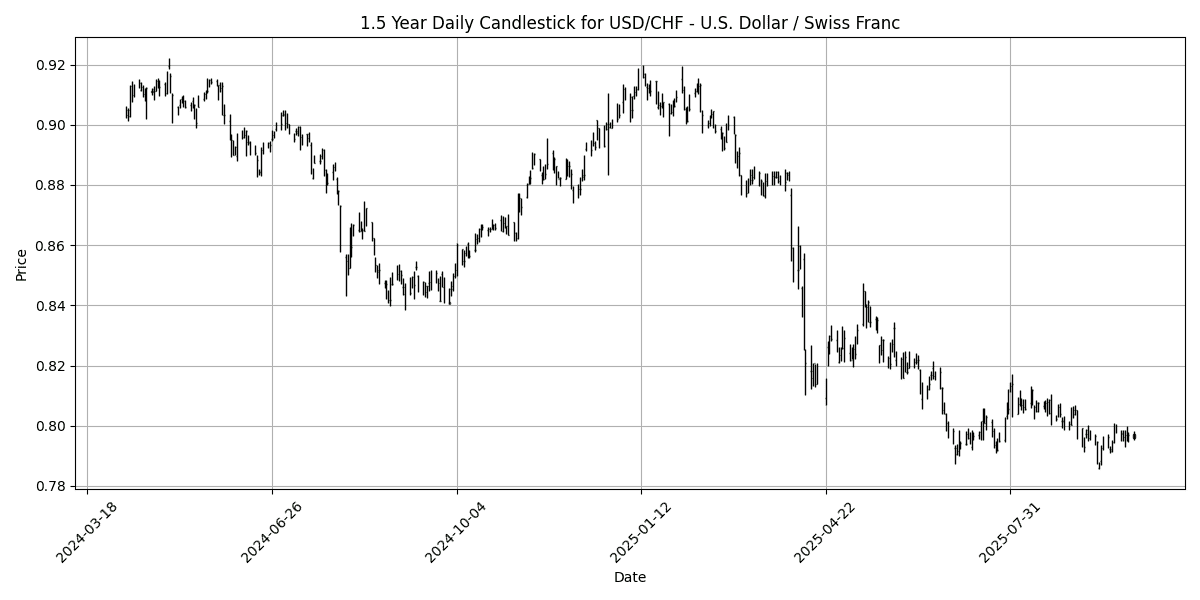
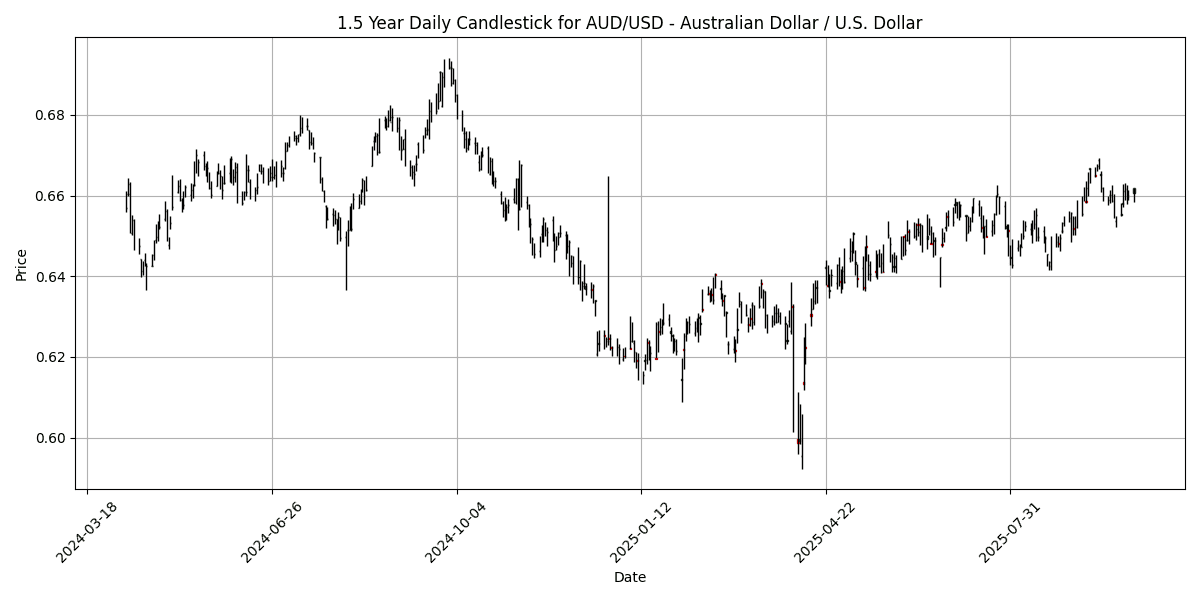
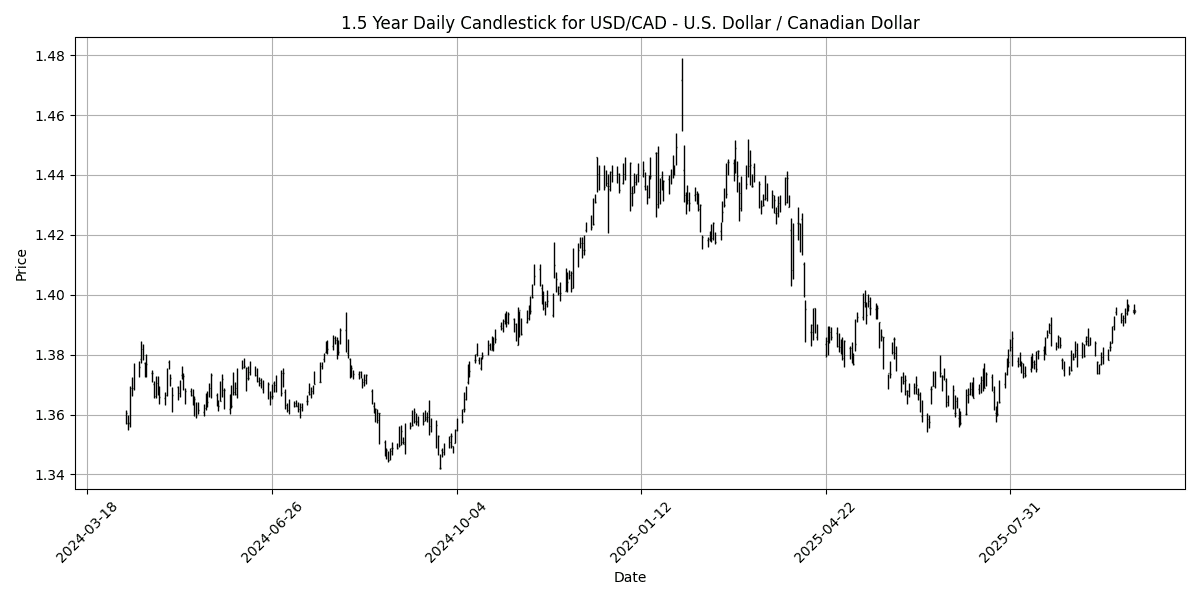

In the current forex landscape, the USD/CAD pair is exhibiting overbought conditions with an RSI of 74.54, indicating potential exhaustion in upward momentum. The positive MACD reinforces this bullish sentiment, although traders should monitor for a possible correction. Conversely, GBP/USD and AUD/USD are revealing oversold conditions with RSIs of 39.13 and 41.03, respectively, suggesting that these pairs may be primed for a rebound. The negative MACD readings in both pairs further signal bearish pressures, warranting caution among traders.
EUR/USD remains neutral with an RSI of 45.37 and a MACD close to zero, indicating a lack of clear direction. In contrast, the NZD/USD pair is significantly oversold, with an RSI of 32.04 and a negative MACD, highlighting potential opportunities for buyers. Overall, market participants should remain vigilant for potential reversals in these key pairs, particularly in the context of broader market trends and economic indicators.
## Cross FX Group
| Name | Symbol | Price | Daily (%) | 5D (%) | 1W (%) | 1M (%) | 3M (%) | 6M (%) | YTD (%) | 12M (%) | MA50 | MA100 | MA200 | RSI | MACD |
|---|---|---|---|---|---|---|---|---|---|---|---|---|---|---|---|
| EUR/GBP | EURGBP | 0.8700 | -0.2294 | -0.3368 | -0.3425 | 0.3449 | 0.9949 | 1.3395 | 4.9217 | 3.5135 | 0.8675 | 0.8608 | 0.8504 | 61.88 | 0.0016 |
| EUR/JPY | EURJPY | 175.77 | 0.4681 | 1.2074 | 0.5078 | 1.6282 | 2.6604 | 9.7602 | 7.5796 | 8.4725 | 172.67 | 170.26 | 165.75 | 63.96 | 0.4337 |
| EUR/CHF | EURCHF | 0.9333 | -0.1070 | -0.1327 | -0.0204 | -0.5509 | -0.2373 | 0.5115 | -0.7022 | -0.7138 | 0.9359 | 0.9357 | 0.9390 | 44.49 | -0.0005 |
| EUR/AUD | EURAUD | 1.7698 | -0.4612 | -0.2980 | -0.9326 | -0.9719 | -1.8844 | -4.0072 | 5.7734 | 9.8600 | 1.7845 | 1.7800 | 1.7433 | 55.61 | -0.0022 |
| GBP/JPY | GBPJPY | 202.04 | 0.7098 | 1.5517 | 0.8597 | 1.2869 | 1.6600 | 8.3216 | 2.5569 | 4.8008 | 199.04 | 197.77 | 194.86 | 57.30 | 0.1452 |
| GBP/CHF | GBPCHF | 1.0727 | 0.1307 | 0.2046 | 0.3273 | -0.8870 | -1.2138 | -0.8100 | -5.3514 | -4.0759 | 1.0788 | 1.0871 | 1.1045 | 36.11 | -0.0025 |
| AUD/JPY | AUDJPY | 99.31 | 0.9494 | 1.5128 | 1.4579 | 2.6280 | 4.6371 | 14.36 | 1.7281 | -1.2568 | 96.75 | 95.64 | 95.08 | 59.09 | 0.3637 |
| AUD/NZD | AUDNZD | 1.1332 | 0.0883 | -0.6427 | -0.0600 | 1.6669 | 4.6488 | 5.0202 | 2.7664 | 2.8508 | 1.1107 | 1.0971 | 1.0973 | 71.32 | 0.0076 |
| CHF/JPY | CHFJPY | 188.31 | 0.5742 | 1.3388 | 0.5312 | 2.1881 | 2.9073 | 9.2050 | 8.3483 | 9.2392 | 184.47 | 181.93 | 176.51 | 64.51 | 0.5592 |
| NZD/JPY | NZDJPY | 87.62 | 0.8669 | 2.1701 | 1.5190 | 0.9482 | -0.0114 | 8.9004 | -1.0235 | -4.0160 | 87.09 | 87.15 | 86.63 | 46.13 | -0.2625 |
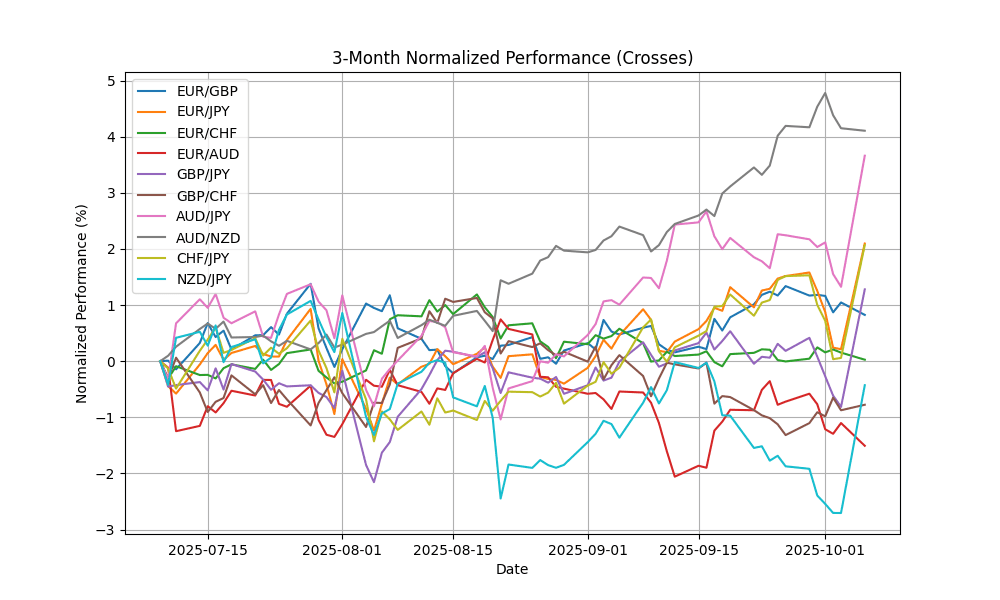
Currently, the EUR/GBP and EUR/JPY pairs show relatively neutral conditions, with RSI values below 70, indicating no overbought status. However, the AUD/NZD pair is approaching overbought territory with an RSI of 71.32, while its MACD remains positive, suggesting potential upward momentum. In contrast, GBP/CHF is notably oversold with an RSI of 36.11 and a negative MACD, indicating bearish pressure. The MA crossovers across these pairs suggest potential shifts in trend, particularly for GBP/CHF, which may present buying opportunities as it approaches a critical support level. Traders should monitor these indicators closely for further signals.
## Exotics and Emerging
| Name | Symbol | Price | Daily (%) | 5D (%) | 1W (%) | 1M (%) | 3M (%) | 6M (%) | YTD (%) | 12M (%) | MA50 | MA100 | MA200 | RSI | MACD |
|---|---|---|---|---|---|---|---|---|---|---|---|---|---|---|---|
| USD/TRY – U.S. Dollar / Turkish Lira | USDTRY | 41.69 | 0.0845 | 0.2624 | 0.3145 | 1.0772 | 4.2212 | 9.6922 | 18.09 | 21.81 | 41.10 | 40.38 | 38.64 | 94.14 | 0.1639 |
| USD/ZAR – U.S. Dollar / South African Rand | USDZAR | 17.25 | 0.0371 | -0.1272 | -0.5173 | -2.7795 | -3.3883 | -12.6893 | -8.0693 | -1.3338 | 17.57 | 17.68 | 18.09 | 42.86 | -0.0883 |
| USD/THB – U.S. Dollar / Thai Baht | USDTHB | 32.36 | -0.0926 | -0.3081 | 0.5281 | 0.2789 | -0.7971 | -7.2248 | -5.2110 | -2.2652 | 32.23 | 32.39 | 33.11 | 68.00 | 0.0569 |
| USD/SEK – U.S. Dollar / Swedish Krona | USDSEK | 9.3787 | -0.0948 | -0.4027 | -0.2542 | -0.7879 | -1.3568 | -6.2600 | -14.9234 | -8.8821 | 9.4821 | 9.5229 | 9.9588 | 58.20 | -0.0169 |
| USD/NOK – U.S. Dollar / Norwegian Krone | USDNOK | 9.9285 | -0.2992 | -0.5971 | -0.3100 | -1.4213 | -1.7671 | -9.2167 | -12.3514 | -6.3195 | 10.07 | 10.08 | 10.49 | 57.62 | -0.0232 |
| USD/DKK – U.S. Dollar / Danish Krone | USDDKK | 6.3754 | 0.0832 | 0.2495 | -0.0173 | -0.4429 | 0.2964 | -6.2331 | -11.0426 | -5.6825 | 6.3903 | 6.4222 | 6.6877 | 54.89 | -0.0040 |
| USD/MXN – U.S. Dollar / Mexican Peso | USDMXN | 18.43 | 0.0869 | 0.6507 | 0.4055 | -1.5636 | -1.1282 | -11.5339 | -10.6591 | -4.6676 | 18.59 | 18.77 | 19.50 | 55.02 | -0.0616 |
| USD/PLN – U.S. Dollar / Polish Zloty | USDPLN | 3.6303 | 0.0331 | -0.0781 | -0.3519 | -0.4085 | 0.3425 | -6.6553 | -11.6085 | -6.9944 | 3.6451 | 3.6622 | 3.7973 | 54.92 | -0.0016 |
| USD/HUF – U.S. Dollar / Hungarian Forint | USDHUF | 331.39 | 0.1088 | -0.1925 | -0.7360 | -1.6799 | -2.6841 | -10.6173 | -16.1055 | -8.8862 | 337.07 | 341.96 | 359.70 | 50.84 | -1.3830 |
| USD/CZK – U.S. Dollar / Czech Koruna | USDCZK | 20.71 | 0.0971 | 0.0111 | -0.1273 | -1.1923 | -1.2446 | -9.6457 | -14.2691 | -9.6828 | 20.90 | 21.15 | 22.24 | 51.94 | -0.0539 |
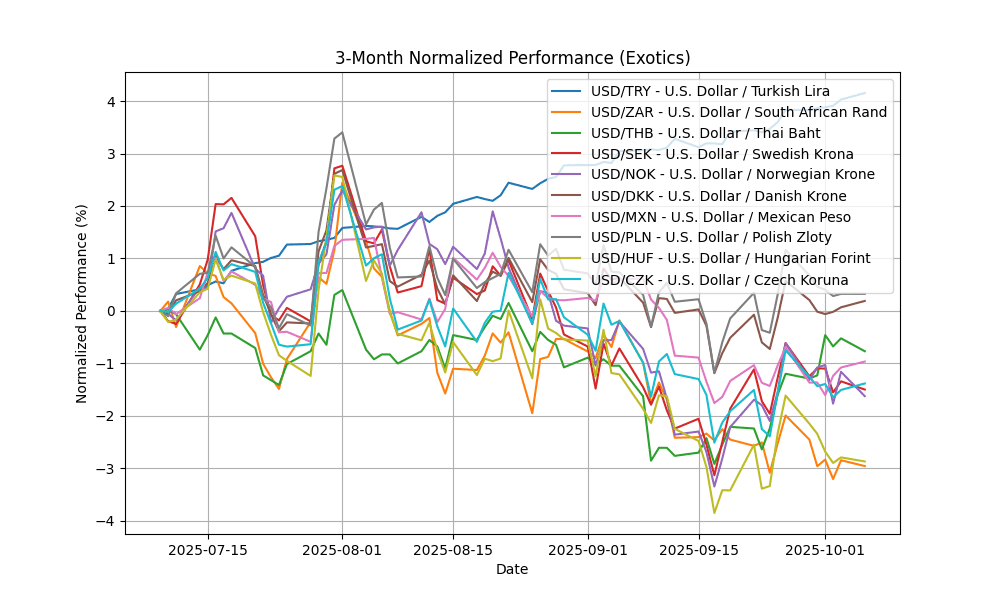
The USD/TRY is significantly overbought, with an RSI of 94.14 indicating extreme bullish momentum, supported by a positive MACD of 0.1639. This suggests potential for a corrective pullback. Conversely, the USD/ZAR remains in a neutral zone with an RSI of 42.86 and a negative MACD, indicating bearish pressure. Other pairs, including USD/THB (RSI 68.00), are approaching overbought territory but lack strong momentum indicators, while USD/SEK, USD/NOK, and USD/DKK exhibit neutral conditions. Monitoring these indicators will be crucial for identifying potential reversals or continuations in these key currency pairs.


