## Forex and Global News
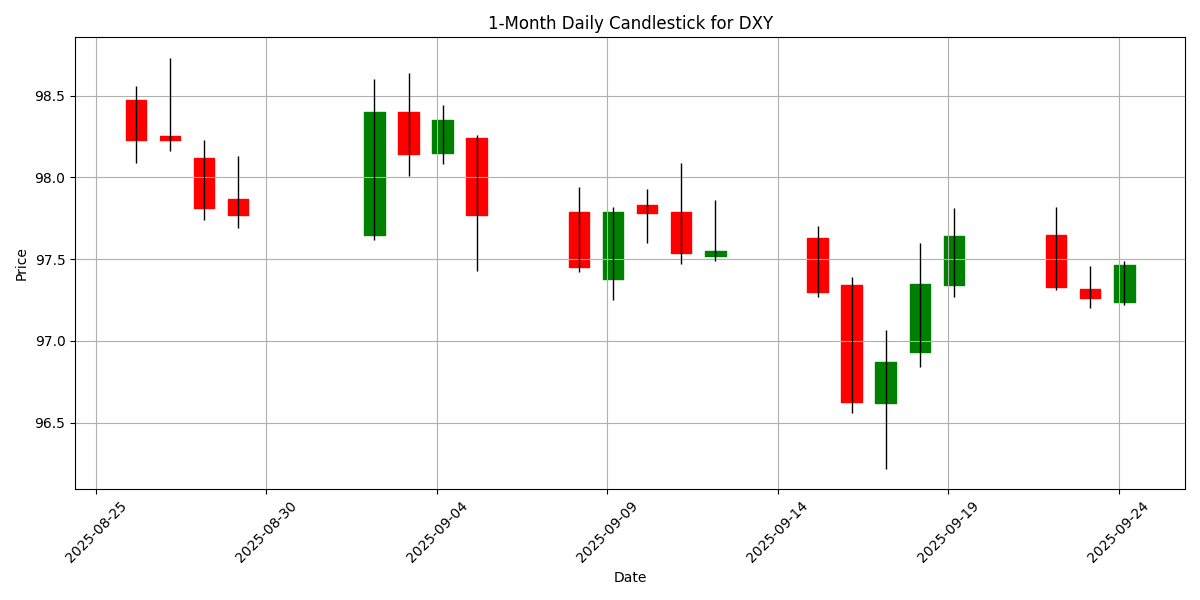
In the forex market today, sentiment remains cautious as the S&P 500 pulled back from record highs, reflecting concerns over elevated asset prices, as noted by Fed Chair Jerome Powell. The U.S. dollar (USD) is trading at 97.47, up 0.0996% on the day, amid mixed signals from the equity markets.
In Europe, defense stocks surged following comments from former President Trump regarding Ukraine, although overall European shares are expected to open lower. Meanwhile, Japanese equities continue to reach new highs, driven by reforms and foreign investment, despite lingering political risks.
In commodities, gold (XAU/USD) is showing signs of a “buy-on-dips” strategy as traders await further insights from upcoming Fed speeches. Geopolitical tensions are also influencing market dynamics, with Trump’s remarks on Ukraine and North Korea’s military ambitions adding to the complexity of global trade relations.
Overall, the forex market is navigating through a blend of economic indicators and geopolitical developments, impacting major currencies like the euro (EUR), Japanese yen (JPY), and British pound (GBP).
## Economic Calendar Events Today
All times are in US Eastern Time (New York).
| Date | Time | Cur | Imp | Event | Actual | Forecast |
|---|---|---|---|---|---|---|
| 2025-09-24 | 01:00 | 🇯🇵 | Medium | BoJ Core CPI (YoY) | 2.0% | 1.9% |
| 2025-09-24 | 03:00 | 🇪🇺 | Medium | German Buba Balz Speaks | ||
| 2025-09-24 | 03:00 | 🇪🇺 | Medium | European Central Bank Non-monetary Policy Meeting | ||
| 2025-09-24 | 04:00 | 🇪🇺 | Medium | German Business Expectations (Sep) | 92.0 | |
| 2025-09-24 | 04:00 | 🇪🇺 | Medium | German Current Assessment (Sep) | 86.5 | |
| 2025-09-24 | 04:00 | 🇪🇺 | Medium | German Ifo Business Climate Index (Sep) | 89.3 | |
| 2025-09-24 | 08:30 | 🇺🇸 | Medium | Building Permits (Aug) | 1.312M | |
| 2025-09-24 | 10:00 | 🇺🇸 | Medium | New Home Sales (MoM) (Aug) | ||
| 2025-09-24 | 10:00 | 🇺🇸 | High | New Home Sales (Aug) | 650K | |
| 2025-09-24 | 10:30 | 🇺🇸 | High | Crude Oil Inventories | ||
| 2025-09-24 | 10:30 | 🇺🇸 | Medium | Cushing Crude Oil Inventories | ||
| 2025-09-24 | 13:00 | 🇺🇸 | Medium | 5-Year Note Auction | ||
| 2025-09-24 | 16:10 | 🇺🇸 | Medium | FOMC Member Daly Speaks | ||
| 2025-09-24 | 19:50 | 🇯🇵 | Medium | Monetary Policy Meeting Minutes |
On September 24, 2025, key economic events will significantly influence FX markets, particularly concerning the Japanese Yen (JPY) and Euro (EUR).
At 01:00 ET, the Bank of Japan (BoJ) will release its Core CPI data, with expectations set at 1.9%. The actual figure of 2.0% suggests stronger inflationary pressures than anticipated, potentially supporting the JPY as traders reassess the BoJ’s monetary policy stance.
The European Central Bank (ECB) will hold a non-monetary policy meeting at 03:00 ET, although no forecasts are available. This event may provide insights into future policy directions, impacting the EUR. Following this, German Ifo Business Climate Index and other business sentiment indicators will be released at 04:00 ET, with expectations of 89.3. Any significant deviation could influence the EUR’s strength against other currencies.
In the U.S., housing data will be closely watched at 08:30 ET, with building permits forecasted at 1.312 million. The New Home Sales report at 10:00 ET, expected at 650K, will also be pivotal. Strong housing data could bolster the USD, while comments from FOMC Member Daly at 16:10 ET may provide additional insights into U.S. monetary policy. Overall, these events will shape currency movements throughout the trading day.
## Major FX Group
| Name | Symbol | Price | Daily (%) | 5D (%) | 1W (%) | 1M (%) | 3M (%) | 6M (%) | YTD (%) | 12M (%) | MA50 | MA100 | MA200 | RSI | MACD |
|---|---|---|---|---|---|---|---|---|---|---|---|---|---|---|---|
| EUR/USD – Euro / U.S. Dollar | EURUSD | 1.1792 | -0.2200 | 0.0080 | -0.6689 | 0.7037 | 0.9266 | 9.1751 | 13.32 | 6.1221 | 1.1677 | 1.1580 | 1.1131 | 61.49 | 0.0037 |
| USD/JPY – U.S. Dollar / Japanese Yen | USDJPY | 148.09 | 0.3245 | 0.0973 | 1.1461 | 0.5951 | 2.1994 | -1.8270 | -5.6715 | 3.1002 | 147.68 | 146.26 | 148.68 | 43.05 | 0.0286 |
| GBP/USD – British Pound / U.S. Dollar | GBPUSD | 1.3488 | -0.2809 | -0.5017 | -1.2152 | -0.1713 | -1.4890 | 4.1381 | 7.4818 | 1.0346 | 1.3471 | 1.3487 | 1.3110 | 53.92 | 0.0015 |
| USD/CHF – U.S. Dollar / Swiss Franc | USDCHF | 0.7929 | 0.2022 | 0.0492 | 0.8894 | -1.1667 | -1.3475 | -10.0408 | -12.2160 | -6.4226 | 0.8016 | 0.8088 | 0.8463 | 36.95 | -0.0032 |
| AUD/USD – Australian Dollar / U.S. Dollar | AUDUSD | 0.6620 | 0.2726 | 0.0317 | -1.0315 | 2.0833 | 1.4853 | 5.0528 | 6.4309 | -3.1329 | 0.6538 | 0.6514 | 0.6398 | 60.66 | 0.0031 |
| USD/CAD – U.S. Dollar / Canadian Dollar | USDCAD | 1.3857 | 0.1445 | 0.4727 | 0.8603 | 0.2039 | 1.0575 | -3.1487 | -3.4342 | 2.4206 | 1.3776 | 1.3759 | 1.4010 | 55.15 | 0.0003 |
| NZD/USD – New Zealand Dollar / U.S. Dollar | NZDUSD | 0.5855 | -0.1024 | -0.6161 | -2.2440 | -0.1775 | -3.3176 | 2.0673 | 3.8173 | -6.5770 | 0.5923 | 0.5959 | 0.5839 | 46.94 | -0.0008 |
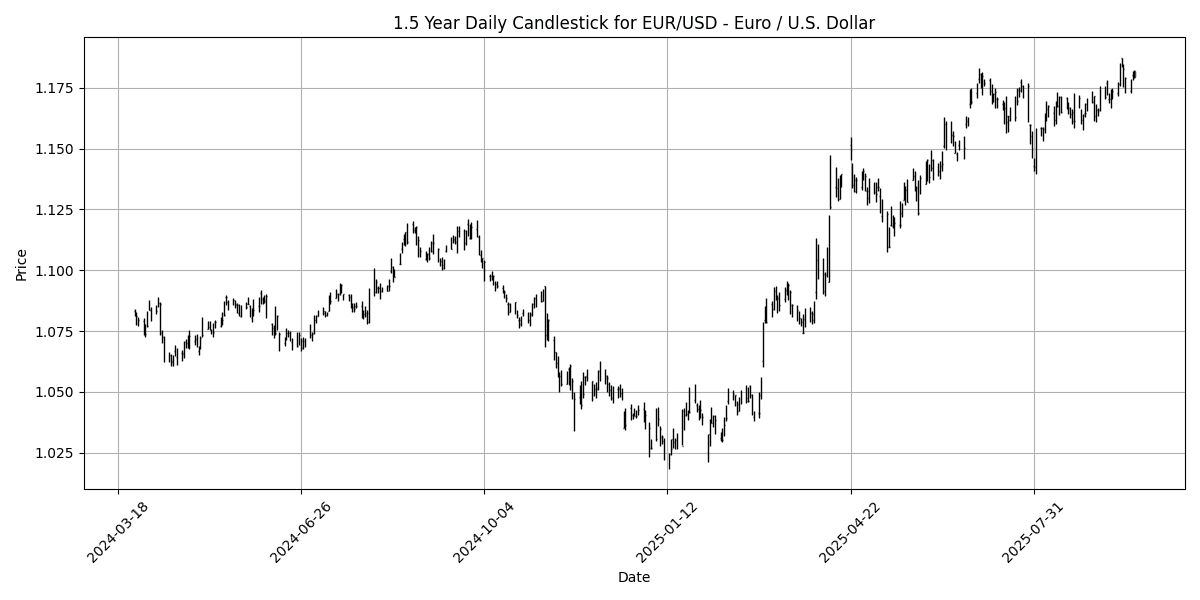
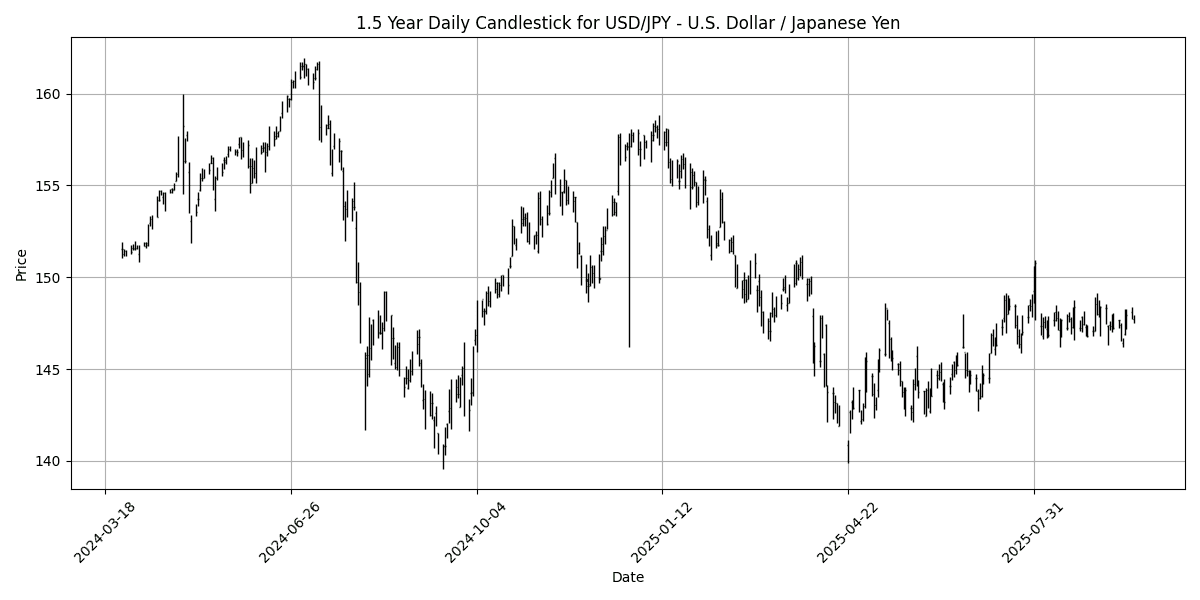
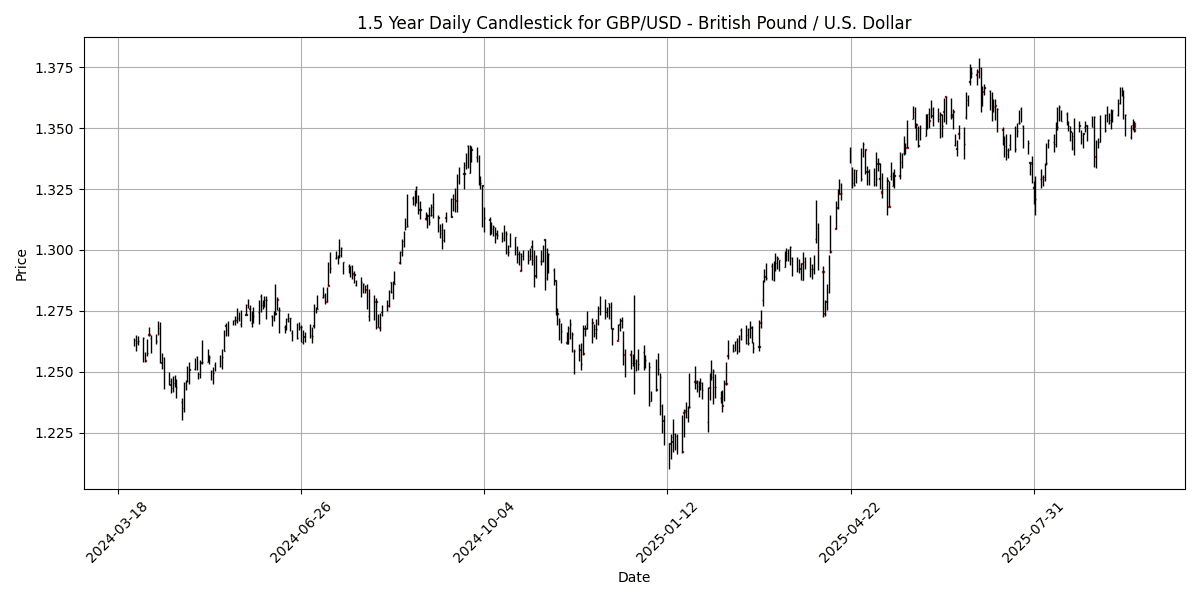
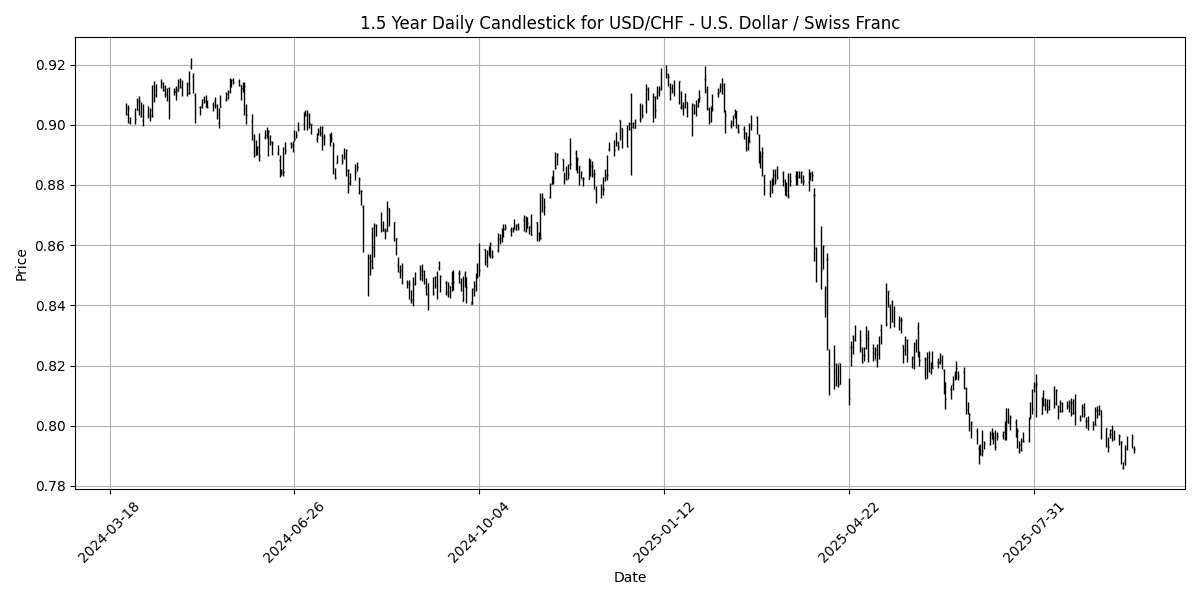
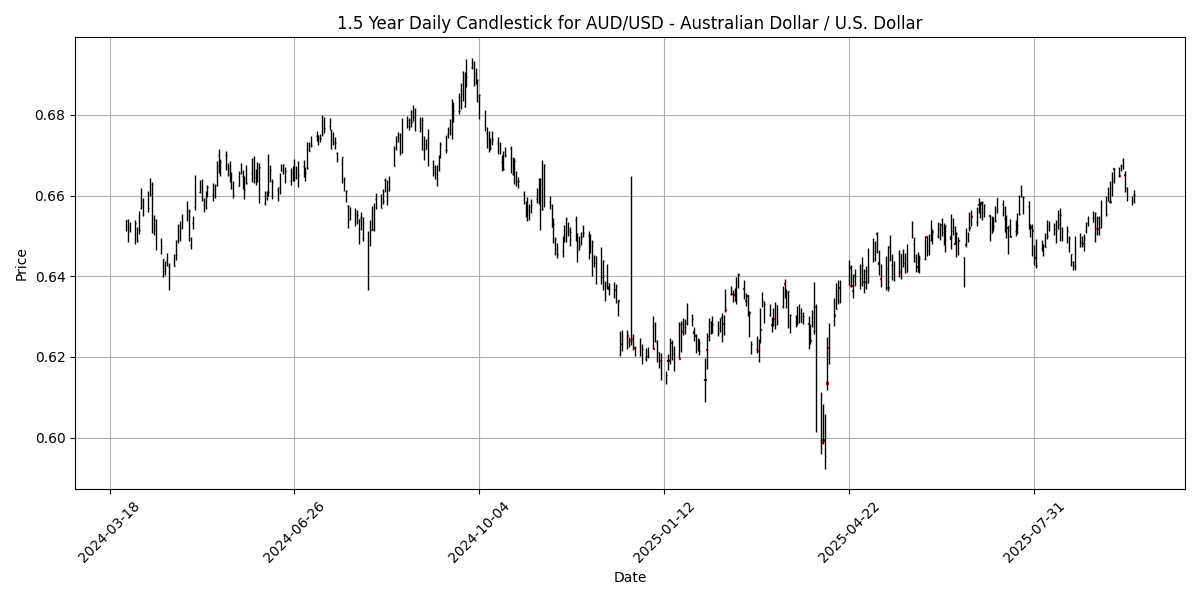
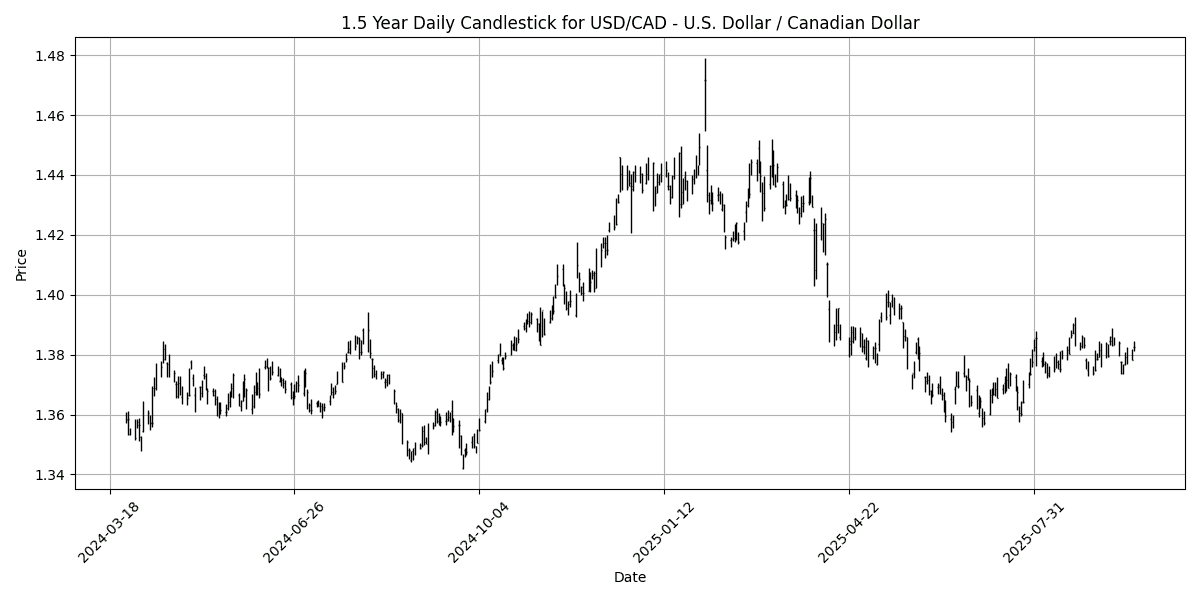

Analyzing the current market conditions for the specified FX pairs reveals a mixed sentiment.
The EUR/USD pair, with an RSI of 61.49 and a positive MACD of 0.0037, indicates a neutral to slightly bullish momentum, suggesting room for further upside but not in overbought territory.
In contrast, the USD/JPY shows an RSI of 43.05, reflecting a bearish sentiment, while its MACD remains positive, indicating potential for a rebound.
The GBP/USD pair’s RSI at 53.92 and MACD at 0.0015 suggest a stable outlook, with neither overbought nor oversold conditions.
Conversely, USD/CHF presents a bearish scenario with an RSI of 36.95 and a negative MACD, signaling a potential oversold condition, which may attract buyers soon.
The AUD/USD and USD/CAD pairs are in neutral territory, with RSIs of 60.66 and 55.15,
## Cross FX Group
| Name | Symbol | Price | Daily (%) | 5D (%) | 1W (%) | 1M (%) | 3M (%) | 6M (%) | YTD (%) | 12M (%) | MA50 | MA100 | MA200 | RSI | MACD |
|---|---|---|---|---|---|---|---|---|---|---|---|---|---|---|---|
| EUR/GBP | EURGBP | 0.8743 | 0.0916 | 0.5347 | 0.5625 | 0.8885 | 2.4610 | 4.8447 | 5.4402 | 5.0450 | 0.8667 | 0.8583 | 0.8484 | 59.29 | 0.0014 |
| EUR/JPY | EURJPY | 174.57 | 0.1003 | 0.0768 | 0.4407 | 1.2728 | 3.1165 | 7.1549 | 6.8427 | 9.3847 | 172.39 | 169.29 | 165.20 | 62.37 | 0.5837 |
| EUR/CHF | EURCHF | 0.9347 | -0.0107 | 0.0482 | 0.1908 | -0.4971 | -0.4643 | -1.8286 | -0.5532 | -0.7212 | 0.9357 | 0.9358 | 0.9391 | 41.74 | -0.0007 |
| EUR/AUD | EURAUD | 1.7814 | -0.4749 | 0.0045 | 0.3815 | -1.3315 | -0.5427 | 3.9354 | 6.4667 | 9.5646 | 1.7855 | 1.7768 | 1.7378 | 52.34 | -0.0027 |
| GBP/JPY | GBPJPY | 199.67 | 0.0180 | -0.4378 | -0.1141 | 0.3881 | 0.6543 | 2.2057 | 1.3558 | 4.1320 | 198.89 | 197.22 | 194.68 | 56.92 | 0.3475 |
| GBP/CHF | GBPCHF | 1.0692 | -0.0841 | -0.4673 | -0.3495 | -1.3526 | -2.8256 | -6.3461 | -5.6602 | -5.4726 | 1.0794 | 1.0901 | 1.1069 | 33.11 | -0.0030 |
| AUD/JPY | AUDJPY | 97.99 | 0.5892 | 0.0889 | 0.0602 | 2.6513 | 3.6941 | 3.1028 | 0.3790 | -0.1681 | 96.54 | 95.26 | 95.07 | 60.40 | 0.4734 |
| AUD/NZD | AUDNZD | 1.1305 | 0.3640 | 0.7217 | 1.2394 | 2.2619 | 4.9480 | 2.9215 | 2.5216 | 3.6728 | 1.1033 | 1.0928 | 1.0960 | 72.93 | 0.0059 |
| CHF/JPY | CHFJPY | 186.74 | 0.1099 | 0.0303 | 0.2448 | 1.7808 | 3.5859 | 9.1386 | 7.4449 | 10.17 | 184.22 | 180.87 | 175.91 | 64.19 | 0.7767 |
| NZD/JPY | NZDJPY | 86.67 | 0.2313 | -0.5359 | -1.1462 | 0.4074 | -1.2015 | 0.1896 | -2.0910 | -3.7052 | 87.48 | 87.15 | 86.73 | 44.29 | -0.0443 |
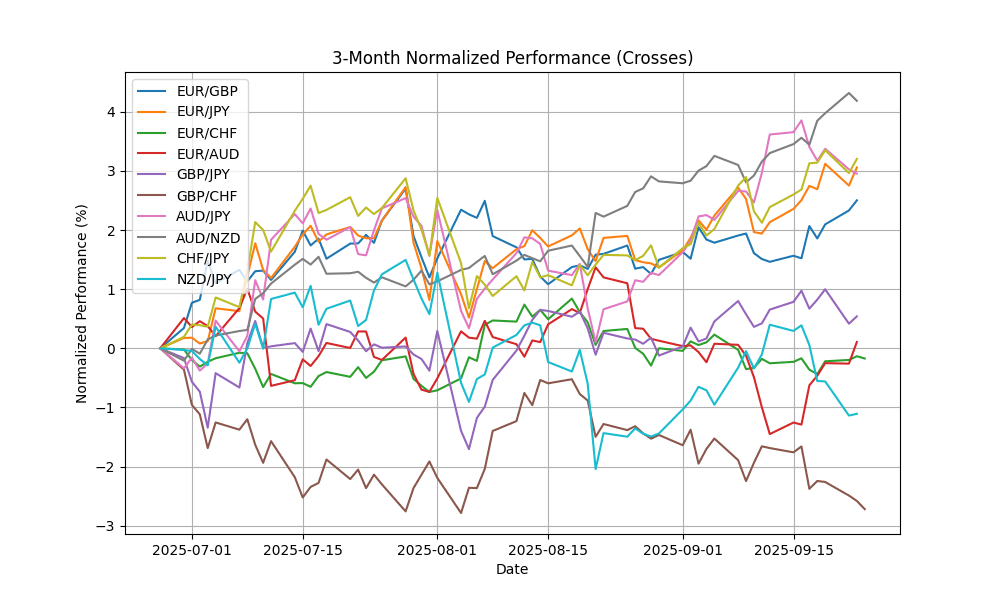
Currently, the AUD/NZD pair is showing overbought conditions with an RSI of 72.93, suggesting potential downside risk. In contrast, GBP/CHF is notably oversold at an RSI of 33.11, indicating possible bullish reversal opportunities. The MACD readings across most pairs are mixed, with EUR/JPY and CHF/JPY exhibiting positive momentum, while EUR/CHF and GBP/CHF show bearish signals. Moving average crossovers further support these trends, particularly in GBP/CHF, where the MA50 is below both MA100 and MA200, reinforcing its oversold status. Traders should monitor these indicators closely for potential entry or exit points in these key pairs.
## Exotics and Emerging
| Name | Symbol | Price | Daily (%) | 5D (%) | 1W (%) | 1M (%) | 3M (%) | 6M (%) | YTD (%) | 12M (%) | MA50 | MA100 | MA200 | RSI | MACD |
|---|---|---|---|---|---|---|---|---|---|---|---|---|---|---|---|
| USD/TRY – U.S. Dollar / Turkish Lira | USDTRY | 41.44 | 0.1239 | 0.1094 | 0.3273 | 1.1772 | 4.2353 | 9.0497 | 17.38 | 21.36 | 40.89 | 40.13 | 38.35 | 76.66 | 0.1511 |
| USD/ZAR – U.S. Dollar / South African Rand | USDZAR | 17.24 | -0.0418 | -0.6057 | -0.5899 | -1.1144 | -2.6298 | -5.3284 | -8.1514 | -0.5166 | 17.64 | 17.76 | 18.13 | 27.60 | -0.0965 |
| USD/THB – U.S. Dollar / Thai Baht | USDTHB | 31.90 | 0.2514 | 0.0314 | 0.7581 | -1.4215 | -1.8643 | -5.6492 | -6.5585 | -3.0984 | 32.24 | 32.47 | 33.19 | 37.75 | -0.1468 |
| USD/SEK – U.S. Dollar / Swedish Krona | USDSEK | 9.3674 | 0.3675 | 0.2534 | 1.5652 | -1.4625 | -0.9428 | -6.2187 | -15.0259 | -8.0871 | 9.5191 | 9.5515 | 10.03 | 41.97 | -0.0556 |
| USD/NOK – U.S. Dollar / Norwegian Krone | USDNOK | 9.9191 | 0.4405 | 0.5089 | 1.6861 | -1.4656 | -1.9004 | -5.3796 | -12.4344 | -5.3584 | 10.10 | 10.12 | 10.55 | 38.57 | -0.0737 |
| USD/DKK – U.S. Dollar / Danish Krone | USDDKK | 6.3315 | 0.2438 | 0.0122 | 0.6944 | -0.6658 | -0.8412 | -8.3427 | -11.6551 | -5.6715 | 6.3941 | 6.4481 | 6.7229 | 35.79 | -0.0201 |
| USD/MXN – U.S. Dollar / Mexican Peso | USDMXN | 18.36 | 0.0551 | -0.0468 | 0.3817 | -1.2783 | -2.8732 | -9.4981 | -11.0342 | -5.4586 | 18.64 | 18.87 | 19.58 | 22.69 | -0.0946 |
| USD/PLN – U.S. Dollar / Polish Zloty | USDPLN | 3.6139 | 0.2970 | 0.0122 | 1.0655 | -0.4862 | -0.5934 | -6.6941 | -12.0078 | -5.8856 | 3.6455 | 3.6761 | 3.8175 | 37.41 | -0.0114 |
| USD/HUF – U.S. Dollar / Hungarian Forint | USDHUF | 330.67 | 0.2921 | 0.3533 | 0.8026 | -1.8168 | -3.5711 | -11.0029 | -16.2870 | -6.8745 | 338.59 | 344.44 | 362.46 | 27.38 | -2.6386 |
| USD/CZK – U.S. Dollar / Czech Koruna | USDCZK | 20.56 | 0.2751 | -0.1845 | 0.4284 | -1.8559 | -2.8427 | -10.9304 | -14.8863 | -9.0382 | 20.96 | 21.28 | 22.39 | 30.60 | -0.1199 |
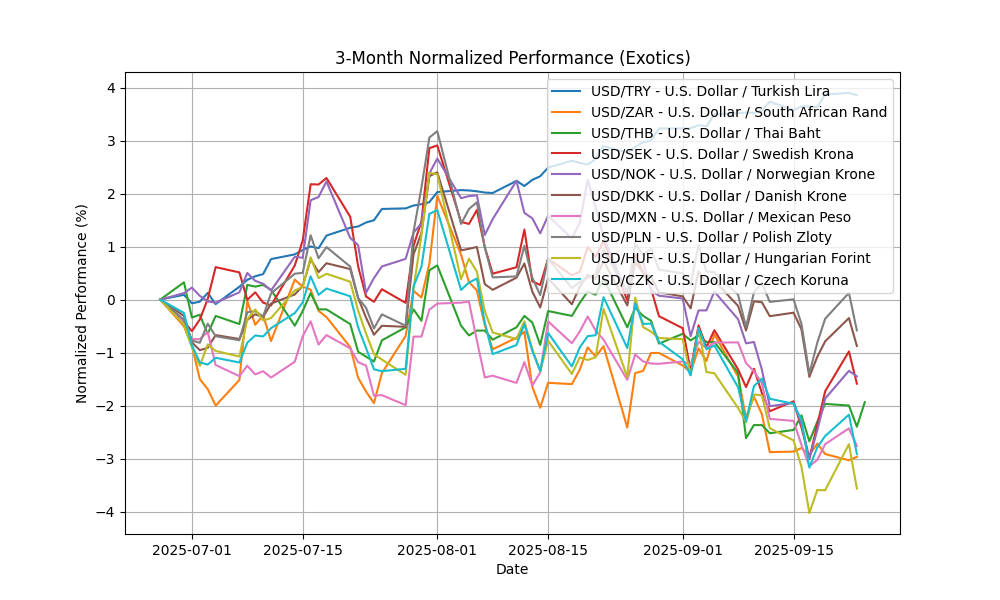
The analysis of current conditions reveals significant disparities among the selected FX pairs. The USD/TRY is markedly overbought, with an RSI of 76.66 and a positive MACD, indicating potential for a corrective pullback. Conversely, the USD/ZAR is deeply oversold at an RSI of 27.60, coupled with a negative MACD, suggesting a potential reversal or recovery opportunity. Other pairs, such as USD/MXN and USD/HUF, also exhibit oversold conditions, with RSIs below 30. Overall, traders should exercise caution with USD/TRY while monitoring the potential for upward momentum in USD/ZAR and other oversold pairs.


