## Forex and Global News
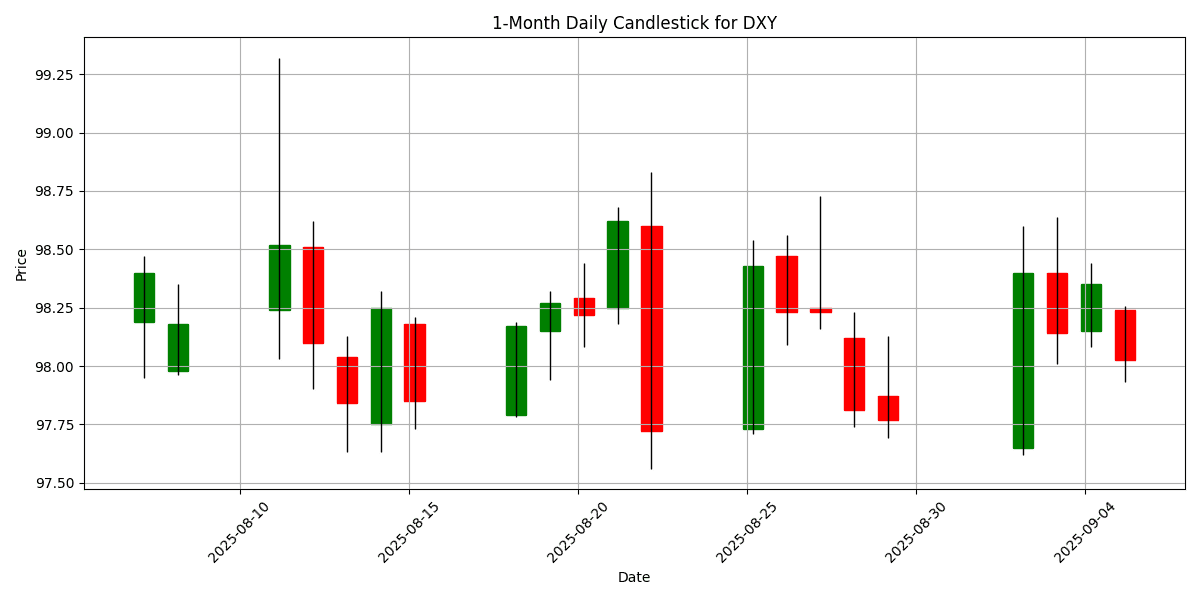
In the forex market today, key currencies are influenced by upcoming economic indicators and geopolitical tensions. The U.S. dollar (USD) remains under pressure as traders await the August jobs report, with the DXY index currently at 98.03, down 0.0938%. The euro (EUR) and British pound (GBP) are slightly stronger against the dollar as market sentiment leans towards risk appetite ahead of the data release.
Geopolitical events are also impacting market dynamics. Concerns over China’s military infrastructure developments near Taiwan have heightened tensions, potentially affecting the Japanese yen (JPY) as investors seek safe havens. Meanwhile, ongoing discussions around Ukraine’s security, with 26 nations agreeing to contribute, could further influence the euro and the dollar as European markets react.
Commodity prices, particularly oil, remain sensitive to these geopolitical developments, which may also affect currency valuations. As the market anticipates the jobs report, the overall sentiment reflects cautious optimism, with traders positioning themselves for potential volatility.
## Economic Calendar Events Today
All times are in US Eastern Time (New York).
| Date | Time | Cur | Imp | Event | Actual | Forecast |
|---|---|---|---|---|---|---|
| 2025-09-05 | 02:00 | 🇬🇧 | Medium | Core Retail Sales (MoM) (Jul) | 0.5% | 0.4% |
| 2025-09-05 | 02:00 | 🇬🇧 | Medium | Core Retail Sales (YoY) (Jul) | 1.3% | 1.2% |
| 2025-09-05 | 02:00 | 🇬🇧 | Medium | Halifax House Price Index (YoY) (Aug) | 2.2% | 2.0% |
| 2025-09-05 | 02:00 | 🇬🇧 | Medium | Halifax House Price Index (MoM) (Aug) | 0.3% | 0.2% |
| 2025-09-05 | 02:00 | 🇬🇧 | Medium | Retail Sales (MoM) (Jul) | 0.6% | 0.3% |
| 2025-09-05 | 02:00 | 🇬🇧 | Medium | Retail Sales (YoY) (Jul) | 1.1% | 1.3% |
| 2025-09-05 | 02:00 | 🇪🇺 | Medium | German Factory Orders (MoM) (Jul) | -2.9% | 0.5% |
| 2025-09-05 | 03:00 | 🇨🇭 | Medium | SECO Consumer Climate (Aug) | -40 | -37 |
| 2025-09-05 | 04:30 | 🇬🇧 | Medium | Mortgage Rate (GBP) (Aug) | 6.86% | |
| 2025-09-05 | 05:00 | 🇪🇺 | Medium | GDP (YoY) (Q2) | 1.5% | 1.4% |
| 2025-09-05 | 05:00 | 🇪🇺 | Medium | GDP (QoQ) (Q2) | 0.1% | 0.1% |
| 2025-09-05 | 08:30 | 🇺🇸 | High | Average Hourly Earnings (MoM) (Aug) | 0.3% | |
| 2025-09-05 | 08:30 | 🇺🇸 | Medium | Average Hourly Earnings (YoY) (YoY) (Aug) | 3.7% | |
| 2025-09-05 | 08:30 | 🇺🇸 | High | Nonfarm Payrolls (Aug) | 75K | |
| 2025-09-05 | 08:30 | 🇺🇸 | Medium | Participation Rate (Aug) | ||
| 2025-09-05 | 08:30 | 🇺🇸 | Medium | Private Nonfarm Payrolls (Aug) | 75K | |
| 2025-09-05 | 08:30 | 🇺🇸 | Medium | U6 Unemployment Rate (Aug) | ||
| 2025-09-05 | 08:30 | 🇺🇸 | High | Unemployment Rate (Aug) | 4.3% | |
| 2025-09-05 | 08:30 | 🇨🇦 | Medium | Employment Change (Aug) | 4.9K | |
| 2025-09-05 | 08:30 | 🇨🇦 | Medium | Unemployment Rate (Aug) | 7.0% | |
| 2025-09-05 | 10:00 | 🇨🇦 | Medium | Ivey PMI (Aug) | 53.1 | |
| 2025-09-05 | 13:00 | 🇺🇸 | Medium | U.S. Baker Hughes Oil Rig Count | 411 | |
| 2025-09-05 | 13:00 | 🇺🇸 | Medium | U.S. Baker Hughes Total Rig Count | ||
| 2025-09-05 | 15:30 | 🇬🇧 | Medium | CFTC GBP speculative net positions | ||
| 2025-09-05 | 15:30 | 🇺🇸 | Medium | CFTC Crude Oil speculative net positions | ||
| 2025-09-05 | 15:30 | 🇺🇸 | Medium | CFTC Gold speculative net positions | ||
| 2025-09-05 | 15:30 | 🇺🇸 | Medium | CFTC Nasdaq 100 speculative net positions | ||
| 2025-09-05 | 15:30 | 🇺🇸 | Medium | CFTC S&P 500 speculative net positions | ||
| 2025-09-05 | 15:30 | 🇦🇺 | Medium | CFTC AUD speculative net positions | ||
| 2025-09-05 | 15:30 | 🇧🇷 | Medium | CFTC BRL speculative net positions | ||
| 2025-09-05 | 15:30 | 🇯🇵 | Medium | CFTC JPY speculative net positions | ||
| 2025-09-05 | 15:30 | 🇪🇺 | Medium | CFTC EUR speculative net positions |
On September 5, 2025, several key economic indicators were released, significantly impacting the FX markets, particularly for the GBP and EUR.
At 02:00 ET, the UK reported stronger-than-expected retail sales data for July. Core Retail Sales MoM rose by 0.5%, surpassing the forecast of 0.4%, while Retail Sales MoM increased by 0.6% against an expected 0.3%. However, the Retail Sales YoY figure fell short of expectations at 1.1% versus 1.3%. The Halifax House Price Index also exceeded forecasts, with MoM growth of 0.3% and YoY growth at 2.2%. These positive indicators suggest resilience in the UK economy, likely supporting GBP strength.
In contrast, at 05:00 ET, the Eurozone’s GDP YoY growth came in at 1.5%, slightly above the forecast of 1.4%, while QoQ growth met expectations at 0.1%. However, German Factory Orders plummeted by 2.9%, sharply diverging from the anticipated 0.5% increase, potentially weighing on the EUR.
Later, the U.S. Nonfarm Payrolls and unemployment data at 08:30 ET will be closely monitored, as any surprises could significantly influence USD movements. Overall, the day’s data is likely to enhance GBP’s position while introducing uncertainty for the EUR.
## Major FX Group
| Name | Symbol | Price | Daily (%) | 5D (%) | 1W (%) | 1M (%) | 3M (%) | 6M (%) | YTD (%) | 12M (%) | MA50 | MA100 | MA200 | RSI | MACD |
|---|---|---|---|---|---|---|---|---|---|---|---|---|---|---|---|
| EUR/USD – Euro / U.S. Dollar | EURUSD | 1.1685 | 0.2660 | 0.0294 | 0.0294 | 0.9140 | 2.0182 | 8.3153 | 12.29 | 5.4560 | 1.1670 | 1.1528 | 1.1051 | 47.95 | 0.0010 |
| USD/JPY – U.S. Dollar / Japanese Yen | USDJPY | 148.23 | -0.1616 | 0.9824 | 0.9824 | 0.4554 | 3.2673 | 0.0837 | -5.5817 | 3.4244 | 147.11 | 145.68 | 148.91 | 51.83 | 0.1141 |
| GBP/USD – British Pound / U.S. Dollar | GBPUSD | 1.3470 | 0.2605 | -0.3045 | -0.3045 | 1.2823 | -0.8069 | 4.5377 | 7.3384 | 2.4744 | 1.3486 | 1.3457 | 1.3055 | 43.29 | 0.0003 |
| USD/CHF – U.S. Dollar / Swiss Franc | USDCHF | 0.8038 | -0.2358 | 0.2757 | 0.2757 | -0.3867 | -1.8859 | -9.0024 | -11.0093 | -4.9927 | 0.8017 | 0.8124 | 0.8520 | 44.43 | -0.0006 |
| AUD/USD – Australian Dollar / U.S. Dollar | AUDUSD | 0.6543 | 0.3528 | 0.1623 | 0.1623 | 1.0815 | 0.4992 | 3.3277 | 5.1929 | -2.5787 | 0.6522 | 0.6488 | 0.6388 | 55.18 | 0.0008 |
| USD/CAD – U.S. Dollar / Canadian Dollar | USDCAD | 1.3804 | -0.1158 | 0.3942 | 0.3942 | 0.2418 | 1.0046 | -3.4084 | -3.8035 | 2.1905 | 1.3734 | 1.3765 | 1.4028 | 47.44 | 0.0008 |
| NZD/USD – New Zealand Dollar / U.S. Dollar | NZDUSD | 0.5874 | 0.4274 | -0.1884 | -0.1884 | -0.5972 | -2.7853 | 2.3950 | 4.1542 | -5.0544 | 0.5952 | 0.5964 | 0.5834 | 40.77 | -0.0021 |
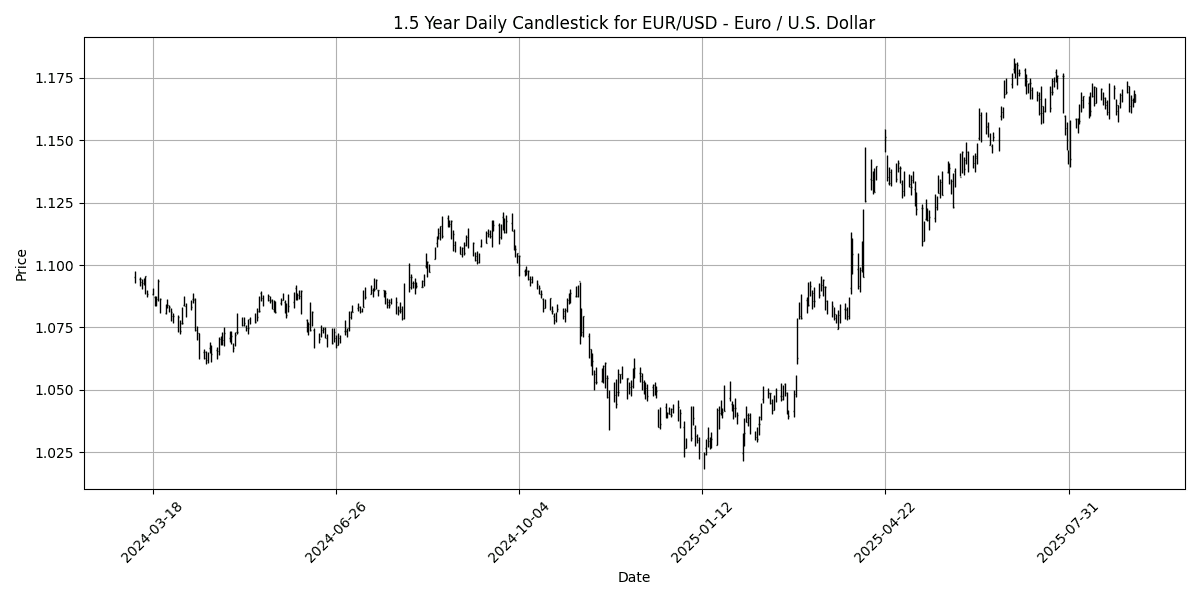
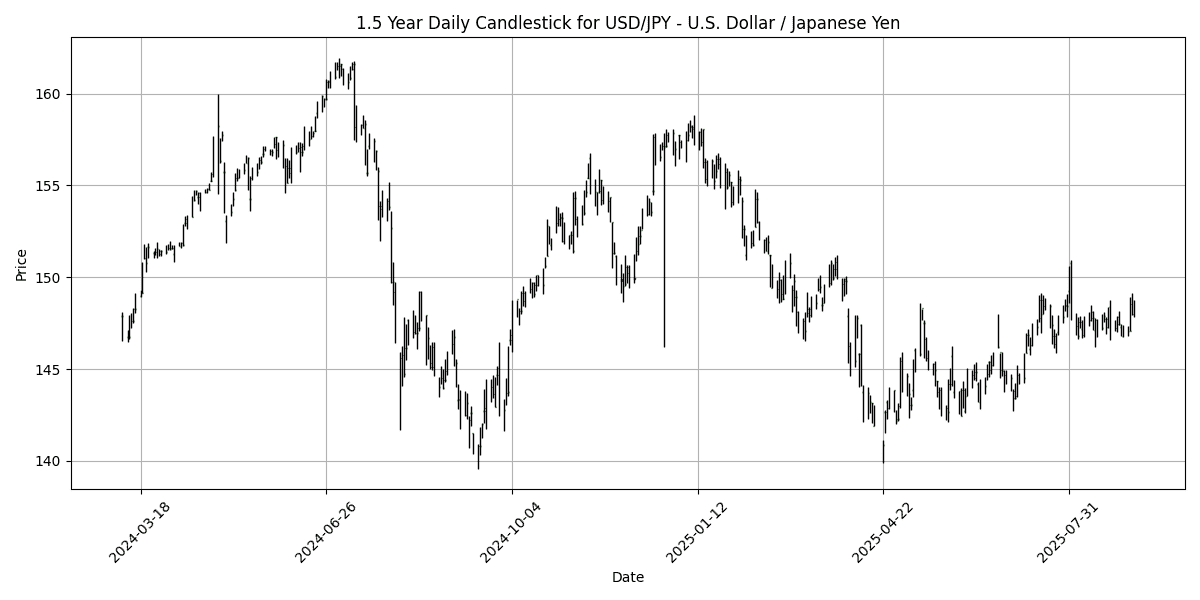
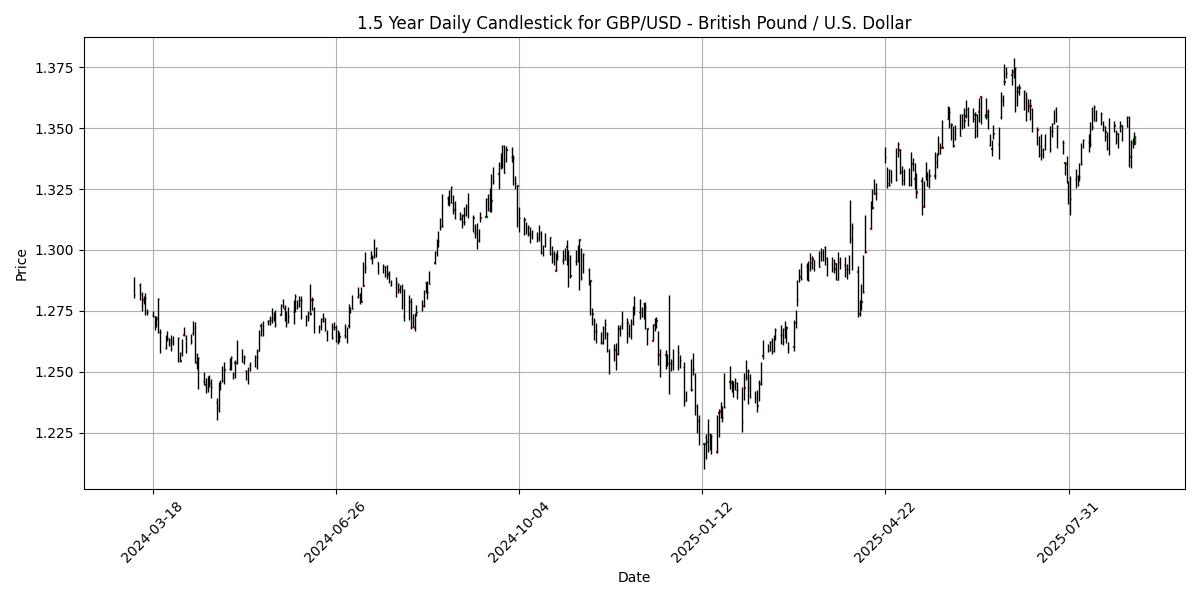
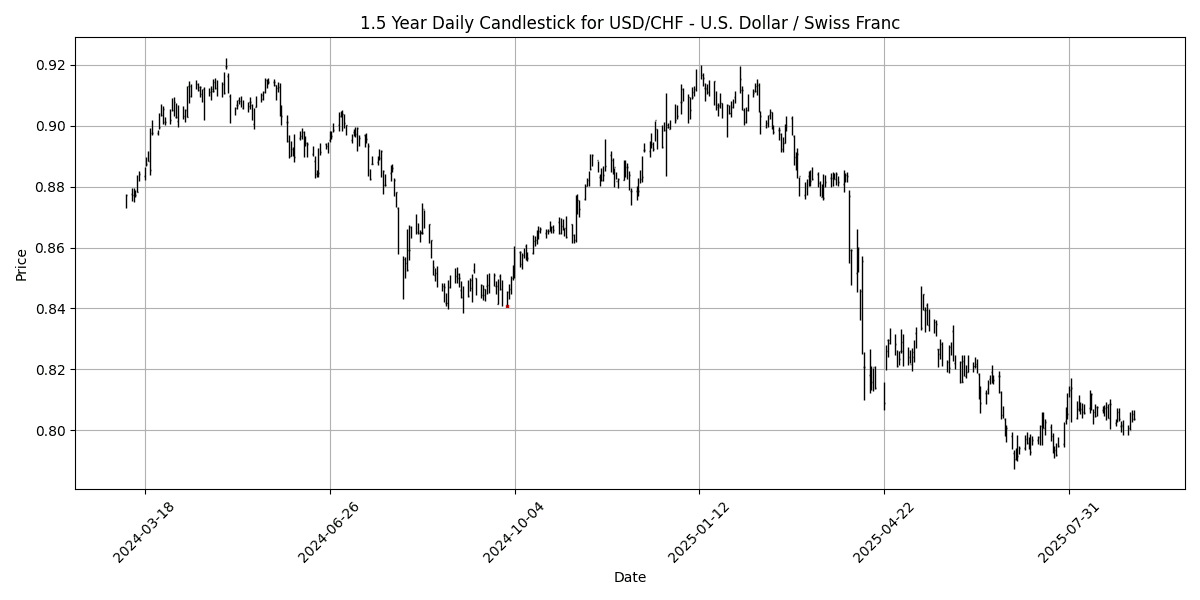
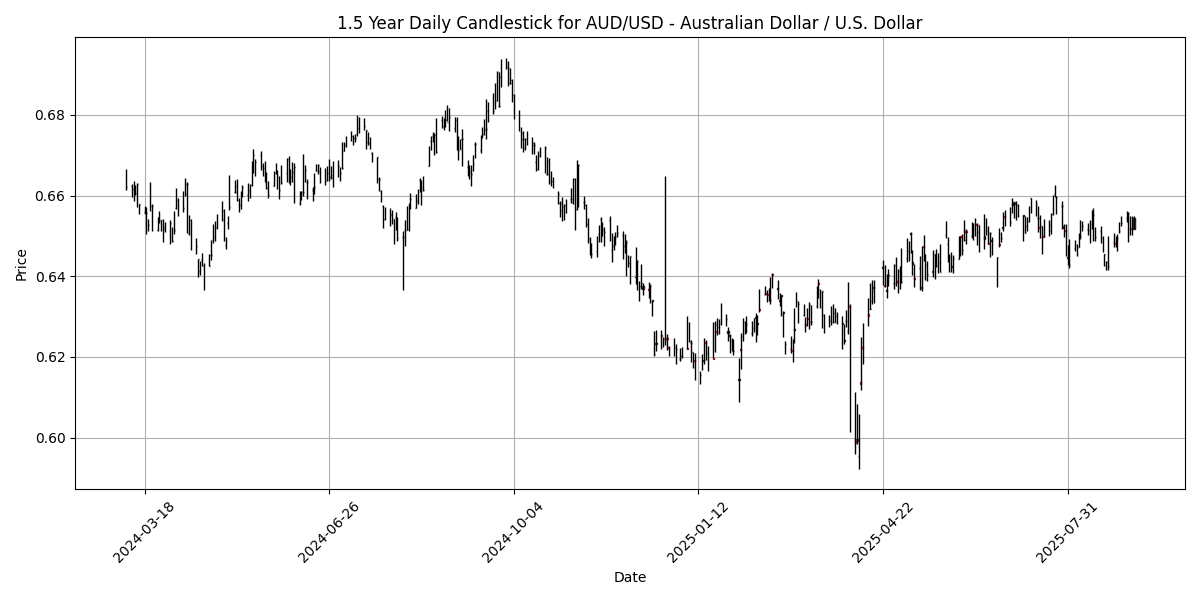
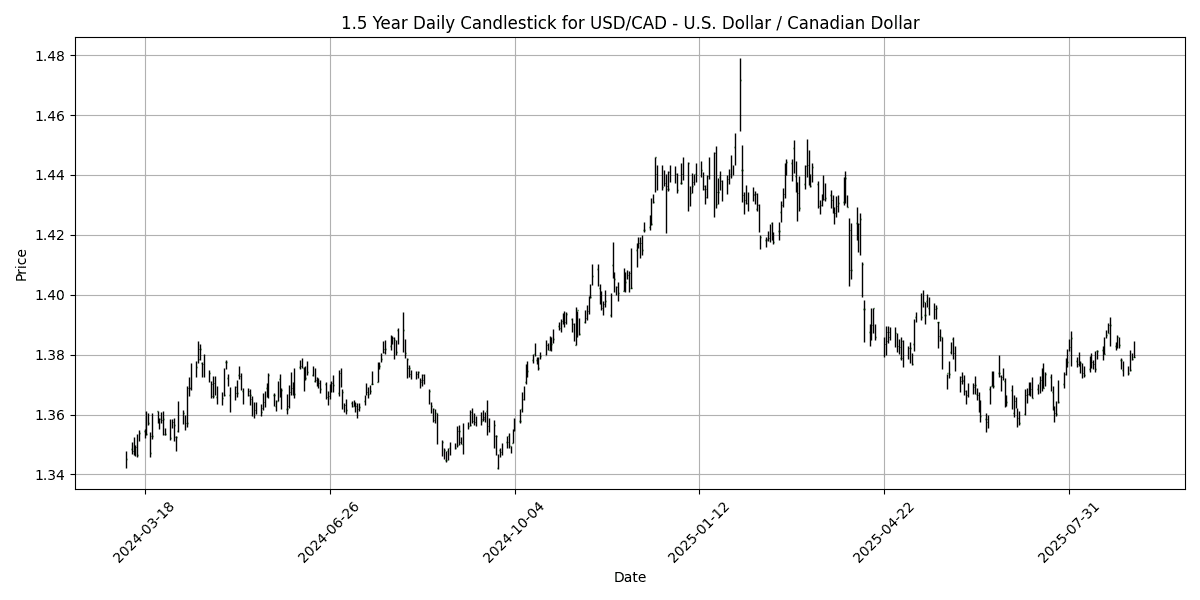
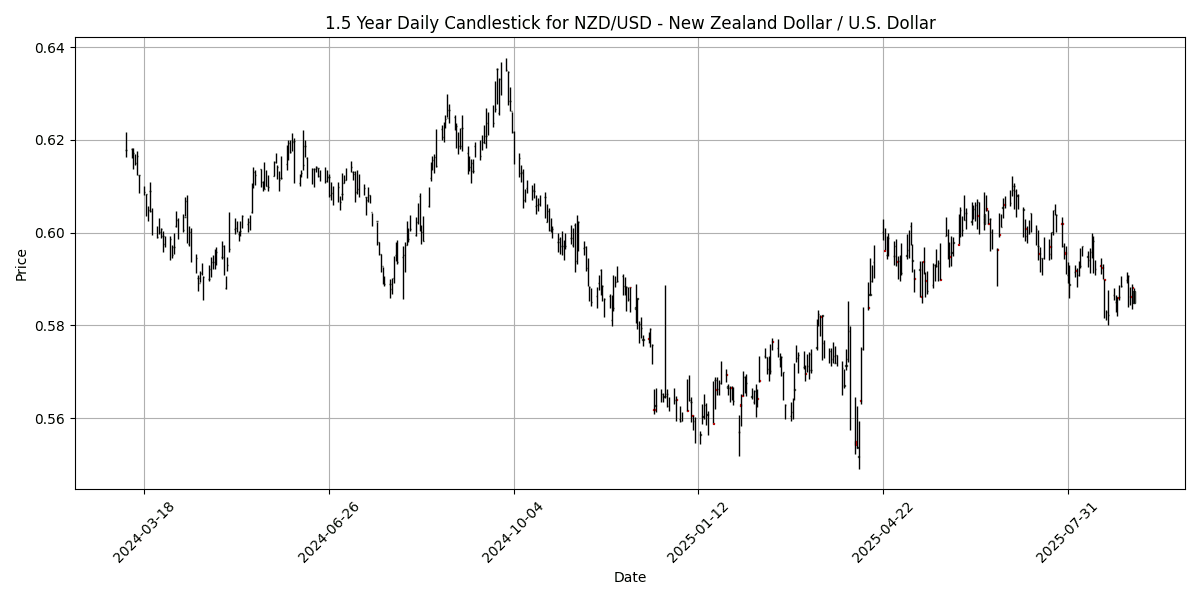
Current technical indicators suggest a generally neutral to slightly bearish sentiment across the key currency pairs analyzed. The EUR/USD pair shows an RSI of 47.95, indicating a lack of overbought or oversold conditions, while the MACD remains positive, suggesting potential for upward momentum. However, the moving averages indicate a bullish crossover may be necessary for a stronger trend.
In the USD/JPY pair, the RSI is at 51.83, also reflecting neutrality, with a positive MACD. This suggests stability but lacks clear directional bias. Conversely, GBP/USD and NZD/USD exhibit more bearish tendencies, with RSIs of 43.29 and 40.77, respectively, and negative MACD readings indicating potential for further declines.
USD/CHF and AUD/USD are similarly positioned, with RSIs suggesting slight bearishness. Overall, while some pairs show potential for recovery, caution is warranted given the lack of strong bullish signals across the board.
## Cross FX Group
| Name | Symbol | Price | Daily (%) | 5D (%) | 1W (%) | 1M (%) | 3M (%) | 6M (%) | YTD (%) | 12M (%) | MA50 | MA100 | MA200 | RSI | MACD |
|---|---|---|---|---|---|---|---|---|---|---|---|---|---|---|---|
| EUR/GBP | EURGBP | 0.8674 | 0.0346 | 0.3308 | 0.3308 | -0.3664 | 2.8603 | 3.6172 | 4.6081 | 2.9555 | 0.8650 | 0.8564 | 0.8459 | 64.88 | 0.0005 |
| EUR/JPY | EURJPY | 173.14 | 0.1099 | 0.9733 | 0.9733 | 1.3415 | 5.3188 | 8.3764 | 5.9705 | 9.0425 | 171.65 | 167.87 | 164.27 | 55.09 | 0.2652 |
| EUR/CHF | EURCHF | 0.9389 | 0.0320 | 0.2766 | 0.2766 | 0.4913 | 0.0629 | -1.4609 | -0.1064 | 0.1568 | 0.9354 | 0.9359 | 0.9388 | 42.58 | 0.0001 |
| EUR/AUD | EURAUD | 1.7858 | -0.0783 | -0.1281 | -0.1281 | -0.1627 | 1.5155 | 4.8355 | 6.7296 | 8.2441 | 1.7892 | 1.7766 | 1.7284 | 38.27 | -0.0005 |
| GBP/JPY | GBPJPY | 199.62 | 0.0897 | 0.6560 | 0.6560 | 1.7296 | 2.4075 | 4.6088 | 1.3330 | 5.9626 | 198.42 | 195.99 | 194.16 | 41.17 | 0.2001 |
| GBP/CHF | GBPCHF | 1.0825 | 0.0185 | -0.0416 | -0.0416 | 0.8779 | -2.7019 | -4.8862 | -4.4867 | -2.6529 | 1.0814 | 1.0929 | 1.1100 | 31.25 | -0.0005 |
| AUD/JPY | AUDJPY | 96.96 | 0.2036 | 1.1232 | 1.1232 | 1.5277 | 3.7671 | 3.3986 | -0.6781 | 0.7471 | 95.93 | 94.47 | 95.06 | 62.14 | 0.1743 |
| AUD/NZD | AUDNZD | 1.1137 | -0.0807 | 0.3371 | 0.3371 | 1.6818 | 3.3663 | 0.9016 | 0.9980 | 2.5944 | 1.0949 | 1.0873 | 1.0950 | 78.45 | 0.0052 |
| CHF/JPY | CHFJPY | 184.41 | 0.0820 | 0.7182 | 0.7182 | 0.8592 | 5.2699 | 9.9947 | 6.1049 | 8.8590 | 183.47 | 179.34 | 174.98 | 62.31 | 0.2670 |
| NZD/JPY | NZDJPY | 87.05 | 0.2765 | 0.7896 | 0.7896 | -0.1422 | 0.3921 | 2.4829 | -1.6640 | -1.7949 | 87.59 | 86.86 | 86.81 | 44.55 | -0.2498 |
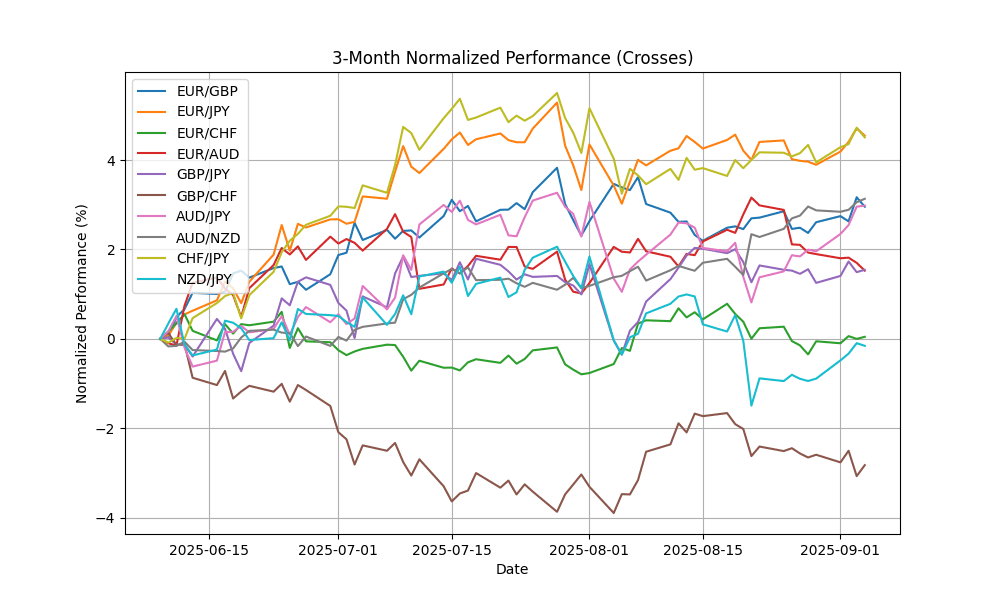
In the current analysis of key FX pairs, AUD/NZD is notably overbought with an RSI of 78.45, indicating potential for a corrective pullback. Conversely, GBP/CHF and EUR/AUD exhibit oversold conditions with RSIs of 31.25 and 38.27, respectively, suggesting possible bullish reversals. The MACD readings across pairs like EUR/JPY and CHF/JPY remain positive, reinforcing their bullish momentum. MA crossovers indicate strong support levels in pairs such as EUR/GBP and AUD/JPY, while GBP/JPY and EUR/CHF show bearish tendencies, warranting caution. Traders should closely monitor these indicators for potential trading opportunities.
## Exotics and Emerging
| Name | Symbol | Price | Daily (%) | 5D (%) | 1W (%) | 1M (%) | 3M (%) | 6M (%) | YTD (%) | 12M (%) | MA50 | MA100 | MA200 | RSI | MACD |
|---|---|---|---|---|---|---|---|---|---|---|---|---|---|---|---|
| USD/TRY – U.S. Dollar / Turkish Lira | USDTRY | 41.25 | 0.0116 | 0.2742 | 0.2742 | 1.4367 | 5.0170 | 13.06 | 16.85 | 21.20 | 40.55 | 39.75 | 37.92 | 82.46 | 0.1848 |
| USD/ZAR – U.S. Dollar / South African Rand | USDZAR | 17.68 | -0.4828 | 0.0206 | 0.0206 | -1.1575 | -0.1109 | -2.4222 | -5.7576 | -1.0283 | 17.72 | 17.92 | 18.17 | 54.05 | -0.0287 |
| USD/THB – U.S. Dollar / Thai Baht | USDTHB | 32.17 | -0.3716 | -0.2790 | -0.2790 | -0.5257 | -1.2887 | -4.5372 | -5.7676 | -5.2346 | 32.42 | 32.66 | 33.34 | 38.98 | -0.0511 |
| USD/SEK – U.S. Dollar / Swedish Krona | USDSEK | 9.4163 | -0.4735 | -0.6546 | -0.6546 | -2.6099 | -1.5598 | -7.3052 | -14.5823 | -7.8041 | 9.5650 | 9.5937 | 10.14 | 37.66 | -0.0413 |
| USD/NOK – U.S. Dollar / Norwegian Krone | USDNOK | 10.06 | -0.3320 | -0.0785 | -0.0785 | -1.9339 | -0.1142 | -7.6028 | -11.2249 | -5.4199 | 10.15 | 10.19 | 10.63 | 35.66 | -0.0415 |
| USD/DKK – U.S. Dollar / Danish Krone | USDDKK | 6.3891 | -0.2716 | -0.0069 | -0.0069 | -0.8563 | -1.9004 | -7.6015 | -10.8514 | -5.0978 | 6.3953 | 6.4770 | 6.7705 | 49.13 | -0.0048 |
| USD/MXN – U.S. Dollar / Mexican Peso | USDMXN | 18.69 | -0.1917 | 0.2346 | 0.2346 | -0.2094 | -2.3871 | -7.8112 | -9.3941 | -6.2899 | 18.70 | 19.02 | 19.70 | 42.64 | -0.0137 |
| USD/PLN – U.S. Dollar / Polish Zloty | USDPLN | 3.6382 | -0.2495 | -0.2420 | -0.2420 | -1.4866 | -2.5814 | -5.9198 | -11.4162 | -5.6562 | 3.6451 | 3.6948 | 3.8466 | 47.69 | -0.0022 |
| USD/HUF – U.S. Dollar / Hungarian Forint | USDHUF | 336.19 | -0.2954 | -0.9224 | -0.9224 | -2.1586 | -4.5189 | -9.1384 | -14.8906 | -5.1878 | 340.55 | 347.63 | 366.28 | 46.27 | -0.9147 |
| USD/CZK – U.S. Dollar / Czech Koruna | USDCZK | 20.91 | -0.3732 | -0.3323 | -0.3323 | -1.5165 | -3.3960 | -9.8428 | -13.4619 | -7.4414 | 21.04 | 21.45 | 22.60 | 47.60 | -0.0413 |
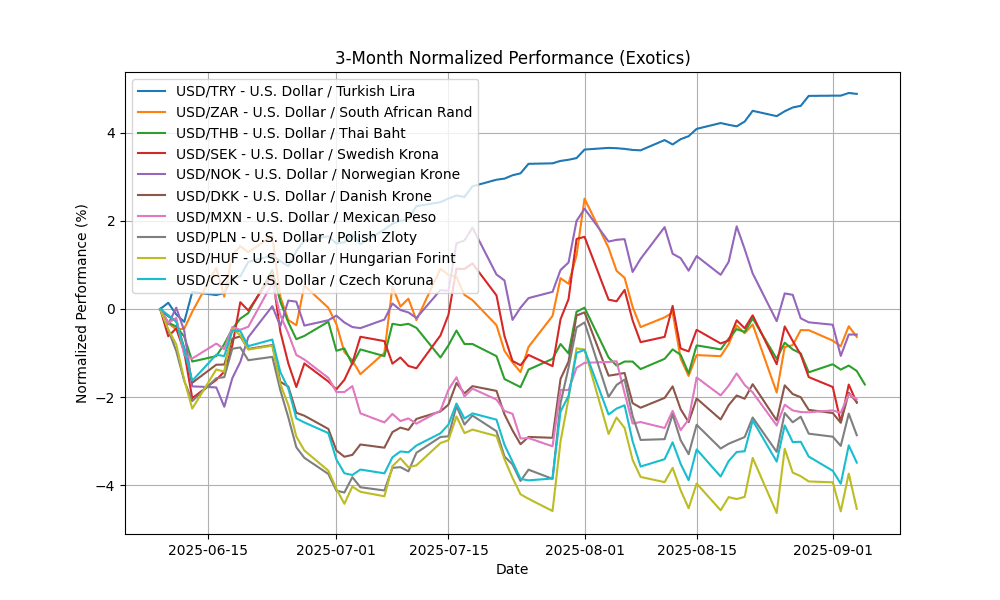
In the current forex landscape, USD/TRY is significantly overbought with an RSI of 82.46, indicating potential for a corrective pullback, despite a positive MACD of 0.1848. Conversely, USD/ZAR shows neutral conditions with an RSI of 54.05, while the negative MACD suggests bearish sentiment may emerge. The other pairs, including USD/THB, USD/SEK, and USD/NOK, are in oversold territories with RSIs below 40, coupled with negative MACDs, indicating potential for upward corrections. Monitoring MA crossovers will be crucial for identifying trend reversals, particularly in these oversold pairs. Overall, caution is advised with overbought USD/TRY.


