# Forex Report: USD rebounds as gold slips, GfK German Consumer data on the horizon, NZD/USD plummets.
## Forex and Global News
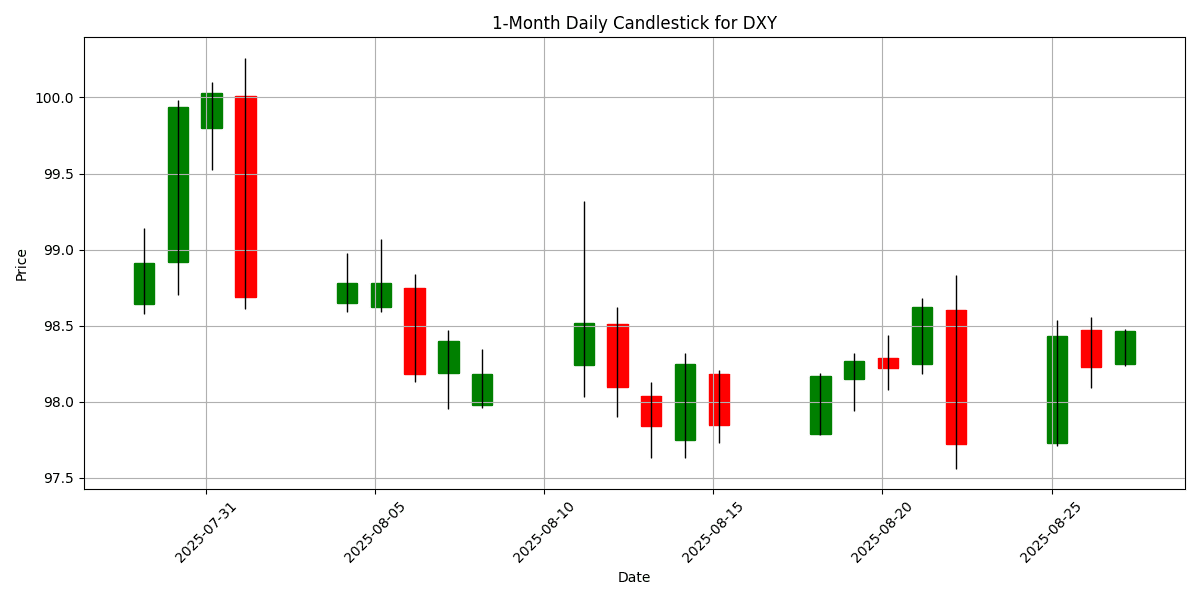
In today’s forex market, the USD showed a modest rebound, impacting gold prices, which fell from a two-week high to around $3,395 due to profit-taking. The EUR/USD pair dipped to approximately 1.1630 amid rising political uncertainty in France, contributing to a mixed sentiment in European markets, which opened higher ahead of Nvidia’s earnings report. The USD/CHF pair remained stable around 0.8050 as Federal Reserve Governor Lisa Cook prepared to defend her position against potential dismissal by President Trump. Meanwhile, WTI crude oil traded around $63.10 after a significant decline in the previous session, as traders awaited the impact of new U.S. tariffs on Indian exports. Overall, geopolitical tensions, including developments in Gaza and Ukraine, continue to influence market sentiment, though the focus remains on the upcoming tech earnings and their potential to sway broader market trends. The DXY is currently at 98.46, reflecting a daily change of 0.0762%.
## Economic Calendar Events Today
All times are in US Eastern Time (New York).
| Date | Time | Cur | Imp | Event | Actual | Forecast |
|---|---|---|---|---|---|---|
| 2025-08-27 | 02:00 | 🇪🇺 | Medium | GfK German Consumer Climate (Sep) | -23.6 | -21.5 |
| 2025-08-27 | 06:00 | 🇪🇺 | Medium | France Jobseekers Total (Jul) | ||
| 2025-08-27 | 08:30 | 🇨🇦 | Medium | Wholesale Sales (MoM) (Jul) | ||
| 2025-08-27 | 10:30 | 🇺🇸 | High | Crude Oil Inventories | -2.000M | |
| 2025-08-27 | 10:30 | 🇺🇸 | Medium | Cushing Crude Oil Inventories | ||
| 2025-08-27 | 12:00 | 🇷🇺 | Medium | GDP Monthly (YoY) (Jun) | ||
| 2025-08-27 | 12:00 | 🇷🇺 | Medium | Retail Sales (YoY) (Jul) | 1.8% | |
| 2025-08-27 | 12:00 | 🇷🇺 | Medium | Unemployment Rate (Jul) | 2.2% | |
| 2025-08-27 | 13:00 | 🇺🇸 | Medium | 5-Year Note Auction | ||
| 2025-08-27 | 21:30 | 🇦🇺 | Medium | Private New Capital Expenditure (QoQ) (Q2) | 0.8% | |
| 2025-08-27 | 21:30 | 🇯🇵 | Medium | BoJ Board Member Nakagawa Speaks |
On August 27, 2025, key economic data releases are set to impact the foreign exchange (FX) markets, particularly concerning the euro (EUR) and the US dollar (USD).
At 02:00 ET, the GfK German Consumer Climate for September reported a significant decline at -23.6, deviating from the forecast of -21.5. This unexpected drop suggests worsening consumer sentiment in Germany, potentially exerting downward pressure on the EUR as traders reassess growth expectations in the Eurozone.
The USD will be closely monitored at 10:30 ET with the release of Crude Oil Inventories, expected to show a decline of 2.000 million barrels. A larger-than-anticipated decrease could support the USD due to the implications for energy prices and inflation.
Additionally, the Russian ruble (RUB) will be influenced by the release of retail sales data and unemployment figures at 12:00 ET. The forecast for retail sales stands at 1.8%, and any deviation could significantly affect RUB valuations.
Overall, traders should be alert to potential volatility in the EUR and RUB, while the USD may find support from oil inventory data, shaping the FX landscape throughout the trading session.
## Major FX Group
| Name | Symbol | Price | Daily (%) | 5D (%) | 1W (%) | 1M (%) | 3M (%) | 6M (%) | YTD (%) | 12M (%) | MA50 | MA100 | MA200 | RSI | MACD |
|---|---|---|---|---|---|---|---|---|---|---|---|---|---|---|---|
| EUR/USD – Euro / U.S. Dollar | EURUSD | 1.1608 | -0.3263 | -0.0435 | -0.2966 | -1.2658 | 3.3321 | 11.67 | 11.55 | 3.9705 | 1.1656 | 1.1491 | 1.1011 | 45.32 | 0.0003 |
| USD/JPY – U.S. Dollar / Japanese Yen | USDJPY | 147.88 | 0.3052 | -0.3444 | 0.0975 | 0.0419 | 1.4949 | -1.4245 | -5.8091 | 2.3243 | 146.86 | 145.55 | 149.13 | 54.37 | 0.1915 |
| GBP/USD – British Pound / U.S. Dollar | GBPUSD | 1.3449 | -0.2226 | 0.2206 | -0.2802 | 0.0606 | 0.1305 | 6.7474 | 7.1710 | 1.9501 | 1.3496 | 1.3421 | 1.3025 | 57.20 | 0.0005 |
| USD/CHF – U.S. Dollar / Swiss Franc | USDCHF | 0.8057 | 0.2738 | -0.3673 | -0.2563 | 1.2988 | -3.2250 | -10.4698 | -10.7989 | -4.8873 | 0.8029 | 0.8145 | 0.8546 | 49.64 | 0.0005 |
| AUD/USD – Australian Dollar / U.S. Dollar | AUDUSD | 0.6480 | -0.2924 | 0.8482 | 0.3935 | -1.4146 | 0.8528 | 3.9761 | 4.1801 | -4.3247 | 0.6516 | 0.6463 | 0.6387 | 46.65 | -0.0013 |
| USD/CAD – U.S. Dollar / Canadian Dollar | USDCAD | 1.3851 | 0.1301 | -0.3554 | -0.1082 | 1.0867 | -0.0007 | -4.1022 | -3.4760 | 2.7362 | 1.3725 | 1.3786 | 1.4036 | 61.74 | 0.0039 |
| NZD/USD – New Zealand Dollar / U.S. Dollar | NZDUSD | 0.5835 | -0.4776 | 0.2179 | -1.0629 | -3.0620 | -2.0823 | 3.6926 | 3.4627 | -5.9707 | 0.5971 | 0.5953 | 0.5834 | 36.98 | -0.0035 |
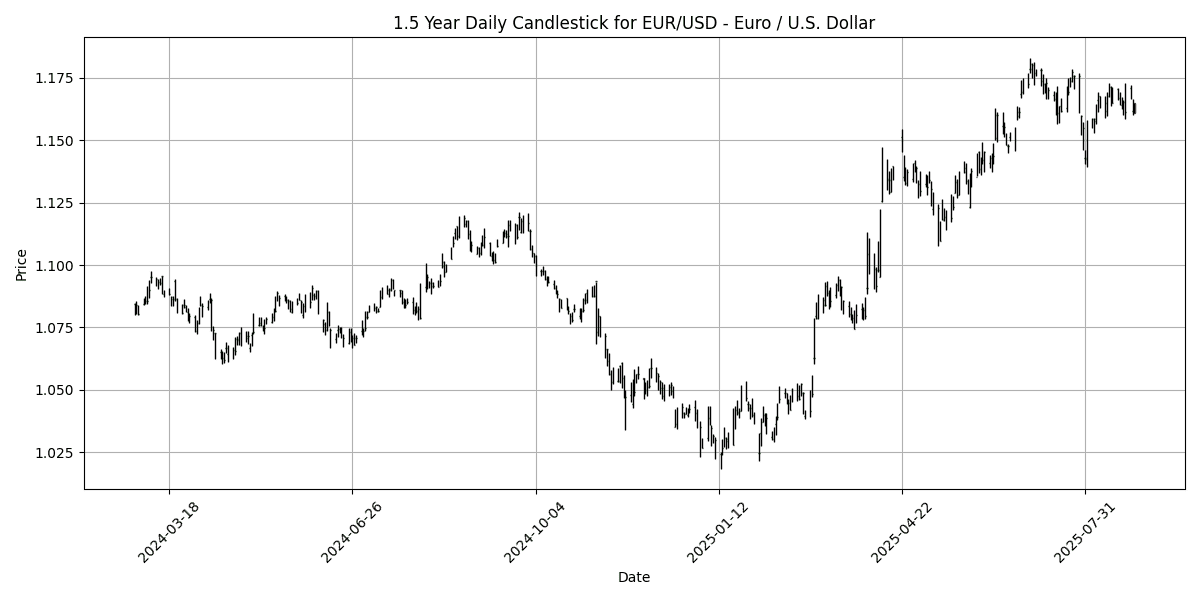
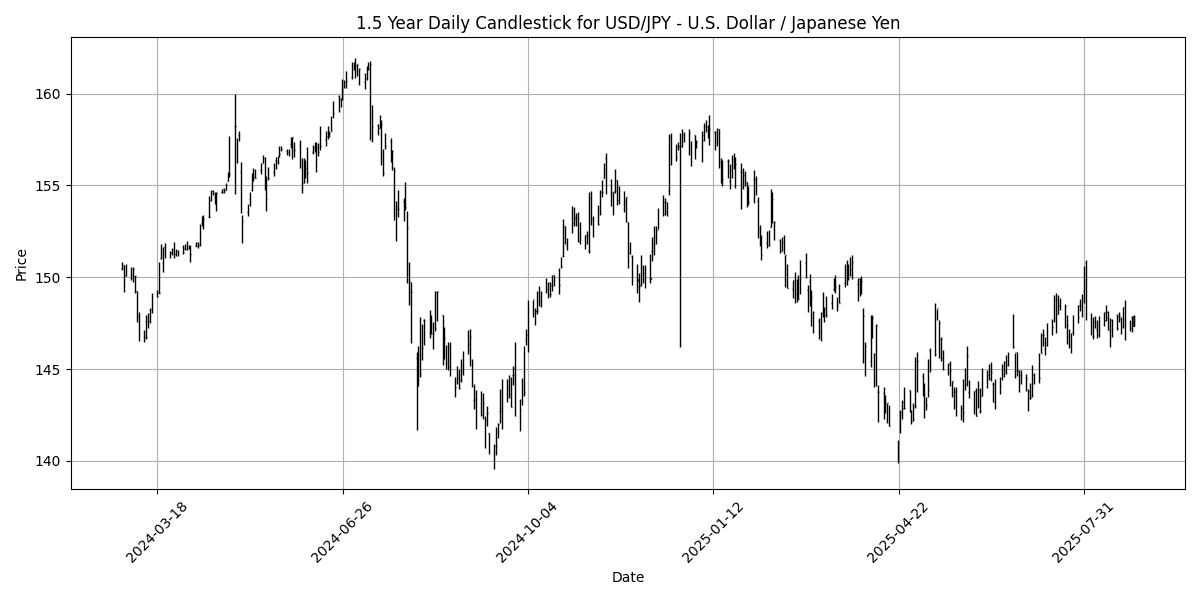
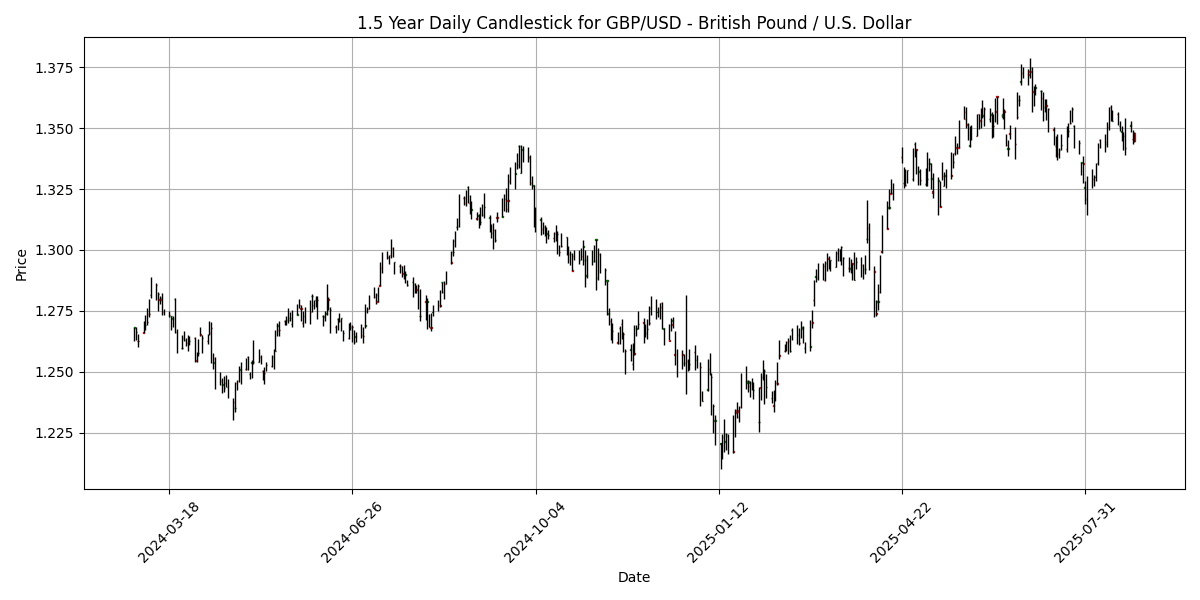
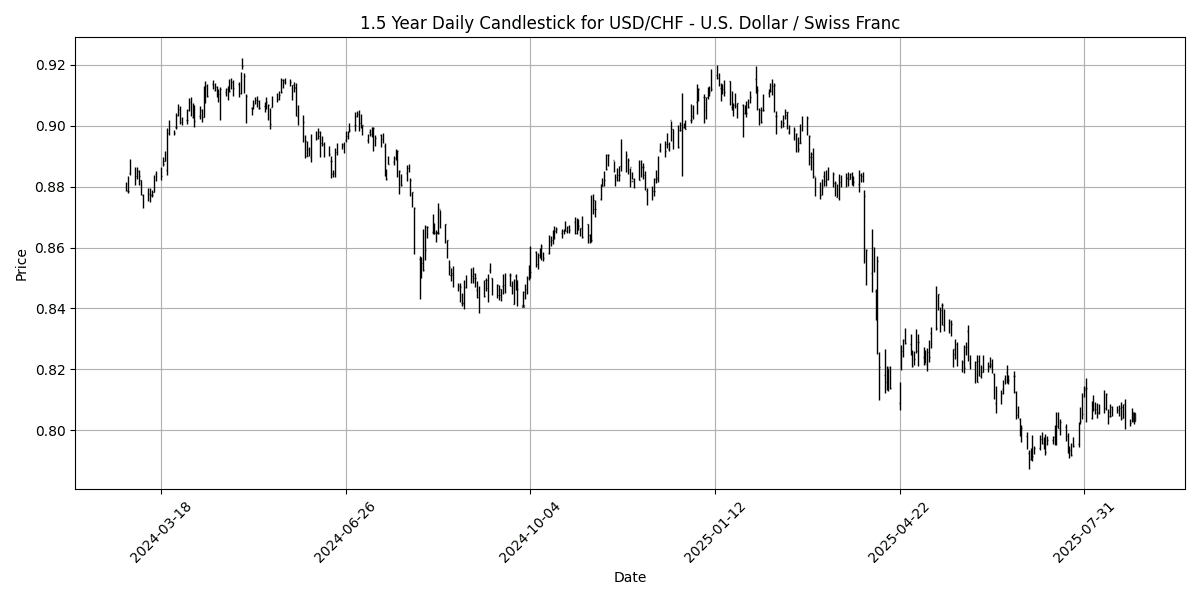
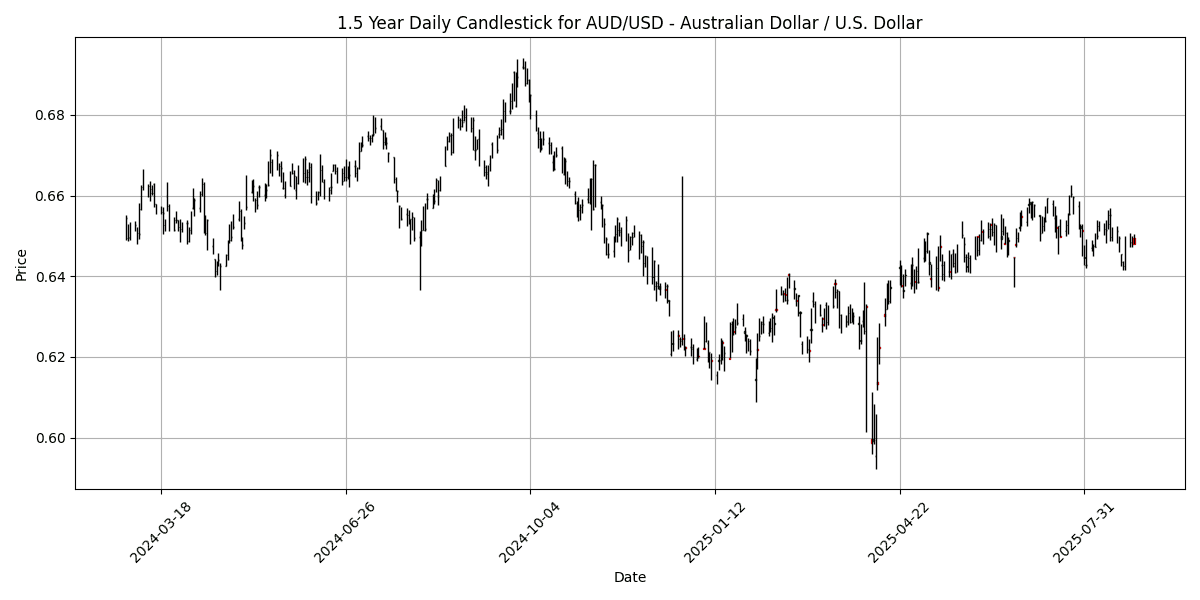
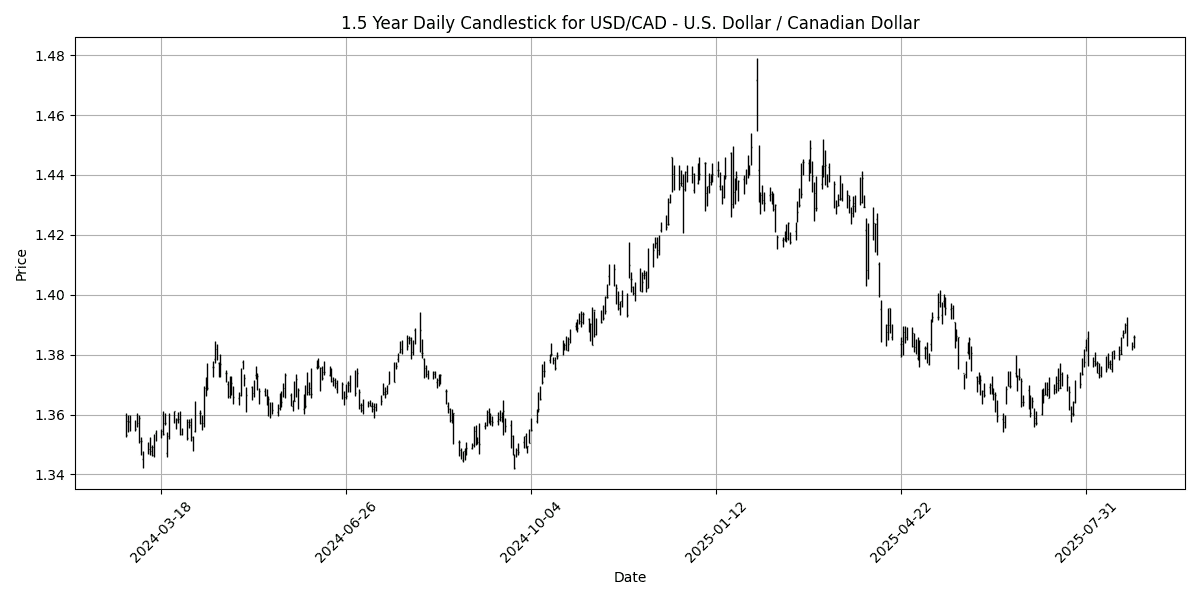
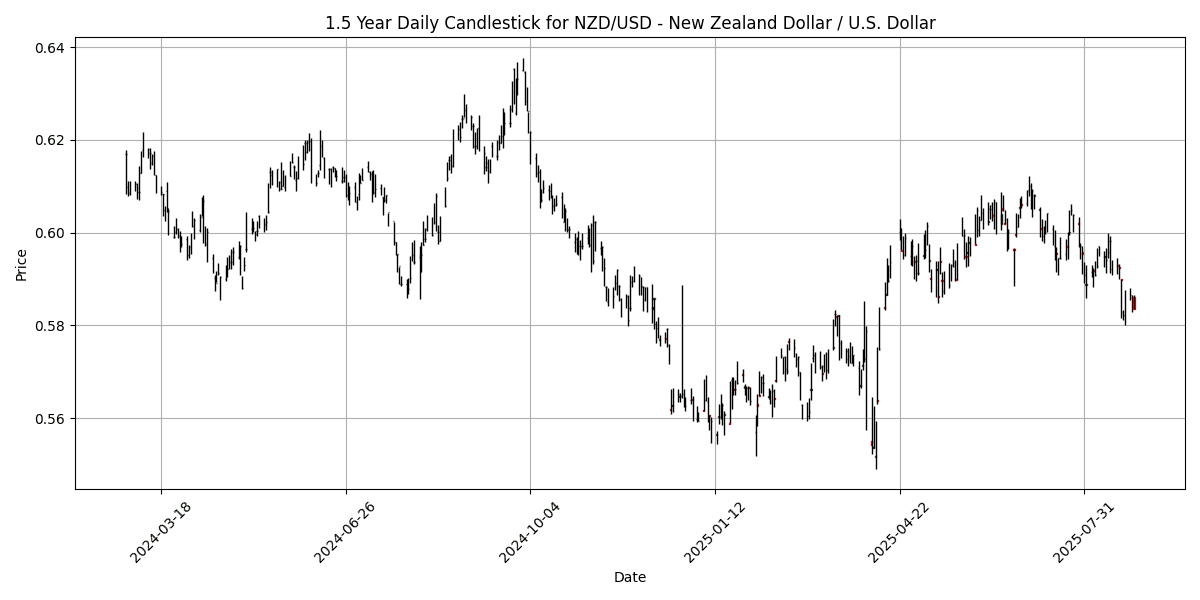
Currently, the majority of the analyzed FX pairs exhibit neutral to slightly bullish conditions, with no significant overbought or oversold signals. The EUR/USD pair, with an RSI of 45.32 and a MACD of 0.0003, suggests a balanced market without extreme conditions, while the USD/JPY shows a slightly bullish sentiment with an RSI of 54.37 and a positive MACD of 0.1915.
The GBP/USD is also in a neutral zone, indicated by an RSI of 57.20, which reflects moderate bullish momentum. Conversely, the AUD/USD and NZD/USD pairs are showing signs of weakness, with the latter exhibiting an oversold condition (RSI of 36.98) and a bearish MACD of -0.0035, suggesting potential downside risk. The USD/CAD, with an RSI of 61.74, is approaching overbought territory, warranting caution for potential reversals. Overall, traders should remain
## Cross FX Group
| Name | Symbol | Price | Daily (%) | 5D (%) | 1W (%) | 1M (%) | 3M (%) | 6M (%) | YTD (%) | 12M (%) | MA50 | MA100 | MA200 | RSI | MACD |
|---|---|---|---|---|---|---|---|---|---|---|---|---|---|---|---|
| EUR/GBP | EURGBP | 0.8630 | -0.0695 | -0.2773 | -0.0278 | -1.3489 | 3.1902 | 4.6035 | 4.0775 | 1.9793 | 0.8637 | 0.8561 | 0.8449 | 27.50 | -0.0001 |
| EUR/JPY | EURJPY | 171.61 | -0.0198 | -0.4086 | -0.2221 | -1.2407 | 4.8570 | 10.06 | 5.0341 | 6.3792 | 171.07 | 167.13 | 163.96 | 57.65 | 0.3209 |
| EUR/CHF | EURCHF | 0.9351 | -0.0428 | -0.4196 | -0.5646 | 0.0086 | -0.0139 | -0.0342 | -0.5107 | -1.1250 | 0.9359 | 0.9356 | 0.9387 | 53.43 | 0.0012 |
| EUR/AUD | EURAUD | 1.7915 | -0.0279 | -0.8693 | -0.6747 | 0.1375 | 2.4727 | 7.4137 | 7.0703 | 8.6765 | 1.7887 | 1.7780 | 1.7234 | 47.87 | 0.0041 |
| GBP/JPY | GBPJPY | 198.86 | 0.0594 | -0.1160 | -0.1892 | 0.1153 | 1.6256 | 5.2226 | 0.9432 | 4.3179 | 198.10 | 195.22 | 194.05 | 70.41 | 0.3573 |
| GBP/CHF | GBPCHF | 1.0836 | 0.0462 | -0.1281 | -0.5288 | 1.3885 | -3.0899 | -4.4208 | -4.3896 | -3.0240 | 1.0838 | 1.0930 | 1.1114 | 64.05 | 0.0013 |
| AUD/JPY | AUDJPY | 95.77 | -0.0031 | 0.4563 | 0.4447 | -1.3839 | 2.3238 | 2.4541 | -1.8961 | -2.1417 | 95.68 | 94.05 | 95.19 | 51.34 | -0.0685 |
| AUD/NZD | AUDNZD | 1.1103 | 0.2076 | 0.6135 | 1.4575 | 1.7877 | 2.9906 | 0.2599 | 0.6897 | 1.7336 | 1.0913 | 1.0856 | 1.0949 | 71.70 | 0.0043 |
| CHF/JPY | CHFJPY | 183.49 | 0.0142 | 0.0041 | 0.3456 | -1.2539 | 4.8793 | 10.09 | 5.5790 | 7.5732 | 182.77 | 178.61 | 174.66 | 54.82 | 0.1042 |
| NZD/JPY | NZDJPY | 86.25 | -0.1932 | -0.1436 | -0.9827 | -3.0245 | -0.6348 | 2.2028 | -2.5688 | -3.8065 | 87.66 | 86.61 | 86.93 | 38.91 | -0.4005 |
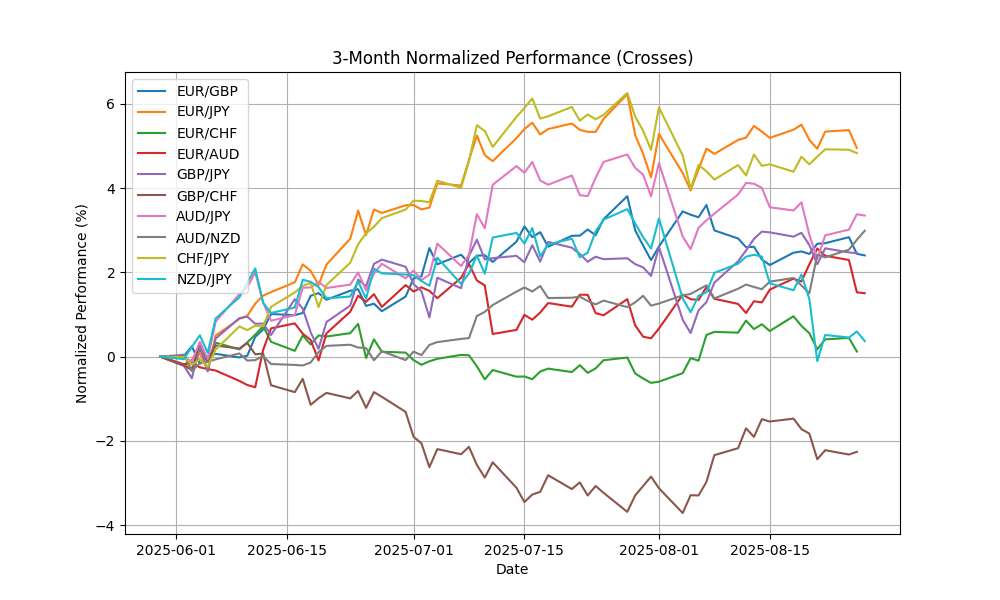
In the current market landscape, EUR/GBP is notably oversold with an RSI of 27.50 and a bearish MACD, indicating potential for a corrective bounce. Conversely, GBP/JPY is approaching overbought territory with an RSI of 70.41, coupled with a positive MACD, suggesting momentum may soon wane. AUD/NZD also reflects overbought conditions with an RSI of 71.70, warranting caution for long positions. Overall, the mixed signals from these pairs highlight the need for careful analysis, particularly in the context of broader market trends and potential reversals. Traders should remain vigilant for key levels and possible corrections.
## Exotics and Emerging
| Name | Symbol | Price | Daily (%) | 5D (%) | 1W (%) | 1M (%) | 3M (%) | 6M (%) | YTD (%) | 12M (%) | MA50 | MA100 | MA200 | RSI | MACD |
|---|---|---|---|---|---|---|---|---|---|---|---|---|---|---|---|
| USD/TRY – U.S. Dollar / Turkish Lira | USDTRY | 41.00 | -0.0821 | -0.0197 | 0.3178 | 1.1327 | 4.8734 | 12.27 | 16.13 | 20.50 | 40.37 | 39.56 | 37.72 | 80.42 | 0.1871 |
| USD/ZAR – U.S. Dollar / South African Rand | USDZAR | 17.72 | 0.5489 | 0.0660 | 0.0863 | -0.1291 | -1.3855 | -3.8739 | -5.5940 | 0.1045 | 17.76 | 18.04 | 18.17 | 38.85 | -0.0578 |
| USD/THB – U.S. Dollar / Thai Baht | USDTHB | 32.47 | 0.0925 | -0.5818 | -0.3376 | 0.3399 | -0.9970 | -4.6402 | -4.8888 | -4.4157 | 32.47 | 32.78 | 33.42 | 54.93 | 0.0118 |
| USD/SEK – U.S. Dollar / Swedish Krona | USDSEK | 9.5918 | 0.3956 | -0.2219 | -0.1084 | 0.9429 | -1.0585 | -10.8374 | -12.9903 | -6.0721 | 9.5814 | 9.6207 | 10.18 | 49.13 | -0.0064 |
| USD/NOK – U.S. Dollar / Norwegian Krone | USDNOK | 10.17 | 0.4415 | -0.0649 | -1.1126 | 0.3495 | -0.4786 | -9.5687 | -10.2265 | -3.4858 | 10.15 | 10.24 | 10.66 | 41.66 | -0.0039 |
| USD/DKK – U.S. Dollar / Danish Krone | USDDKK | 6.4321 | 0.3385 | 0.0700 | 0.3308 | 1.3226 | -3.1201 | -10.3528 | -10.2514 | -3.7428 | 6.4037 | 6.4996 | 6.7944 | 47.52 | -0.0036 |
| USD/MXN – U.S. Dollar / Mexican Peso | USDMXN | 18.69 | 0.1758 | -0.2685 | -0.7052 | 0.9885 | -3.6066 | -8.6599 | -9.4328 | -3.5536 | 18.74 | 19.13 | 19.75 | 54.64 | -0.0151 |
| USD/PLN – U.S. Dollar / Polish Zloty | USDPLN | 3.6734 | 0.4787 | 0.3442 | 0.8814 | 1.7960 | -2.5874 | -8.2442 | -10.5591 | -4.1862 | 3.6499 | 3.7061 | 3.8605 | 52.58 | -0.0014 |
| USD/HUF – U.S. Dollar / Hungarian Forint | USDHUF | 341.28 | 0.4299 | 0.0240 | 0.9988 | 1.2856 | -4.9052 | -11.3042 | -13.6012 | -3.3048 | 341.87 | 349.54 | 367.98 | 46.88 | -1.0610 |
| USD/CZK – U.S. Dollar / Czech Koruna | USDCZK | 21.12 | 0.3550 | -0.1744 | 0.5653 | 1.1933 | -4.7671 | -12.1009 | -12.5888 | -5.7540 | 21.10 | 21.55 | 22.69 | 52.35 | -0.0254 |

In the current analysis of key FX pairs, USD/TRY exhibits overbought conditions with an RSI of 80.42, indicating potential for a price correction, despite a bullish MACD. Conversely, USD/ZAR shows oversold conditions at an RSI of 38.85, coupled with a bearish MACD, suggesting a possible rebound. Other pairs such as USD/THB, USD/SEK, and USD/NOK remain in neutral territory, with RSIs between 41 and 54, indicating limited momentum. Monitoring these indicators, particularly in USD/TRY and USD/ZAR, will be crucial for assessing potential trading opportunities and market reversals in the near term.


