## Forex and Global News
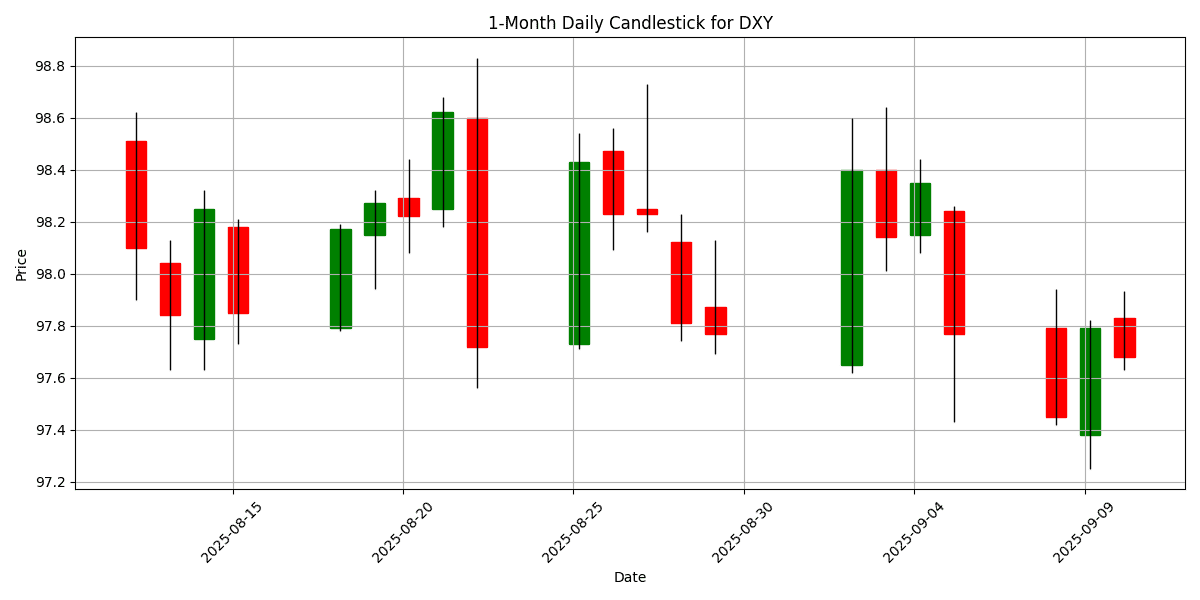
In today’s forex market, the USD showed slight weakness as the DXY fell to 97.68, down 0.0941%.
The GBP/USD pair is trading around 1.3500, encountering resistance at 1.3590-1.3600, which may attract technical buyers if breached. Meanwhile, the EUR/USD is struggling near 1.1700, losing bullish momentum ahead of the U.S. inflation data.
Geopolitical tensions are also impacting market sentiment, particularly after NATO’s engagement with Russian drones over Poland, raising concerns about regional stability. Gold prices are experiencing renewed demand as a safe haven in light of these developments.
In commodities, the uranium market is seeing renewed interest due to surging nuclear energy demand, indicating a potential shift in investment focus. Overall, the forex market remains cautious as traders await key economic indicators and navigate geopolitical uncertainties.
## Economic Calendar Events Today
All times are in US Eastern Time (New York).
| Date | Time | Cur | Imp | Event | Actual | Forecast |
|---|---|---|---|---|---|---|
| 2025-09-10 | 08:00 | 🇪🇺 | Medium | German Buba Vice President Buch Speaks | ||
| 2025-09-10 | 08:00 | 🇧🇷 | Medium | CPI (YoY) (Aug) | 5.13% | 5.10% |
| 2025-09-10 | 08:30 | 🇺🇸 | Medium | Core PPI (MoM) (Aug) | -0.1% | 0.3% |
| 2025-09-10 | 08:30 | 🇺🇸 | High | PPI (MoM) (Aug) | -0.1% | 0.3% |
| 2025-09-10 | 10:30 | 🇺🇸 | High | Crude Oil Inventories | -1.900M | |
| 2025-09-10 | 10:30 | 🇺🇸 | Medium | Cushing Crude Oil Inventories | ||
| 2025-09-10 | 10:53 | 🇷🇺 | Medium | CPI (YoY) (Aug) | ||
| 2025-09-10 | 10:53 | 🇷🇺 | Medium | CPI (MoM) (Aug) | ||
| 2025-09-10 | 13:00 | 🇺🇸 | High | 10-Year Note Auction | ||
| 2025-09-10 | 13:00 | 🇺🇸 | Medium | Atlanta Fed GDPNow (Q3) | 3.0% | |
| 2025-09-10 | 19:50 | 🇯🇵 | Medium | BSI Large Manufacturing Conditions (Q3) | -3.3 |
On September 10, 2025, several key economic events are poised to impact the foreign exchange (FX) markets significantly.
At 08:00 ET, German Buba Vice President Buch is scheduled to speak, although no forecasts or prior remarks are available. Market participants will be keenly listening for insights on future monetary policy, which could influence the euro (EUR).
At the same time, Brazil’s CPI (YoY) for August came in at 5.13%, slightly above the forecast of 5.10%. This unexpected rise may bolster the Brazilian real (BRL) as it suggests persistent inflationary pressures, prompting potential tightening measures from the Central Bank of Brazil.
The U.S. Producer Price Index (PPI) data, released at 08:30 ET, showed a disappointing -0.1% for both the overall and core metrics, diverging sharply from the expected 0.3% increase. This negative surprise may weigh on the U.S. dollar (USD) as it raises concerns about inflation and economic growth.
Later, at 10:30 ET, the Crude Oil Inventories report is anticipated, with a forecast of a decline of 1.9 million barrels. This could further influence the USD, especially in relation to energy prices.
Lastly, the Atlanta Fed’s GDPNow forecast for Q3, expected at 3.0%, will provide further insights into the U.S. economic outlook, impacting USD sentiment.
## Major FX Group
| Name | Symbol | Price | Daily (%) | 5D (%) | 1W (%) | 1M (%) | 3M (%) | 6M (%) | YTD (%) | 12M (%) | MA50 | MA100 | MA200 | RSI | MACD |
|---|---|---|---|---|---|---|---|---|---|---|---|---|---|---|---|
| EUR/USD – Euro / U.S. Dollar | EURUSD | 1.1708 | -0.0512 | 0.4382 | 0.6185 | 0.5155 | 1.7261 | 7.8518 | 12.51 | 6.0745 | 1.1667 | 1.1537 | 1.1069 | 54.67 | 0.0019 |
| USD/JPY – U.S. Dollar / Japanese Yen | USDJPY | 147.43 | 0.0543 | -0.6376 | -0.7533 | -0.1591 | 2.2371 | -0.3515 | -6.0932 | 2.9697 | 147.33 | 145.86 | 148.84 | 47.72 | 0.1523 |
| GBP/USD – British Pound / U.S. Dollar | GBPUSD | 1.3538 | 0.0665 | 0.6956 | 1.1546 | 0.6956 | -0.2168 | 4.4728 | 7.8803 | 3.5698 | 1.3473 | 1.3464 | 1.3068 | 55.49 | 0.0013 |
| USD/CHF – U.S. Dollar / Swiss Franc | USDCHF | 0.7978 | 0.1004 | -0.9104 | -0.9301 | -1.1976 | -2.5171 | -9.6100 | -11.6735 | -6.0804 | 0.8018 | 0.8120 | 0.8507 | 33.36 | -0.0015 |
| AUD/USD – Australian Dollar / U.S. Dollar | AUDUSD | 0.6617 | 0.4402 | 1.4566 | 1.5142 | 1.5233 | 1.6514 | 5.2421 | 6.3826 | -0.6140 | 0.6523 | 0.6494 | 0.6389 | 77.30 | 0.0020 |
| USD/CAD – U.S. Dollar / Canadian Dollar | USDCAD | 1.3852 | 0.0506 | 0.2678 | 0.4897 | 0.7220 | 1.3633 | -3.9776 | -3.4690 | 2.1233 | 1.3744 | 1.3763 | 1.4024 | 40.94 | 0.0011 |
| NZD/USD – New Zealand Dollar / U.S. Dollar | NZDUSD | 0.5948 | 0.3205 | 1.6561 | 1.4723 | -0.0219 | -1.4677 | 4.2940 | 5.4664 | -3.1636 | 0.5942 | 0.5963 | 0.5835 | 69.14 | -0.0008 |
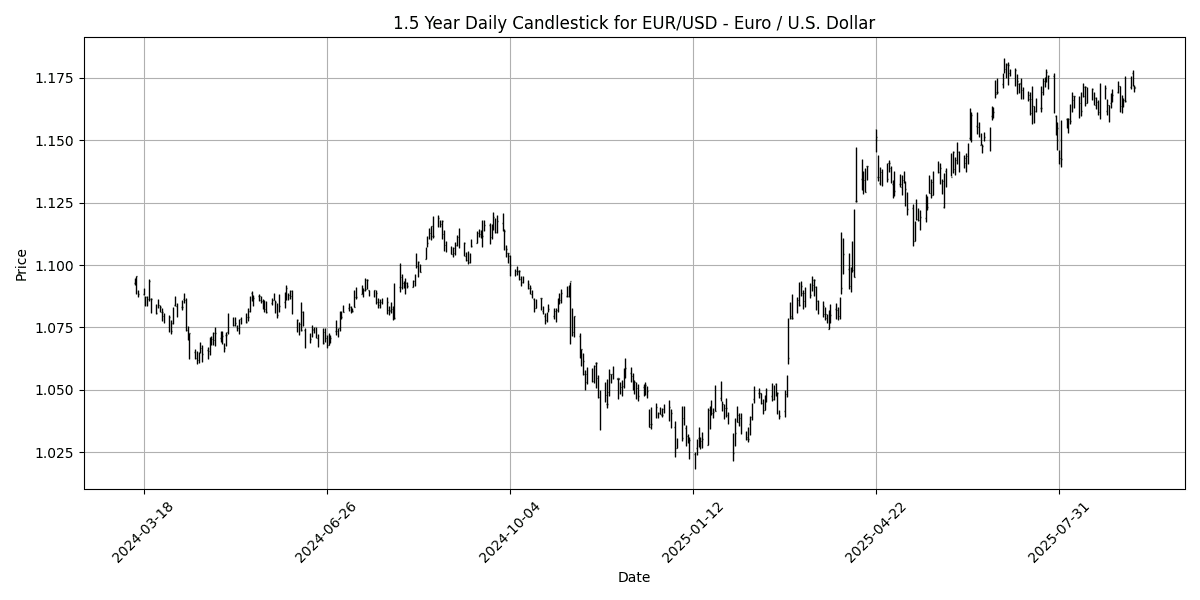
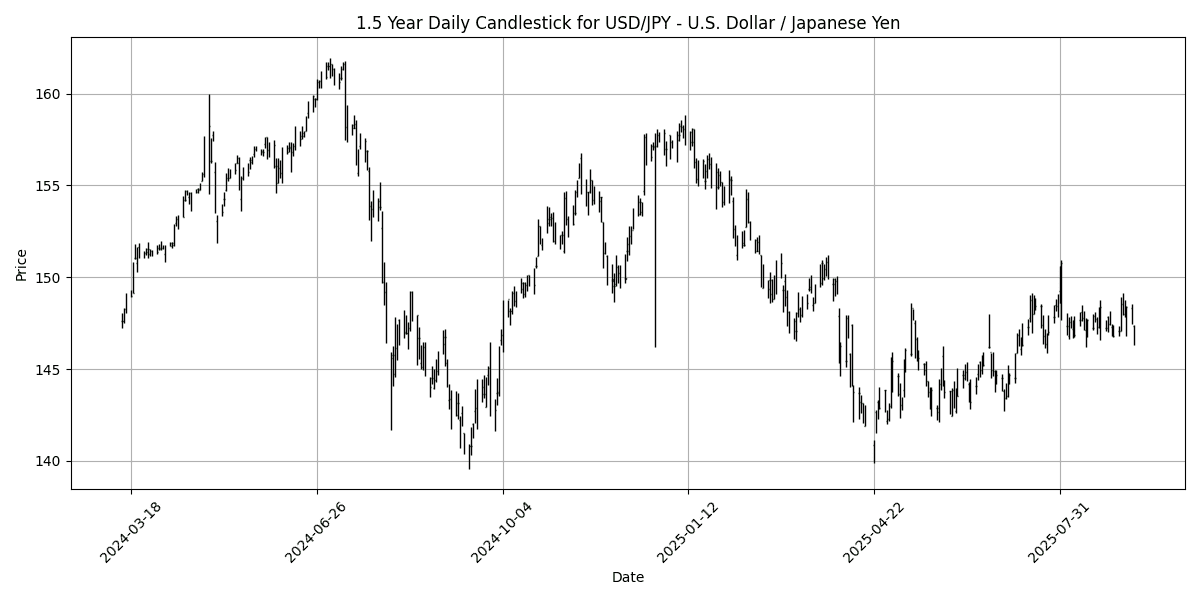
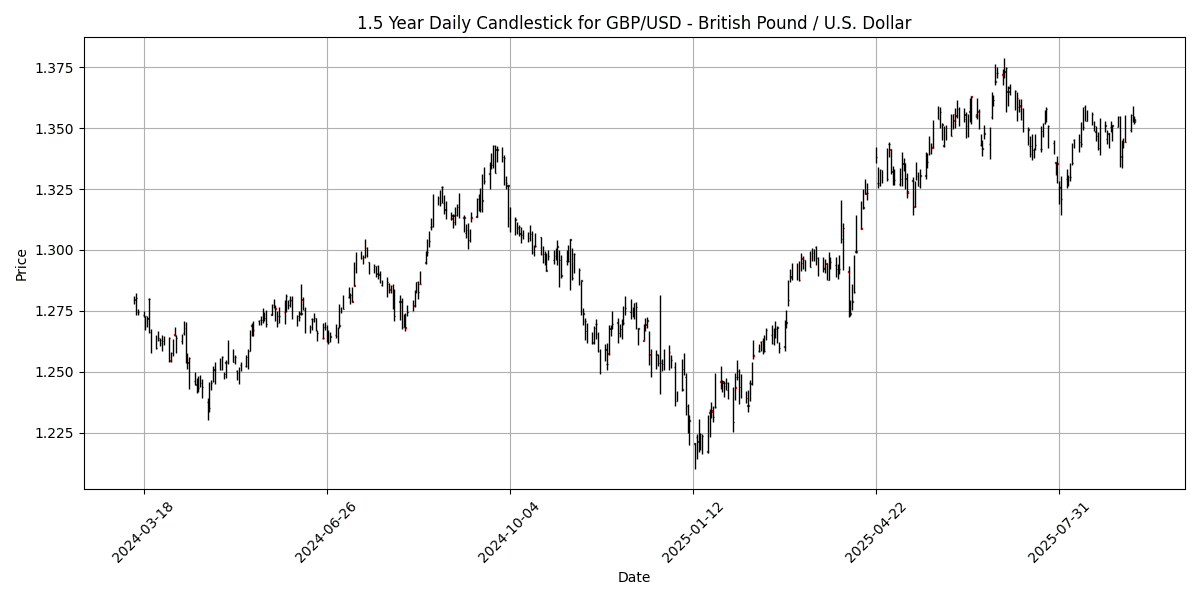
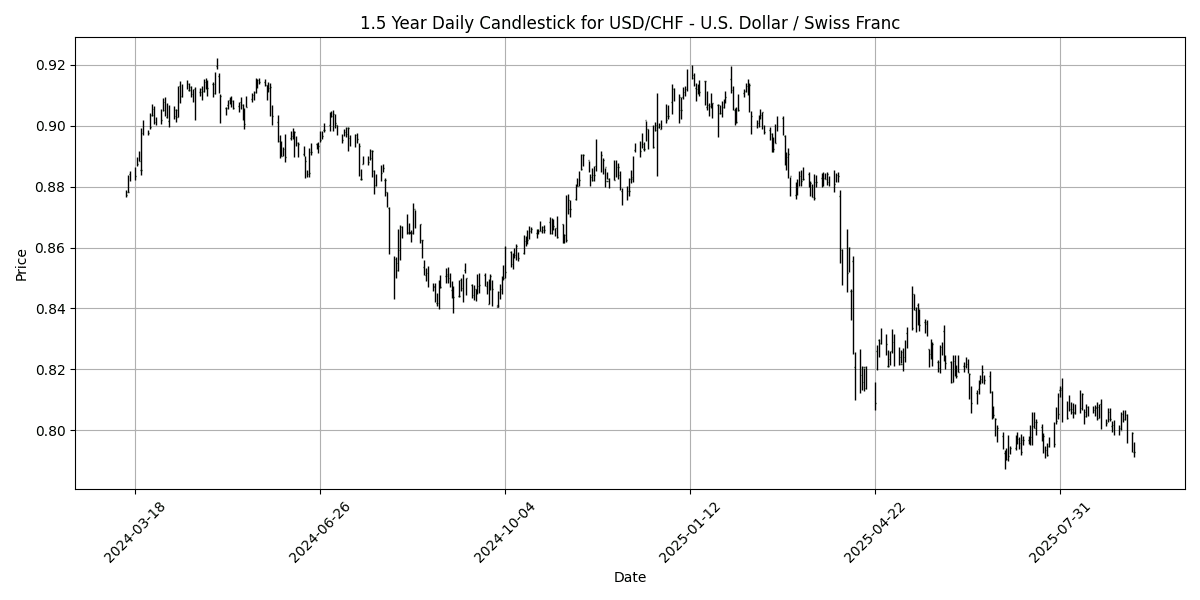
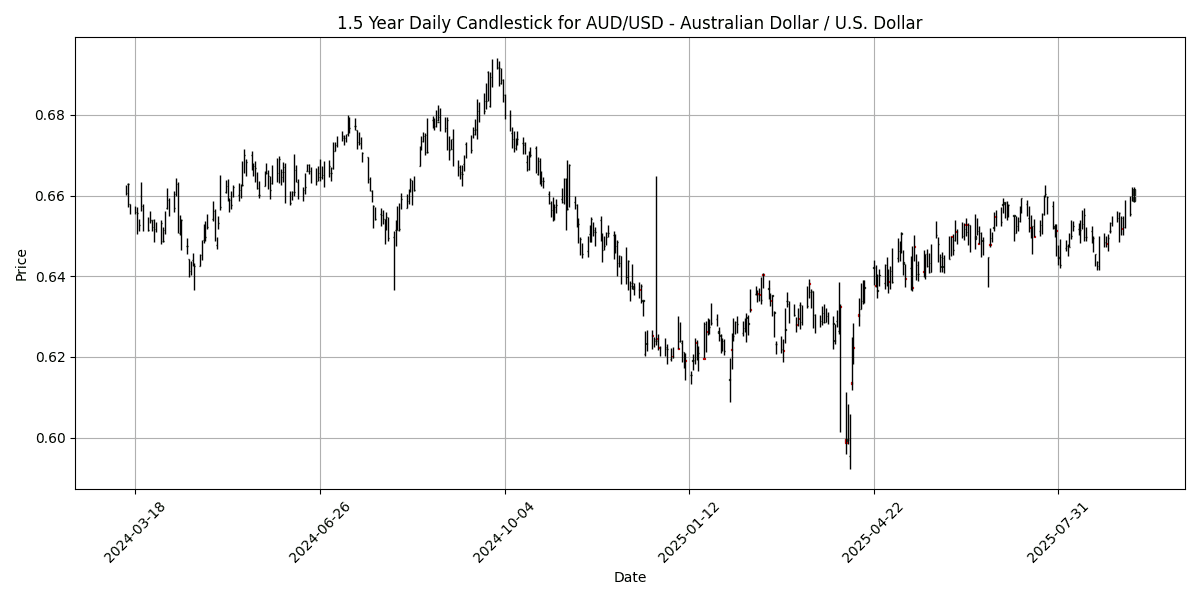
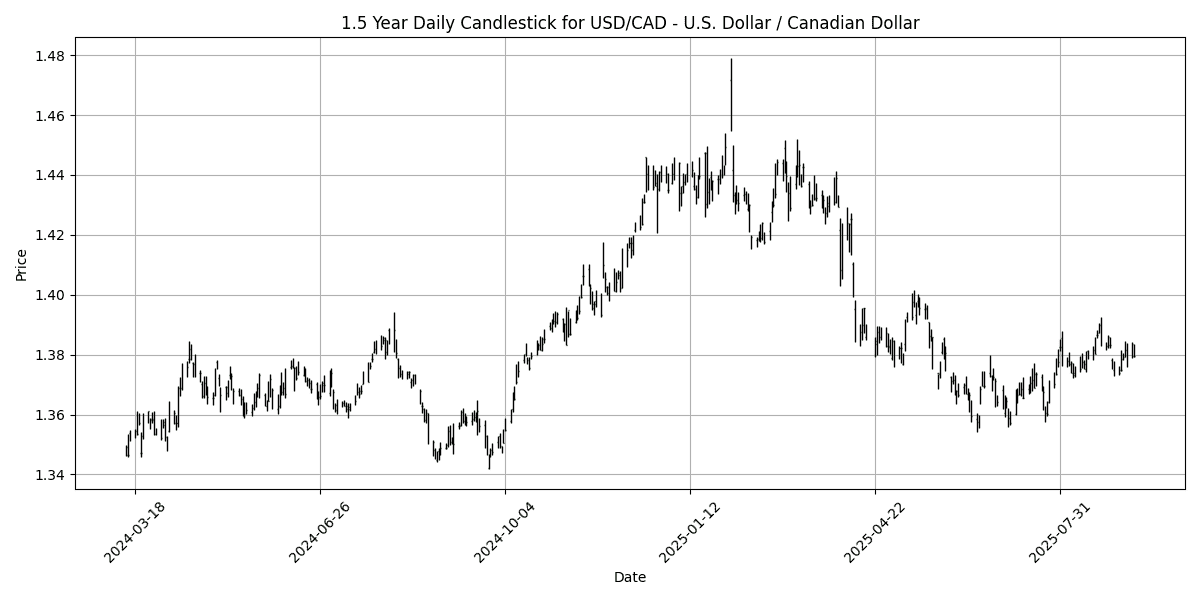
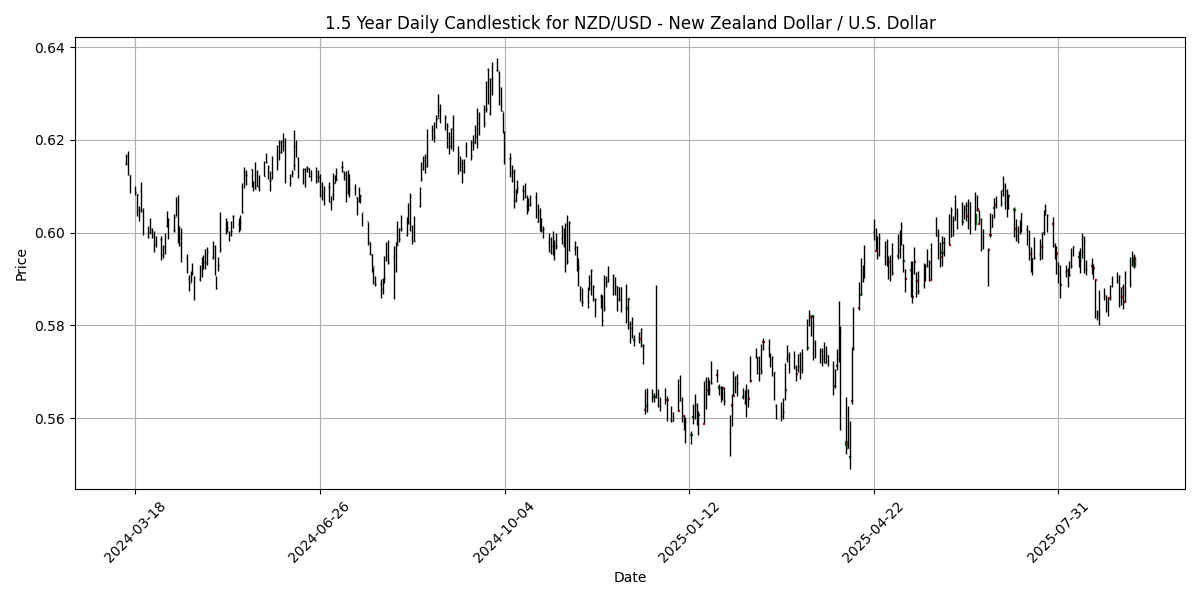
In the current forex landscape, several key pairs exhibit notable overbought and oversold conditions. The AUD/USD is significantly overbought with an RSI of 77.30, indicating potential for a pullback, despite a positive MACD and bullish MA crossovers. Conversely, the USD/CHF is in an oversold state with an RSI of 33.36 and a negative MACD, suggesting a potential reversal may occur as it approaches support levels.
The EUR/USD and GBP/USD maintain neutral positions with RSIs of 54.67 and 55.49, respectively, and positive MACDs, indicating stability in their trends. The USD/JPY and USD/CAD also show a lack of momentum, with RSIs below 50, reflecting bearish sentiment. The NZD/USD, with an RSI of 69.14, is nearing overbought territory but remains below the critical threshold. Traders should monitor these conditions closely for potential trading opportunities in the upcoming sessions.
## Cross FX Group
| Name | Symbol | Price | Daily (%) | 5D (%) | 1W (%) | 1M (%) | 3M (%) | 6M (%) | YTD (%) | 12M (%) | MA50 | MA100 | MA200 | RSI | MACD |
|---|---|---|---|---|---|---|---|---|---|---|---|---|---|---|---|
| EUR/GBP | EURGBP | 0.8646 | -0.1155 | -0.2780 | -0.5338 | -0.2008 | 1.9383 | 3.2075 | 4.2704 | 2.4044 | 0.8658 | 0.8567 | 0.8464 | 62.63 | 0.0008 |
| EUR/JPY | EURJPY | 172.56 | -0.0070 | -0.2249 | -0.1458 | 0.3337 | 3.9874 | 7.4515 | 5.6180 | 9.2315 | 171.89 | 168.22 | 164.46 | 64.04 | 0.4514 |
| EUR/CHF | EURCHF | 0.9337 | 0.0321 | -0.5083 | -0.3330 | -0.7262 | -0.8790 | -2.5426 | -0.6596 | -0.3841 | 0.9355 | 0.9361 | 0.9389 | 42.78 | -0.0005 |
| EUR/AUD | EURAUD | 1.7694 | -0.4837 | -0.9943 | -0.8545 | -0.9871 | 0.0894 | 2.4913 | 5.7495 | 6.7447 | 1.7889 | 1.7766 | 1.7309 | 27.63 | -0.0011 |
| GBP/JPY | GBPJPY | 199.57 | 0.1028 | 0.0516 | 0.3909 | 0.5451 | 2.0187 | 4.1113 | 1.3061 | 6.6426 | 198.53 | 196.33 | 194.26 | 53.97 | 0.3387 |
| GBP/CHF | GBPCHF | 1.0799 | 0.1577 | -0.2217 | 0.2106 | -0.5186 | -2.7511 | -5.5668 | -4.7161 | -2.7205 | 1.0804 | 1.0928 | 1.1095 | 30.11 | -0.0013 |
| AUD/JPY | AUDJPY | 97.52 | 0.4812 | 0.7761 | 0.7178 | 1.3321 | 3.9006 | 4.8445 | -0.1076 | 2.3252 | 96.08 | 94.67 | 95.03 | 78.91 | 0.3119 |
| AUD/NZD | AUDNZD | 1.1124 | 0.1260 | -0.1992 | 0.0432 | 1.5427 | 3.1672 | 0.9086 | 0.8801 | 2.6360 | 1.0970 | 1.0885 | 1.0950 | 76.64 | 0.0049 |
| CHF/JPY | CHFJPY | 184.78 | -0.0260 | 0.2768 | 0.1777 | 1.0671 | 4.9086 | 10.25 | 6.3218 | 9.6453 | 183.73 | 179.66 | 175.17 | 77.51 | 0.5372 |
| NZD/JPY | NZDJPY | 87.66 | 0.3664 | 0.9955 | 0.6880 | -0.1924 | 0.7216 | 3.9168 | -0.9771 | -0.3082 | 87.57 | 86.94 | 86.78 | 56.20 | -0.1067 |
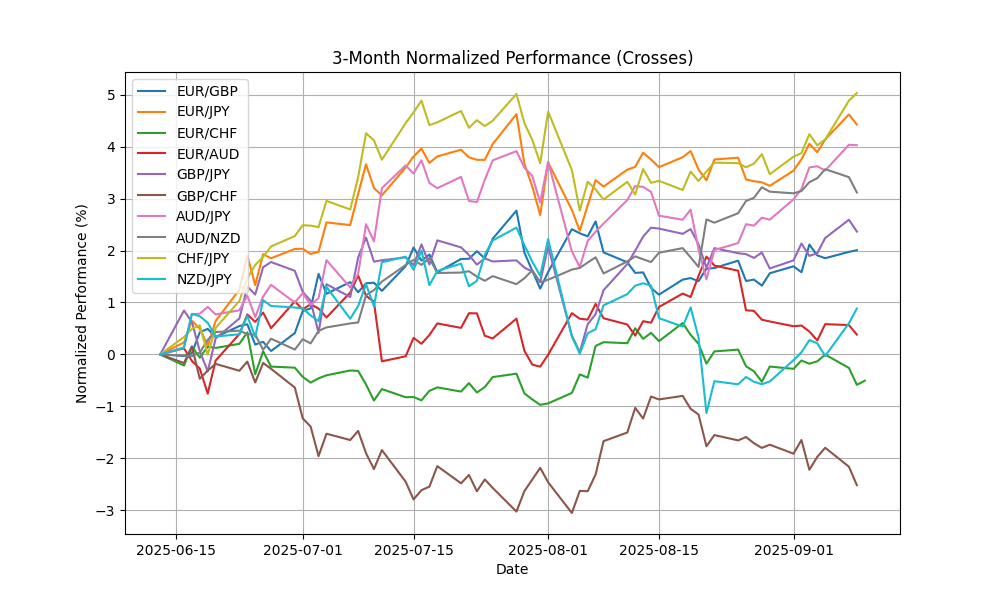
Currently, several FX pairs exhibit notable overbought and oversold conditions. AUD/JPY (RSI 78.91) and CHF/JPY (RSI 77.51) are significantly overbought, suggesting potential price corrections ahead, especially as their MACD values remain positive. Conversely, EUR/CHF (RSI 42.78) and GBP/CHF (RSI 30.11) are in oversold territory, indicating a potential rebound could occur if bullish momentum develops. The moving average crossovers for these pairs are stable, suggesting ongoing trends. Traders should monitor these indicators closely for potential reversals or continuations, particularly in the context of market sentiment and economic data releases.
## Exotics and Emerging
| Name | Symbol | Price | Daily (%) | 5D (%) | 1W (%) | 1M (%) | 3M (%) | 6M (%) | YTD (%) | 12M (%) | MA50 | MA100 | MA200 | RSI | MACD |
|---|---|---|---|---|---|---|---|---|---|---|---|---|---|---|---|
| USD/TRY – U.S. Dollar / Turkish Lira | USDTRY | 41.28 | 0.1392 | 0.0887 | 0.2864 | 1.3174 | 5.5062 | 12.55 | 16.93 | 21.08 | 40.63 | 39.84 | 38.02 | 89.06 | 0.1853 |
| USD/ZAR – U.S. Dollar / South African Rand | USDZAR | 17.54 | 0.0805 | -1.1525 | -0.8872 | -1.0867 | -0.8328 | -4.0199 | -6.5308 | -1.8116 | 17.71 | 17.88 | 18.16 | 39.68 | -0.0366 |
| USD/THB – U.S. Dollar / Thai Baht | USDTHB | 31.78 | 0.0945 | -1.5184 | -1.6404 | -1.7923 | -2.2936 | -5.6413 | -6.9100 | -6.1679 | 32.38 | 32.62 | 33.30 | 25.63 | -0.1328 |
| USD/SEK – U.S. Dollar / Swedish Krona | USDSEK | 9.3479 | -0.2625 | -1.1137 | -1.2052 | -2.2808 | -1.9423 | -8.2779 | -15.2028 | -9.8783 | 9.5602 | 9.5841 | 10.11 | 31.99 | -0.0529 |
| USD/NOK – U.S. Dollar / Norwegian Krone | USDNOK | 9.9210 | -0.4605 | -1.4958 | -1.1457 | -3.5101 | -1.2295 | -7.1170 | -12.4176 | -8.4795 | 10.15 | 10.18 | 10.61 | 24.42 | -0.0470 |
| USD/DKK – U.S. Dollar / Danish Krone | USDDKK | 6.3772 | 0.0596 | -0.4148 | -0.5863 | -0.4690 | -1.6031 | -7.2083 | -11.0175 | -5.6781 | 6.3963 | 6.4717 | 6.7596 | 39.13 | -0.0097 |
| USD/MXN – U.S. Dollar / Mexican Peso | USDMXN | 18.61 | -0.0397 | -0.6157 | -0.6311 | 0.1522 | -1.5164 | -7.3314 | -9.7988 | -6.4393 | 18.69 | 18.98 | 19.67 | 35.27 | -0.0093 |
| USD/PLN – U.S. Dollar / Polish Zloty | USDPLN | 3.6417 | 0.3942 | -0.0957 | -0.6099 | -0.0182 | -1.3606 | -5.4150 | -11.3309 | -5.9115 | 3.6460 | 3.6911 | 3.8395 | 41.74 | -0.0066 |
| USD/HUF – U.S. Dollar / Hungarian Forint | USDHUF | 336.10 | 0.2589 | -0.2824 | -1.1322 | -0.9323 | -3.2675 | -8.6610 | -14.9131 | -6.4560 | 340.26 | 346.97 | 365.44 | 42.54 | -1.4697 |
| USD/CZK – U.S. Dollar / Czech Koruna | USDCZK | 20.83 | 0.3740 | -0.6269 | -0.9563 | -0.6359 | -3.1309 | -9.6342 | -13.7786 | -8.1473 | 21.02 | 21.42 | 22.55 | 38.01 | -0.0715 |
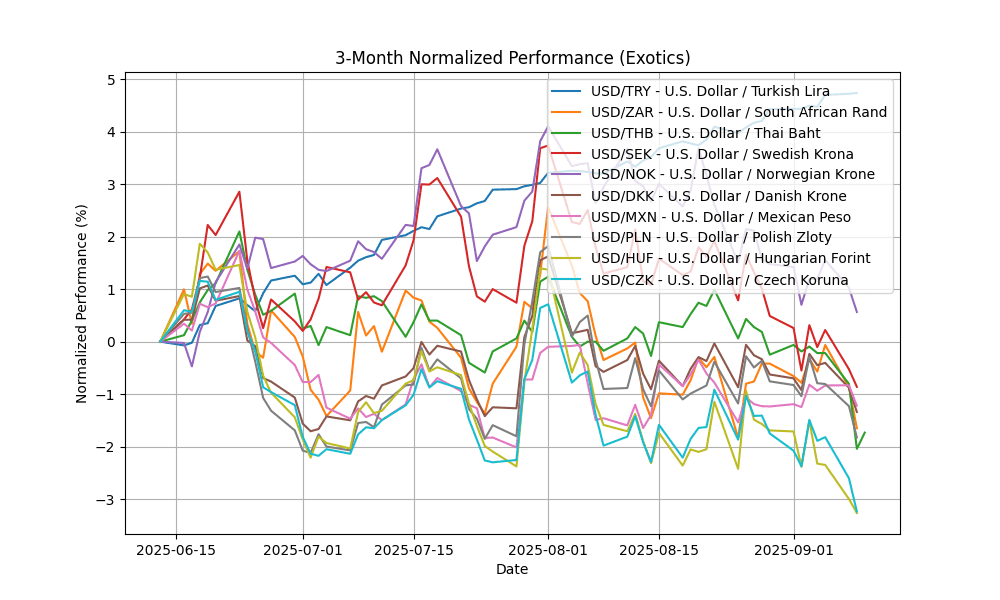
The USD/TRY is significantly overbought with an RSI of 89.06, indicating extreme bullish momentum, supported by a positive MACD of 0.1853. The MA50 has crossed above the MA100 and MA200, reinforcing the uptrend. In contrast, USD/ZAR, USD/THB, USD/NOK, and USD/SEK show oversold conditions with RSIs below 40, negative MACDs, and bearish MA crossovers, suggesting potential for corrective rebounds. USD/THB and USD/NOK, with RSIs of 25.63 and 24.42 respectively, appear particularly vulnerable to short-term recovery. Overall, the divergence between these pairs highlights contrasting market dynamics that traders should monitor closely


