💱 Forex Update: Fed Cuts Rates; GBP/USD Declines
📊 US Dollar Index (DXY)
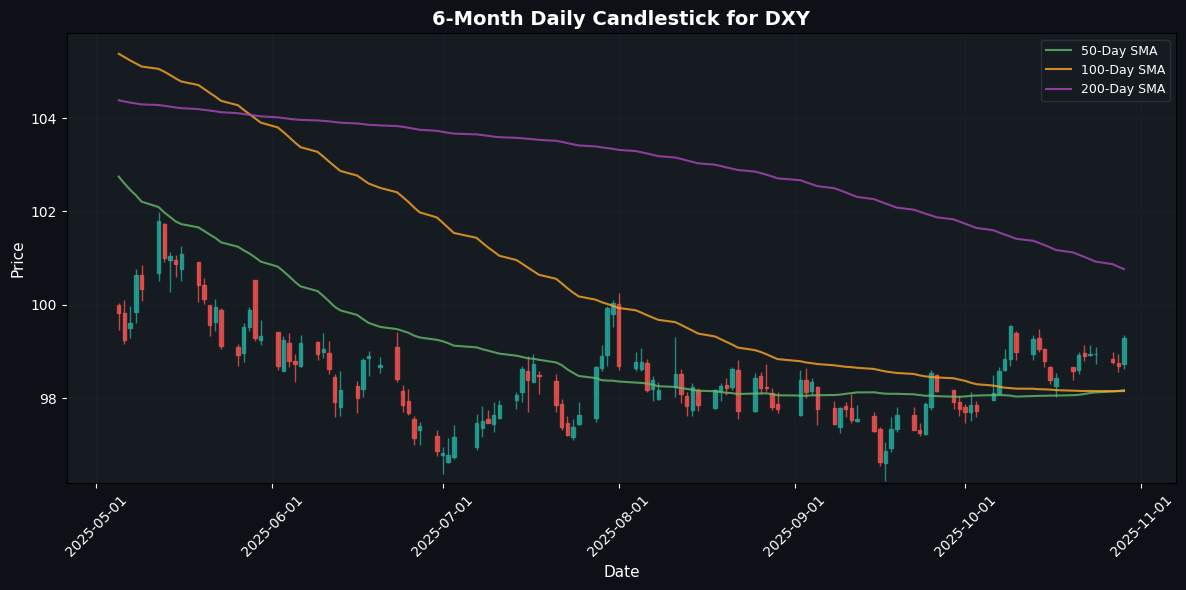
Current Level: 99.28 (+0.60%)
The foreign exchange market is currently influenced by the Federal Reserve’s recent decision to cut interest rates by 25 basis points, reducing the Federal Funds Target Range to 3.75%–4.00%. This move, described by Fed Chair Jerome Powell as a measure of risk management, has led to increased volatility in major currency pairs, particularly the EUR/USD and GBP/USD, both of which experienced downward pressure following the announcement.
The US Dollar Index (DXY) reflected this volatility, rising by 0.60% as traders reacted to the Fed’s easing policy and its implications for future monetary policy. The split decision at the Fed meeting, with two dissenters, highlights ongoing uncertainty in the market regarding the trajectory of interest rates and potential economic risks.
The British Pound continues to struggle, particularly against the Canadian Dollar, as the Bank of Canada signaled an end to its easing cycle, further contributing to GBP’s declines. Meanwhile, gold prices have stabilized near $4,000, reflecting safe-haven demand amid the shifting monetary landscape.
Overall, the FX market is navigating through a complex interplay of U.S. monetary policy shifts, commodity price movements, and central bank actions in Canada, indicating a cautious outlook as traders adjust their positions in response to ongoing economic uncertainties.
📅 Today’s Economic Calendar
No significant economic events scheduled for today.
💱 Major Currency Pairs
| Name | Symbol | Price | Daily (%) | 5D (%) | 1W (%) | 1M (%) | 3M (%) | 6M (%) | YTD (%) | 12M (%) | MA50 | MA100 | MA200 | RSI | MACD |
|---|---|---|---|---|---|---|---|---|---|---|---|---|---|---|---|
| EUR/USD – Euro / U.S. Dollar | EURUSD | 1.1600 | -0.45% | -0.01% | -0.50% | -2.29% | -0.11% | +10.59% | +4.27% | +7.05% | 1.1686 | 1.1666 | 1.1293 | 46.57 | -0.00 |
| USD/JPY – U.S. Dollar / Japanese Yen | USDJPY | 152.7590 | +0.04% | +0.57% | +1.23% | +4.33% | +5.38% | +0.48% | +5.76% | -2.67% | 149.1846 | 147.8527 | 147.9041 | 50.53 | 1.02 |
| GBP/USD – British Pound / U.S. Dollar | GBPUSD | 1.3192 | -1.12% | -1.30% | -1.74% | -3.38% | -3.11% | +4.83% | -0.01% | +3.63% | 1.3449 | 1.3477 | 1.3227 | 31.20 | -0.00 |
| USD/CHF – U.S. Dollar / Swiss Franc | USDCHF | 0.8006 | +0.76% | +0.49% | +0.88% | +1.87% | -0.56% | -11.03% | -4.90% | -11.37% | 0.7981 | 0.8009 | 0.8324 | 48.89 | -0.00 |
| AUD/USD – Australian Dollar / U.S. Dollar | AUDUSD | 0.6576 | +0.27% | +1.30% | +1.15% | -1.68% | +1.24% | +3.46% | -3.05% | -0.81% | 0.6557 | 0.6539 | 0.6438 | 48.68 | -0.00 |
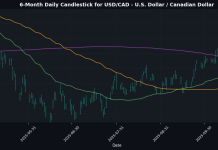
| USD/CAD – U.S. Dollar / Canadian Dollar | USDCAD | 1.3946 | -0.33% | -0.53% | -0.50% | +1.51% | +1.60% | -1.68% | +3.48% | +1.92% | 1.3895 | 1.3800 | 1.3959 | 48.45 | 0.00 |
| NZD/USD – New Zealand Dollar / U.S. Dollar | NZDUSD | 0.5765 | -0.19% | +0.38% | +0.57% | -3.75% | -4.10% | +0.55% | -7.73% | -5.75% | 0.5831 | 0.5911 | 0.5855 | 43.93 | -0.00 |
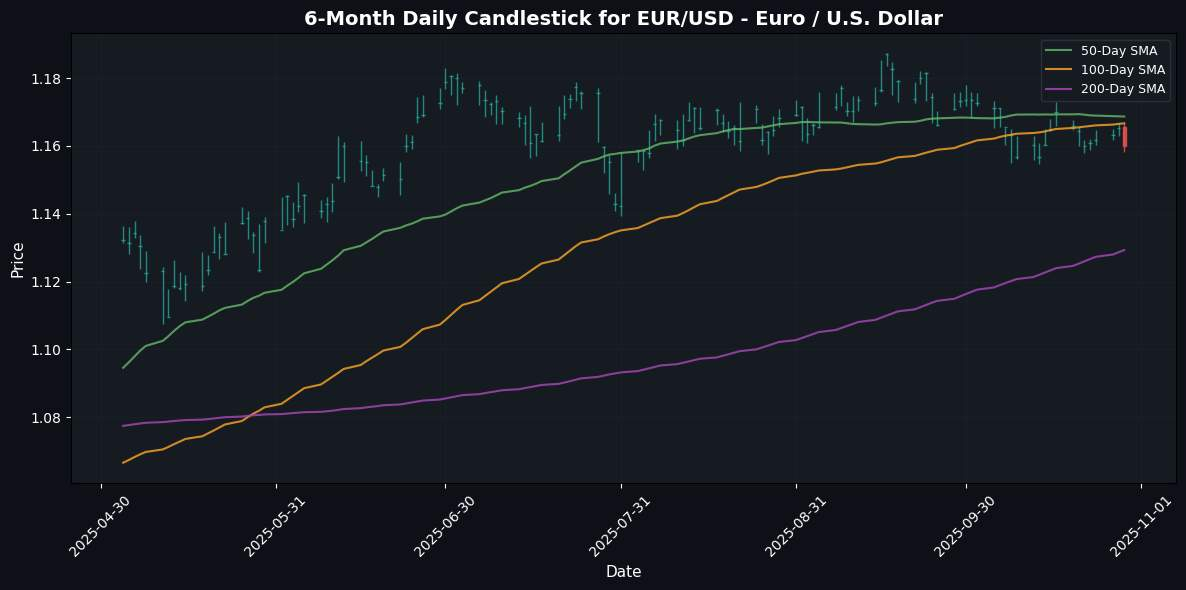
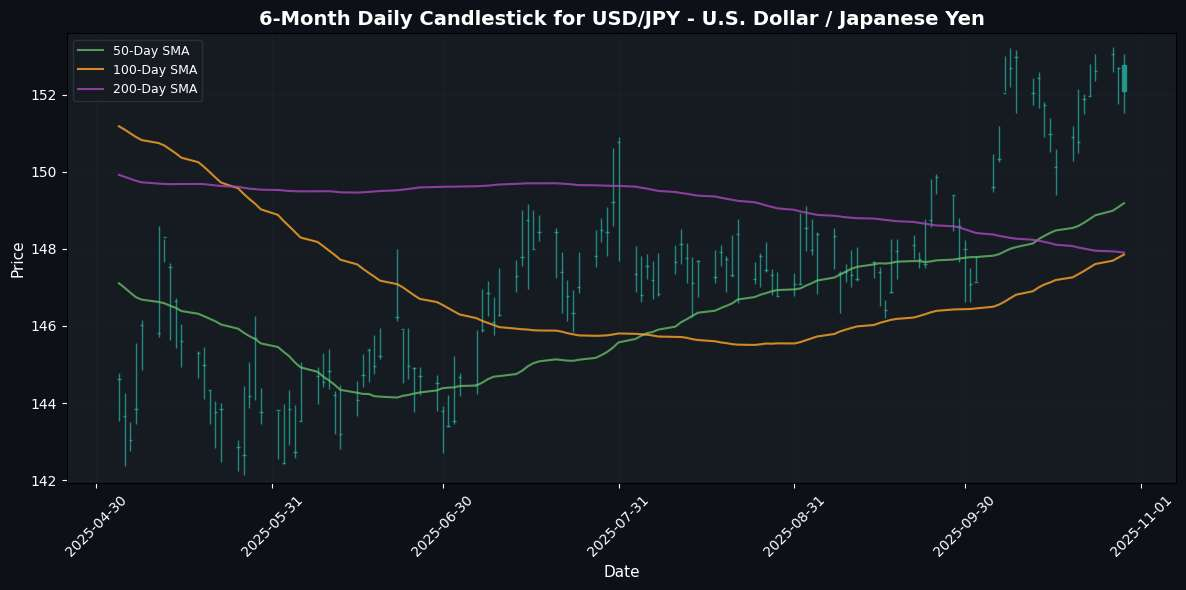
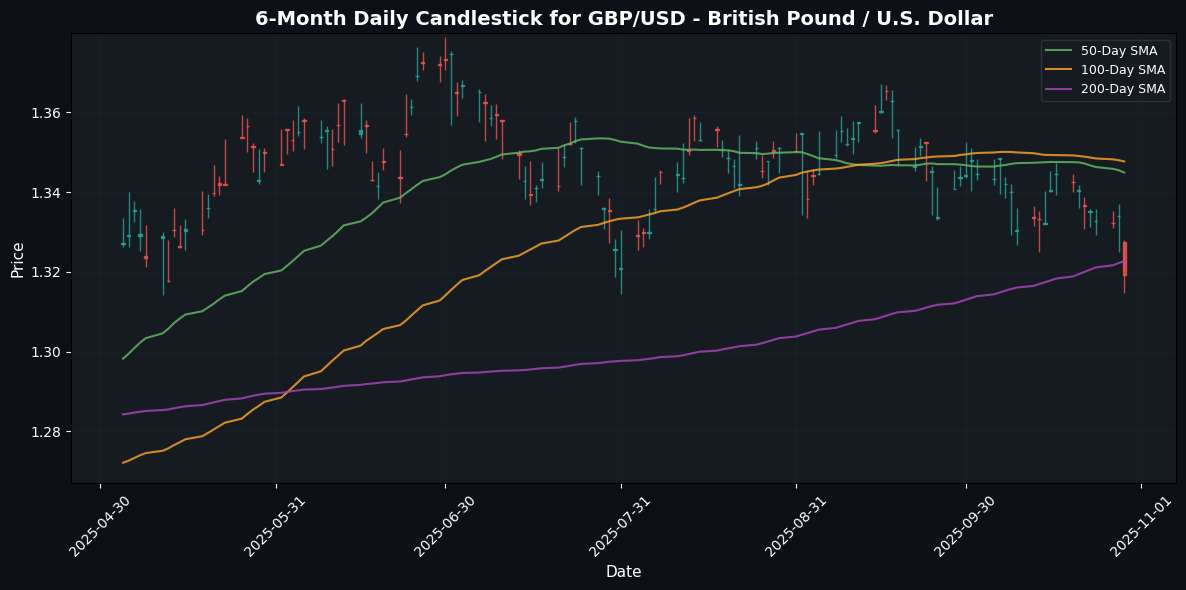
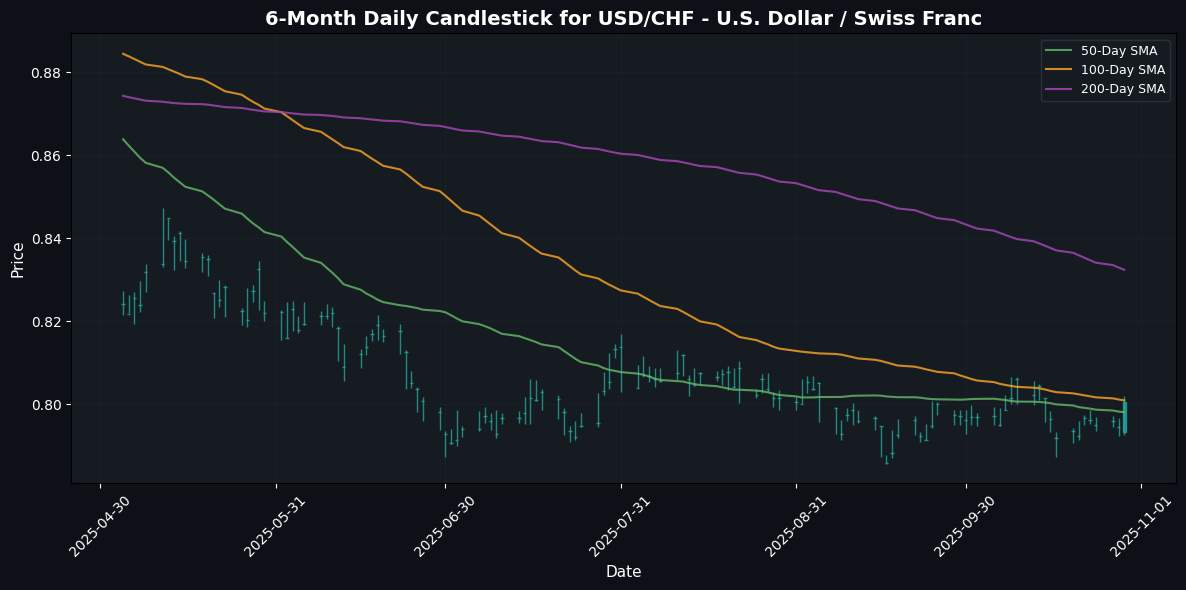
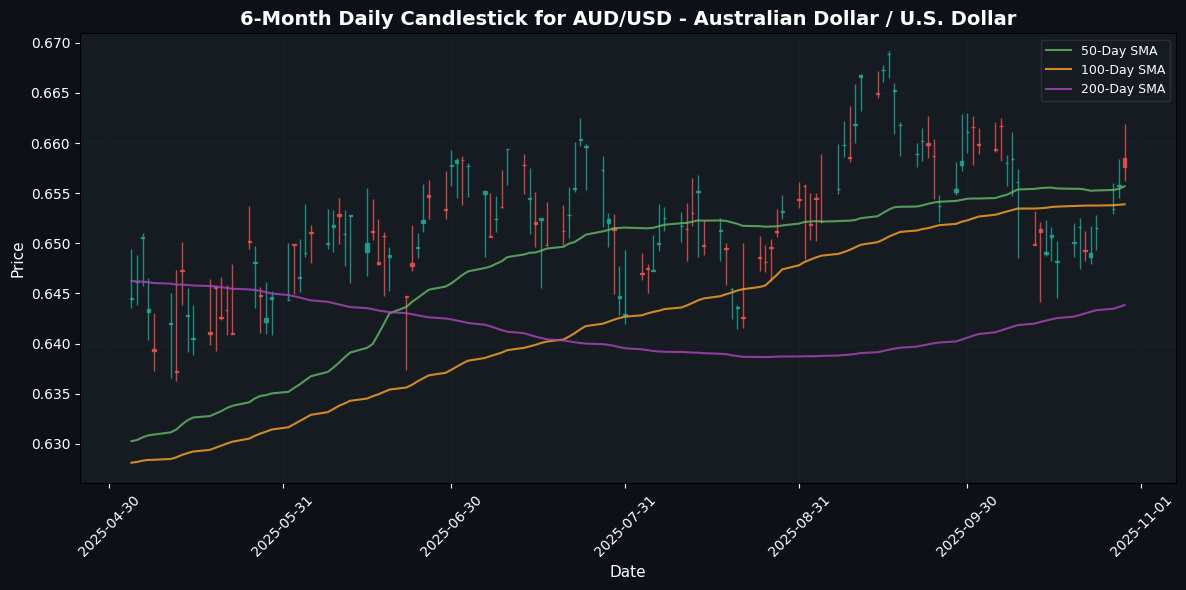
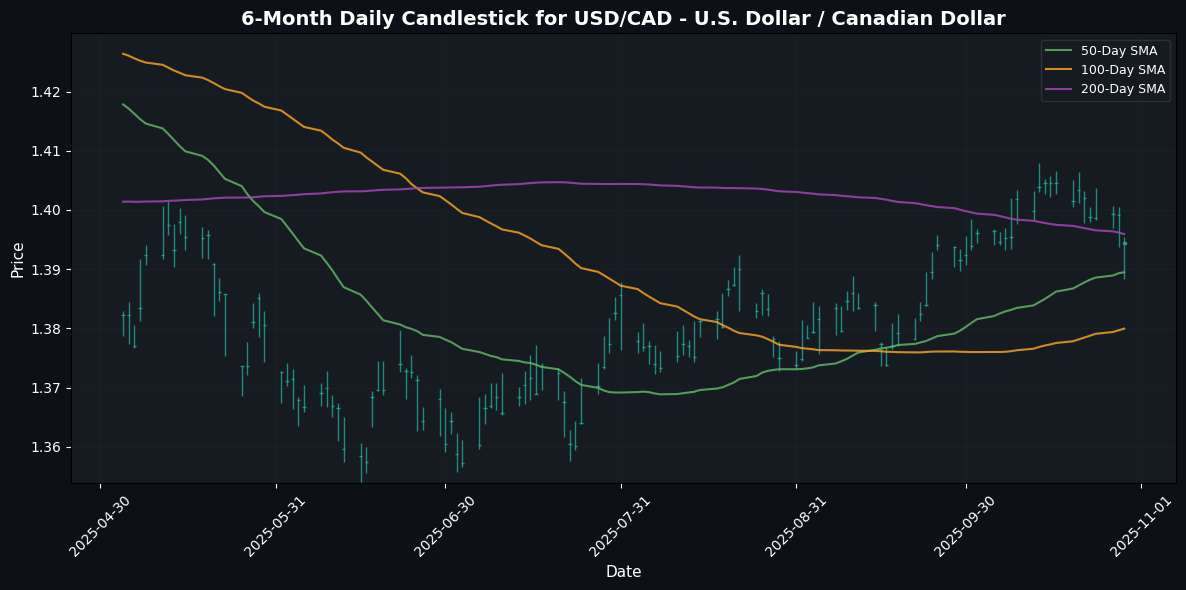
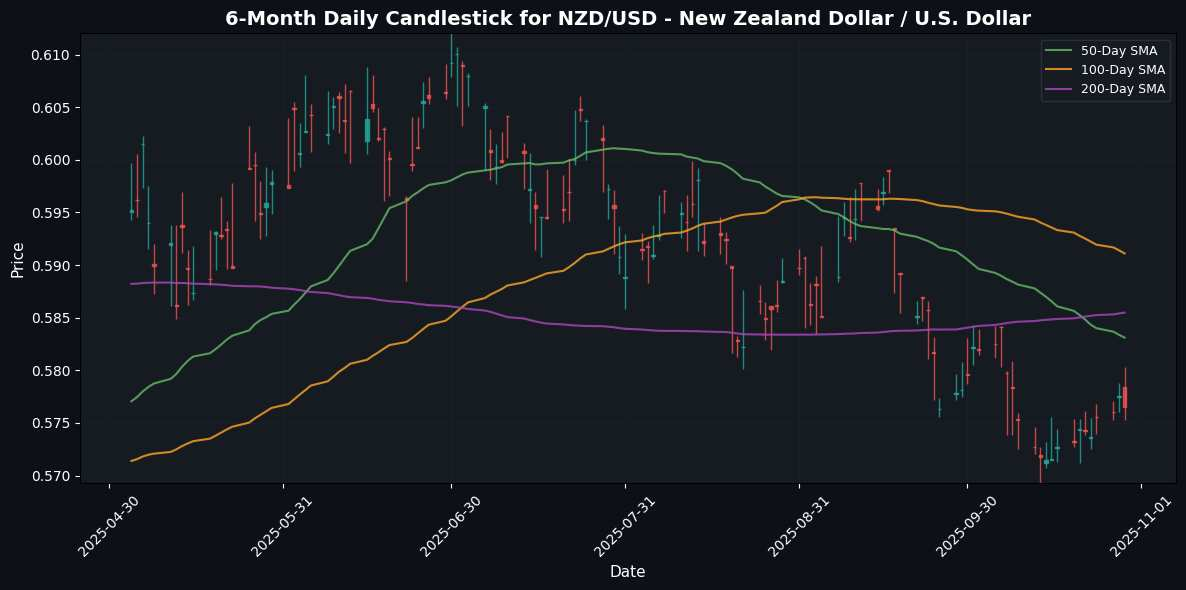
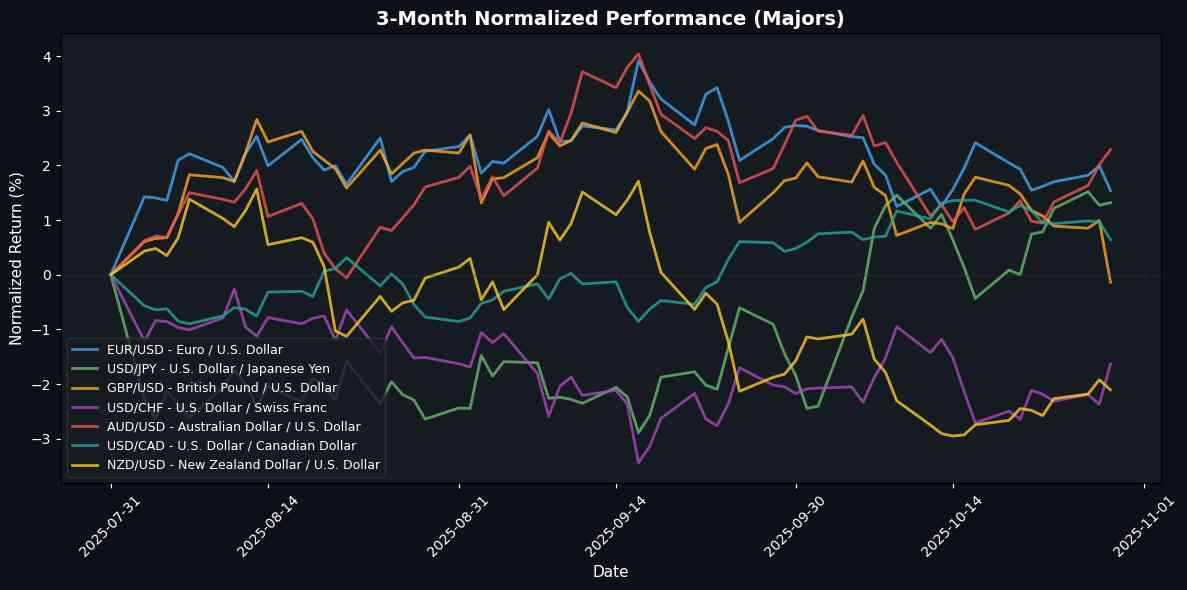
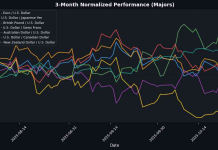
In the latest trading session, USD/CHF emerged as the top performer, gaining 0.76%, indicating strong demand for the U.S. Dollar against the Swiss Franc, likely driven by safe-haven flows amid global uncertainty. The AUD/USD also showed resilience, rising 0.27%, as a weaker U.S. Dollar sentiment supported the Australian Dollar amidst commodity price stability. Conversely, GBP/USD faced significant downward pressure, declining 1.12%, reflecting concerns over potential economic challenges in the UK. Additionally, both EUR/USD and USD/CAD weakened, with declines of 0.45% and 0.33%, respectively, suggesting that the U.S. Dollar remains robust overall despite some fluctuations against these currencies.
🔀 Cross Currency Pairs
| Name | Symbol | Price | Daily (%) | 5D (%) | 1W (%) | 1M (%) | 3M (%) | 6M (%) | YTD (%) | 12M (%) | MA50 | MA100 | MA200 | RSI | MACD |
|---|---|---|---|---|---|---|---|---|---|---|---|---|---|---|---|
| EUR/GBP | EURGBP | 0.8793 | +0.68% | +1.31% | +1.27% | +1.13% | +3.10% | +5.49% | +4.28% | +3.34% | 0.8689 | 0.8656 | 0.8534 | 72.20 | 0.00 |
| EUR/JPY | EURJPY | 177.1550 | -0.42% | +0.54% | +0.71% | +1.93% | +5.26% | +11.10% | +10.27% | +4.21% | 174.3236 | 172.4742 | 166.9352 | 46.61 | 0.87 |
| EUR/CHF | EURCHF | 0.9284 | +0.29% | +0.47% | +0.37% | -0.48% | -0.69% | -1.63% | -0.86% | -5.11% | 0.9326 | 0.9343 | 0.9381 | 39.32 | -0.00 |
| EUR/AUD | EURAUD | 1.7641 | -0.69% | -1.27% | -1.60% | -0.59% | -1.33% | +6.91% | +7.57% | +7.99% | 1.7823 | 1.7841 | 1.7533 | 49.08 | -0.00 |
| GBP/JPY | GBPJPY | 201.4640 | -1.10% | -0.75% | -0.55% | +0.78% | +2.09% | +5.32% | +5.73% | +0.84% | 200.6132 | 199.2409 | 195.5421 | 34.09 | 0.70 |
| GBP/CHF | GBPCHF | 1.0558 | -0.39% | -0.83% | -0.90% | -1.60% | -3.68% | -6.75% | -4.93% | -8.17% | 1.0733 | 1.0793 | 1.0995 | 20.92 | -0.00 |
| AUD/JPY | AUDJPY | 100.4100 | +0.27% | +1.83% | +2.35% | +2.53% | +6.67% | +3.92% | +2.50% | -3.50% | 97.8038 | 96.6634 | 95.1987 | 49.19 | 0.53 |
| AUD/NZD | AUDNZD | 1.1404 | +0.43% | +0.88% | +0.61% | +2.13% | +5.56% | +2.86% | +5.03% | +5.20% | 1.1244 | 1.1064 | 1.0997 | 52.41 | 0.00 |
| CHF/JPY | CHFJPY | 190.7860 | -0.69% | +0.09% | +0.36% | +2.42% | +5.99% | +12.94% | +11.20% | +9.82% | 186.9056 | 184.5883 | 177.9673 | 52.93 | 1.38 |
| NZD/JPY | NZDJPY | 88.0050 | -0.18% | +0.92% | +1.77% | +0.37% | +1.02% | +1.00% | -2.46% | -8.31% | 86.9562 | 87.3521 | 86.5476 | 47.22 | 0.24 |
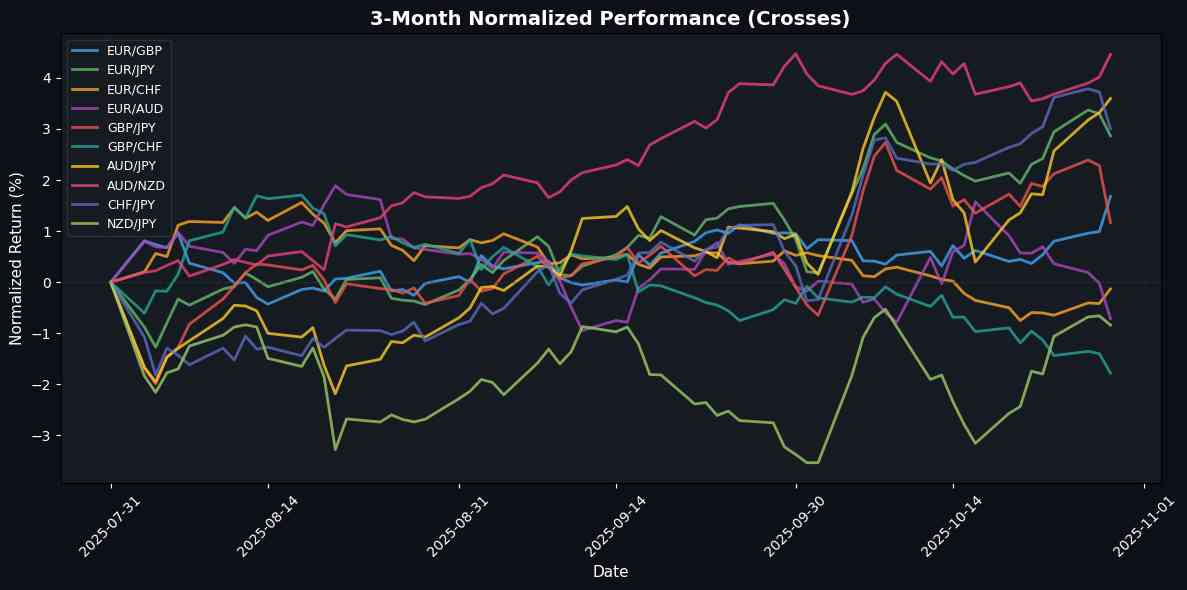
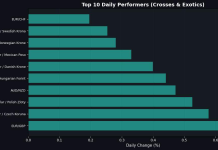
In the recent trading session, the EUR/GBP emerged as the top performer, gaining 0.68%, indicating strengthened bullish sentiment amidst a stable eurozone backdrop. The AUD/NZD also showed resilience with a 0.43% increase, reflecting positive economic signals from Australia compared to New Zealand. Conversely, the GBP/JPY faced notable weakness, declining by 1.10%, likely influenced by ongoing concerns over UK economic data and Bank of England policies. Similarly, the CHF/JPY and EUR/AUD pairings struggled, with both declining by 0.69%, suggesting a broader risk-off sentiment impacting these markets.
🌍 Exotic and Emerging Market Currencies
| Name | Symbol | Price | Daily (%) | 5D (%) | 1W (%) | 1M (%) | 3M (%) | 6M (%) | YTD (%) | 12M (%) | MA50 | MA100 | MA200 | RSI | MACD |
|---|---|---|---|---|---|---|---|---|---|---|---|---|---|---|---|
| USD/TRY – U.S. Dollar / Turkish Lira | USDTRY | 41.9418 | -0.04% | -0.06% | +0.03% | +1.54% | +5.85% | +15.85% | +22.85% | +30.08% | 41.4949 | 40.8507 | 39.1966 | 75.55 | 0.15 |
| USD/ZAR – U.S. Dollar / South African Rand | USDZAR | 17.2000 | -0.06% | -1.08% | -0.95% | -0.79% | -2.94% | -6.25% | -3.51% | -8.05% | 17.3995 | 17.5853 | 17.9905 | 52.22 | -0.03 |
| USD/THB – U.S. Dollar / Thai Baht | USDTHB | 32.3800 | -0.74% | -1.46% | -1.13% | +2.27% | -0.77% | -3.98% | -4.88% | -11.73% | 32.2974 | 32.3833 | 32.9537 | 45.36 | 0.10 |
| USD/SEK – U.S. Dollar / Swedish Krona | USDSEK | 9.4205 | +0.47% | -0.07% | -0.04% | +2.14% | -0.92% | -11.97% | -7.59% | -11.02% | 9.4206 | 9.4969 | 9.8166 | 48.98 | -0.01 |
| USD/NOK – U.S. Dollar / Norwegian Krone | USDNOK | 10.0257 | +0.39% | -0.33% | -0.31% | +2.78% | -0.87% | -9.82% | -4.55% | -4.98% | 9.9991 | 10.0655 | 10.3766 | 55.33 | 0.01 |
| USD/DKK – U.S. Dollar / Danish Krone | USDDKK | 6.4387 | +0.45% | +0.02% | +0.51% | +2.40% | +0.23% | -9.47% | -3.97% | -6.49% | 6.3884 | 6.3980 | 6.6198 | 53.69 | 0.01 |
| USD/MXN – U.S. Dollar / Mexican Peso | USDMXN | 18.4638 | +0.40% | +0.16% | +0.54% | +0.97% | -2.78% | -9.10% | -6.11% | +8.57% | 18.4883 | 18.6262 | 19.3224 | 59.42 | -0.01 |
| USD/PLN – U.S. Dollar / Polish Zloty | USDPLN | 3.6581 | +0.70% | +0.15% | +0.49% | +2.30% | -0.08% | -7.94% | -5.23% | -7.39% | 3.6392 | 3.6465 | 3.7568 | 50.23 | 0.00 |
| USD/HUF – U.S. Dollar / Hungarian Forint | USDHUF | 335.1200 | +0.59% | -0.06% | +0.37% | +2.16% | -2.99% | -12.41% | -5.23% | -6.74% | 334.9285 | 338.7096 | 354.2720 | 46.21 | 0.01 |
| USD/CZK – U.S. Dollar / Czech Koruna | USDCZK | 20.9890 | +0.61% | +0.30% | +0.74% | +2.52% | -1.51% | -12.03% | -6.76% | -7.97% | 20.8294 | 20.9838 | 21.9463 | 53.24 | 0.03 |
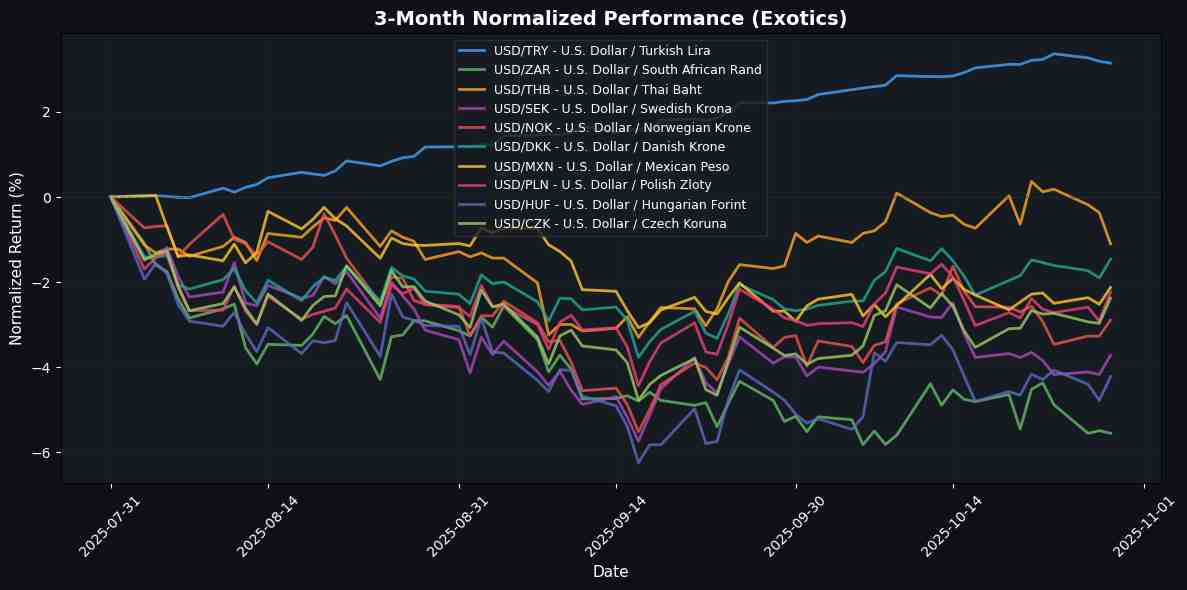
In the latest trading session, the exotics currency pairs displayed a mixed performance, with the U.S. dollar strengthening notably against several Central European currencies. The USD/PLN, USD/CZK, and USD/HUF all showed positive movements, suggesting a trend of investor confidence in the U.S. dollar as regional economic conditions may be favoring dollar stability or growth. Conversely, the USD/THB, USD/ZAR, and USD/TRY recorded slight declines, indicating some weakness in emerging market currencies, potentially due to concerns over local economic conditions or geopolitical factors impacting investor sentiment. Overall, the contrast highlights the divergence between developed and emerging market currencies during this period.
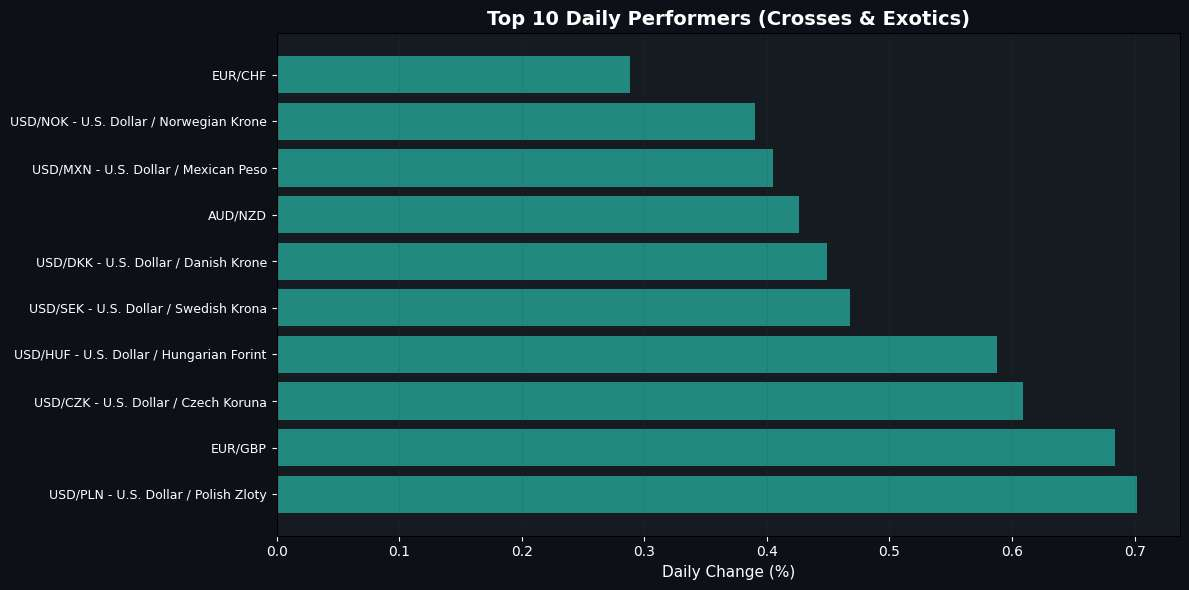
🏆 Top Daily Performers (Crosses & Exotics)
Disclaimer
The content on MarketsFN.com is provided for educational and informational purposes only. It does not constitute financial advice, investment recommendations, or trading guidance. All investments involve risks, and past performance does not guarantee future results. You are solely responsible for your investment decisions and should conduct independent research and consult a qualified financial advisor before acting. MarketsFN.com and its authors are not liable for any losses or damages arising from your use of this information.


