Forex Update: Traders Await US Data, USD/JPY Climbs 0.44%
📰 Forex and Global Market News
**Market Overview:**
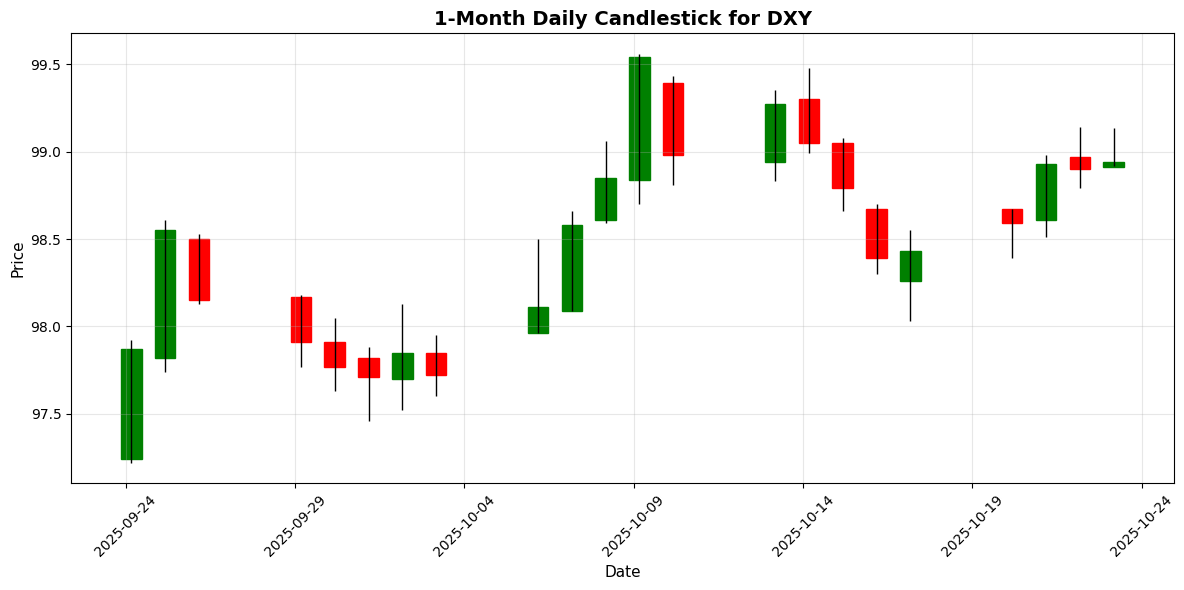
Today’s forex market reflected cautious sentiment as traders braced for key economic indicators, particularly the upcoming U.S. Consumer Price Index (CPI) report. The U.S. Dollar (USD) remained resilient, closing at 98.94 (-0.1363%), while other currencies showed mixed movements amidst geopolitical tensions and commodity price fluctuations.
**Key News Items:**
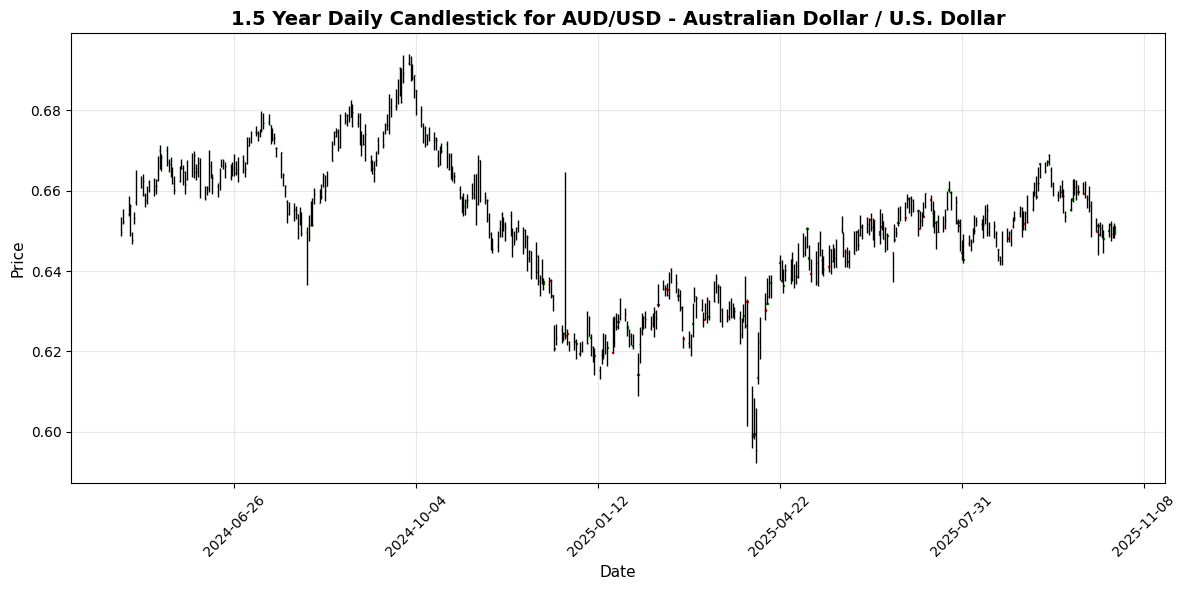
The Euro (EUR) struggled to maintain momentum, trading around 1.1600, as investors awaited the U.S. CPI data, which is expected to provide insights into future Federal Reserve policy. The Australian Dollar (AUD) recovered slightly, breaking above 0.6500, while the Japanese Yen (JPY) remained under pressure amid ongoing U.S.-China trade concerns. The Canadian Dollar (CAD) faced headwinds from rising oil prices, with West Texas Intermediate (WTI) surging due to new U.S. sanctions on Russian oil producers, raising supply concerns.
Geopolitical events also influenced market dynamics, with U.S. military maneuvers near Venezuela heightening tensions. Investors are closely watching these developments, as they could impact risk sentiment in the forex market.
**Closing:**
As the market anticipates the U.S. CPI release, the DXY index remains a focal point, reflecting the USD’s strength amidst a backdrop of geopolitical uncertainty and fluctuating commodity prices.
📅 Economic Calendar Events Today
All times are in US Eastern Time (ET)
| Date | Time | Cur | Imp | Event | Actual | Forecast |
|---|---|---|---|---|---|---|
| 2025-10-23 | 01:00 | Medium | Core CPI (YoY) (Sep) | 0.40% | 0.20% | |
| 2025-10-23 | 01:00 | Medium | CPI (YoY) (Sep) | 0.7% | 0.6% | |
| 2025-10-23 | 03:25 | 🇨🇭 | Medium | SNB Monetary Policy Assessment | ||
| 2025-10-23 | 08:30 | 🇨🇦 | Medium | Core Retail Sales (MoM) (Aug) | 0.7% | 1.3% |
| 2025-10-23 | 08:30 | 🇨🇦 | Medium | Retail Sales (MoM) (Aug) | 1.0% | 1.0% |
| 2025-10-23 | 08:31 | 🇨🇦 | Medium | Retail Sales (MoM) (Sep) | -0.7% | |
| 2025-10-23 | 09:30 | 🇪🇺 | Medium | ECB’s Lane Speaks | ||
| 2025-10-23 | 10:00 | 🇺🇸 | High | Existing Home Sales (Sep) | 4.06M | 4.06M |
| 2025-10-23 | 10:00 | 🇺🇸 | Medium | Existing Home Sales (MoM) (Sep) | 1.5% | |
| 2025-10-23 | 10:00 | 🇺🇸 | Medium | FOMC Member Bowman Speaks | ||
| 2025-10-23 | 10:25 | 🇺🇸 | Medium | Fed Vice Chair for Supervision Barr Speaks | ||
| 2025-10-23 | 13:00 | 🇺🇸 | Medium | 5-Year TIPS Auction | 1.182% | |
| 2025-10-23 | 16:30 | 🇺🇸 | Medium | Fed’s Balance Sheet | 6,590B | |
| 2025-10-23 | 19:30 | 🇯🇵 | Medium | National Core CPI (YoY) (Sep) | 2.9% | |
| 2025-10-23 | 19:30 | 🇯🇵 | Medium | National CPI (MoM) (Sep) | ||
| 2025-10-23 | 20:30 | 🇯🇵 | Medium | au Jibun Bank Services PMI (Oct) |
**Overview:**
Today’s economic calendar features several high-impact events, particularly from Singapore, Canada, and the U.S., which are crucial for forex traders. Key releases include inflation data, retail sales, and central bank communications, all of which can significantly influence currency movements.
**Key Releases:**
1. **Singapore (01:00 ET):** Core CPI (YoY) came in at 0.40%, surpassing the forecast of 0.20%. CPI (YoY) also exceeded expectations at 0.7% vs. 0.6%. This positive inflation data may strengthen the SGD against its peers.
2. **Canada (08:30 ET):** Core Retail Sales (MoM) for August were lower than forecast at 0.7% (expected 1.3%), while Retail Sales for August met expectations at 1.0%. However, September Retail Sales dropped sharply by 0.7%, indicating potential economic weakness, which could weaken the CAD.
3. **U.S. (10:00 ET):** Existing Home Sales for September matched forecasts at 4.06M, with a solid MoM increase of 1.5%. This stability could support the USD.
**FX Impact:**
The SGD is likely to appreciate against weaker currencies due to strong inflation data. The CAD may face downward pressure due to disappointing retail sales figures, while the USD could remain stable or strengthen slightly following steady home sales data. Traders should watch the SGD/CAD and USD/CAD pairs closely for potential volatility.
💱 Major Currency Pairs
| Name | Symbol | Price | Daily (%) | 5D (%) | 1W (%) | 1M (%) | 3M (%) | 6M (%) | YTD (%) | 12M (%) | MA50 | MA100 | MA200 | RSI | MACD |
|---|---|---|---|---|---|---|---|---|---|---|---|---|---|---|---|
| EUR/USD – Euro / U.S. Dollar | EURUSD | 1.1620 | +0.0517 | -0.6804 | -0.2260 | -1.5344 | -1.1580 | +2.1816 | +11.66 | +7.6198 | 1.1690 | 1.1659 | 1.1267 | 39.07 | -0.0024 |
| USD/JPY – U.S. Dollar / Japanese Yen | USDJPY | 152.56 | +0.4418 | +1.6287 | +1.0538 | +3.2764 | +3.7822 | +6.7792 | -2.8217 | +0.9442 | 148.79 | 147.52 | 147.98 | 72.35 | 0.9375 |
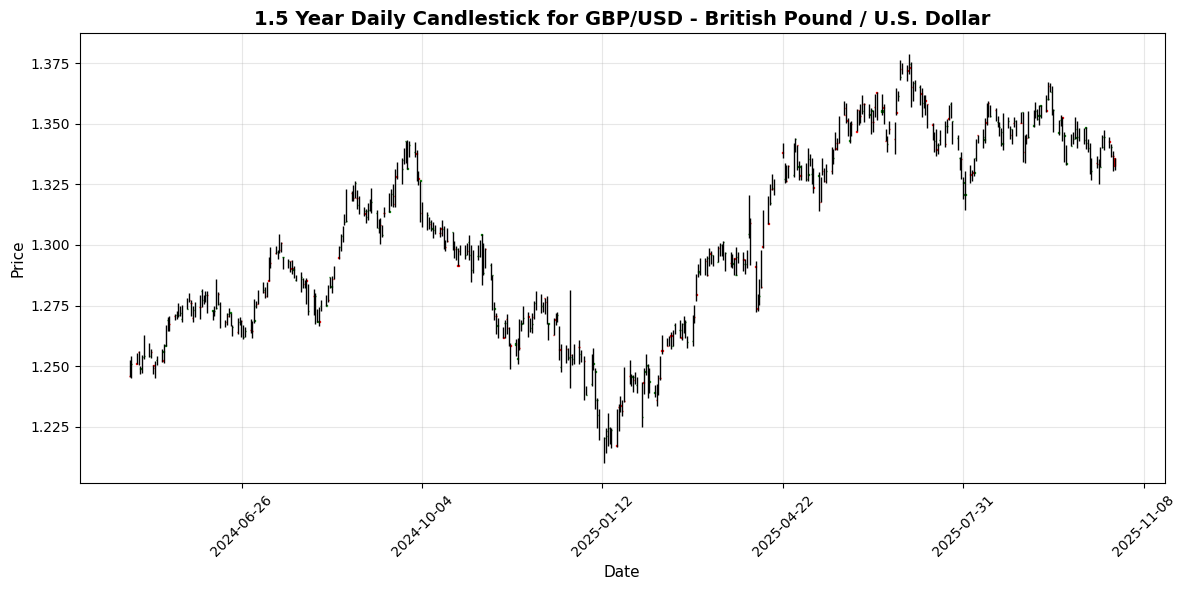
| GBP/USD – British Pound / U.S. Dollar | GBPUSD | 1.3325 | -0.2321 | -0.8966 | -0.5928 | -1.4057 | -1.3697 | -0.0092 | +6.1829 | +2.6358 | 1.3467 | 1.3487 | 1.3206 | 38.59 | -0.0030 |
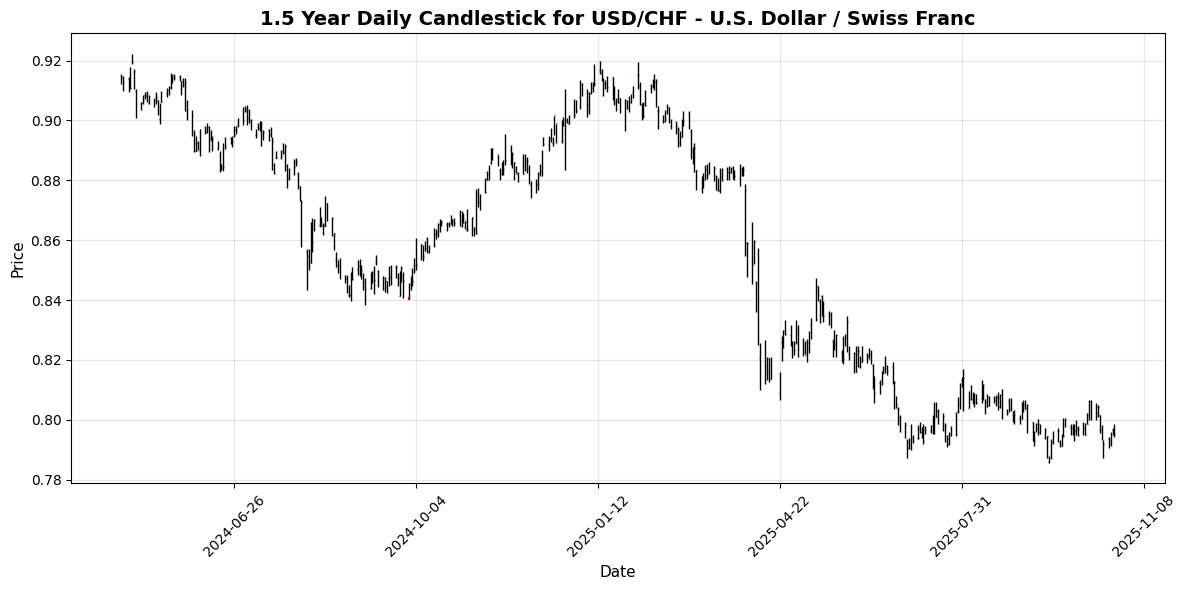
| USD/CHF – U.S. Dollar / Swiss Franc | USDCHF | 0.7953 | -0.0754 | +0.4382 | -0.1569 | +0.3672 | +0.0541 | -4.0350 | -11.95 | -8.1141 | 0.7989 | 0.8019 | 0.8347 | 47.91 | -0.0008 |
| AUD/USD – Australian Dollar / U.S. Dollar | AUDUSD | 0.6512 | +0.3235 | +0.4567 | +0.0614 | -1.3632 | -1.2911 | +1.6947 | +4.6945 | -2.6024 | 0.6553 | 0.6538 | 0.6432 | 35.99 | -0.0022 |
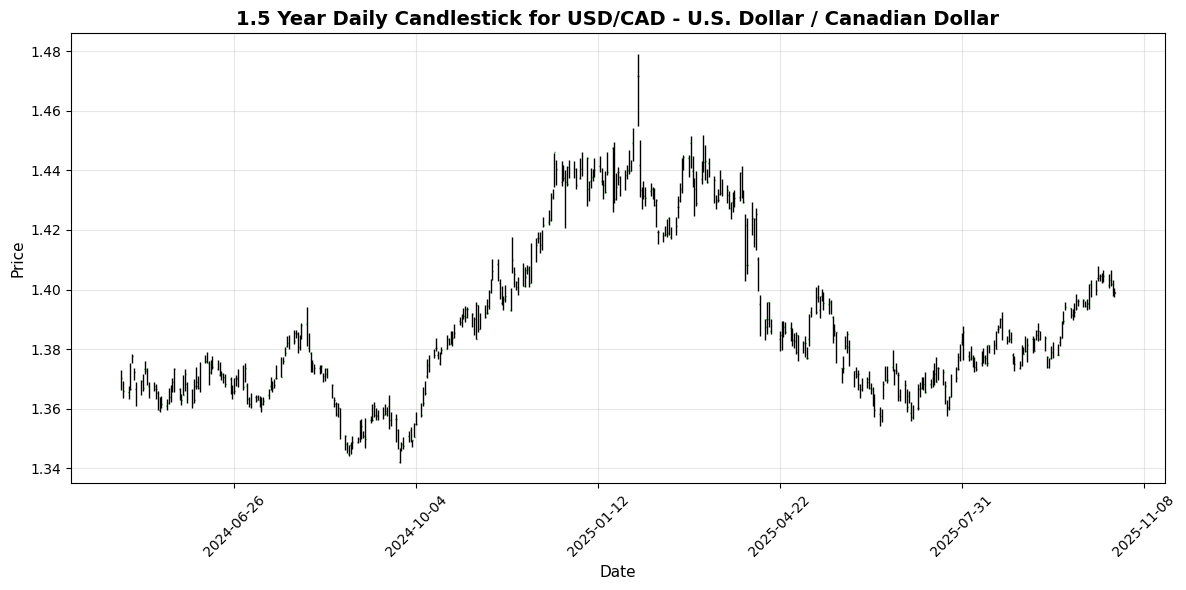
| USD/CAD – U.S. Dollar / Canadian Dollar | USDCAD | 1.3988 | -0.0071 | -0.4129 | -0.4129 | +1.1798 | +2.5468 | +0.9381 | -2.5213 | +1.2435 | 1.3882 | 1.3788 | 1.3967 | 55.32 | 0.0046 |
| NZD/USD – New Zealand Dollar / U.S. Dollar | NZDUSD | 0.5753 | +0.2265 | +0.4537 | +0.6453 | -1.9731 | -4.7062 | -3.9243 | +2.0087 | -4.8431 | 0.5844 | 0.5922 | 0.5852 | 32.34 | -0.0036 |
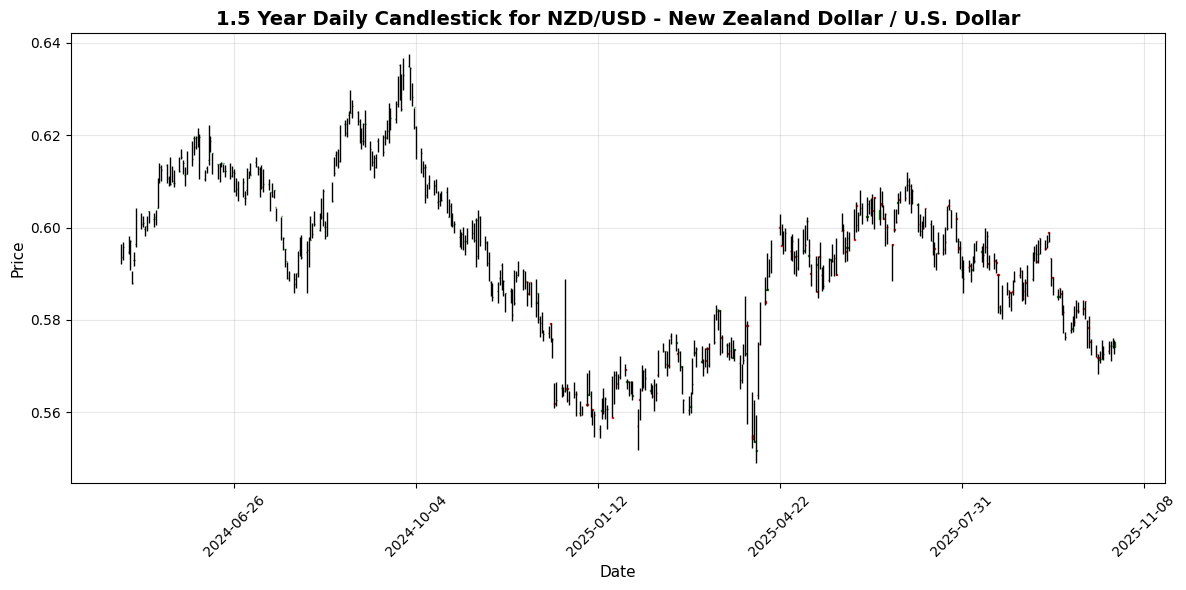
**Overview:**
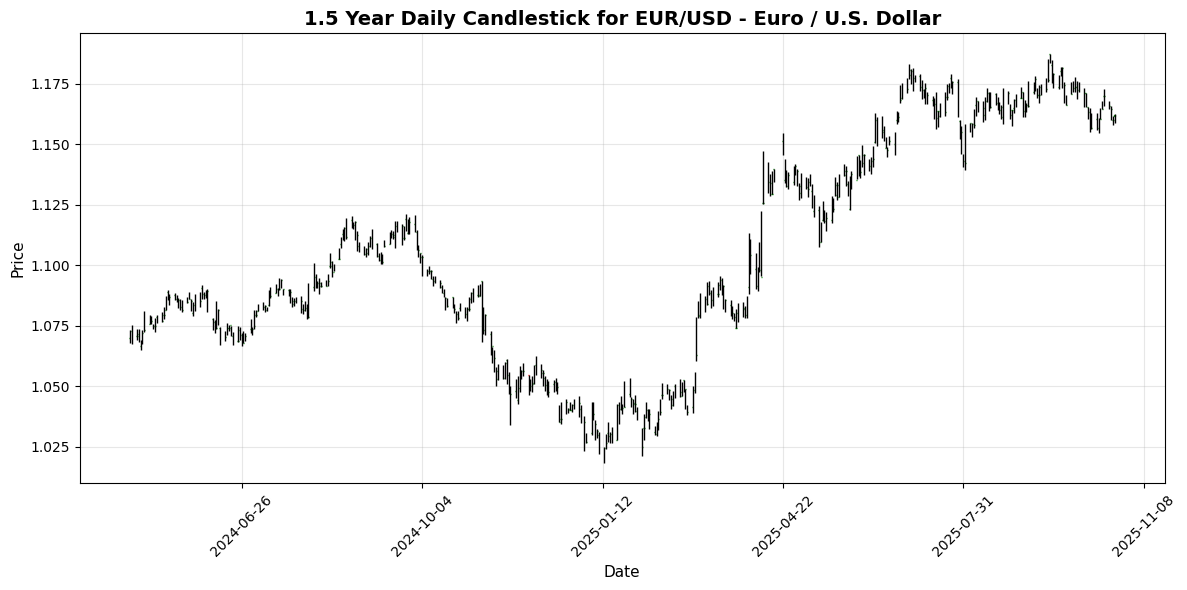
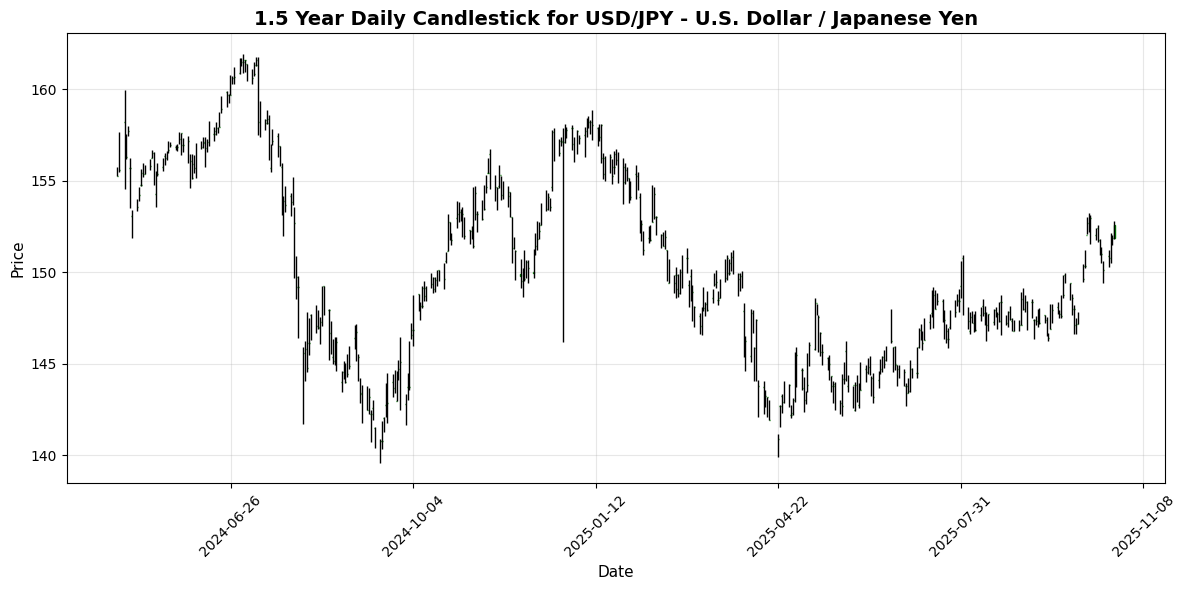
The Majors FX group is currently exhibiting mixed signals, with the USD showing strength against several currencies, particularly the JPY. The overall trend appears bullish for the USD, while other pairs are struggling to gain momentum.
**Key Pairs:**
1. **USD/JPY**: Currently priced at 152.5650, the pair shows a bullish momentum with a MACD of 0.9375 and an RSI of 72.35, indicating overbought conditions. Traders should watch for potential pullbacks as the price approaches resistance levels.
2. **EUR/USD**: Priced at 1.1620, this pair is neutral-bearish with an RSI of 39.07 and a MACD of -0.0024. The price action suggests a lack of buying interest, and further declines could test support levels.
3. **GBP/USD**: At 1.3325, this pair also reflects weakness with an RSI of 38.59 and a MACD of -0.0030. The bearish momentum indicates potential for further downside.
**Trading Implications:**
For USD/JPY, watch for resistance near 153.00, while support is found around 151.50. In contrast, EUR/USD and GBP
🔀 Cross Currency Pairs
| Name | Symbol | Price | Daily (%) | 5D (%) | 1W (%) | 1M (%) | 3M (%) | 6M (%) | YTD (%) | 12M (%) | MA50 | MA100 | MA200 | RSI | MACD |
|---|---|---|---|---|---|---|---|---|---|---|---|---|---|---|---|
| EUR/GBP | EURGBP | 0.8717 | +0.2646 | +0.1816 | +0.3350 | -0.1603 | +0.1724 | +2.1623 | +5.1267 | +4.8195 | 0.8680 | 0.8644 | 0.8528 | 49.51 | 0.0002 |
| EUR/JPY | EURJPY | 177.23 | +0.4751 | +0.9133 | +0.8048 | +1.6664 | +2.5612 | +9.0919 | +8.4756 | +8.6126 | 173.91 | 171.98 | 166.61 | 75.16 | 0.7305 |
| EUR/CHF | EURCHF | 0.9237 | -0.0541 | -0.2861 | -0.4237 | -1.2138 | -1.1462 | -1.9791 | -1.7236 | -1.1525 | 0.9339 | 0.9348 | 0.9384 | 18.53 | -0.0028 |
| EUR/AUD | EURAUD | 1.7840 | -0.2906 | -1.1454 | -0.3085 | -0.2070 | +0.0965 | +0.4244 | +6.6220 | +10.46 | 1.7839 | 1.7832 | 1.7509 | 53.57 | 0.0022 |
| GBP/JPY | GBPJPY | 203.25 | +0.1848 | +0.7020 | +0.4423 | +1.8113 | +2.3506 | +6.7561 | +3.1757 | +3.5905 | 200.34 | 198.94 | 195.30 | 70.34 | 0.8112 |
| GBP/CHF | GBPCHF | 1.0597 | -0.2917 | -0.4584 | -0.7428 | -1.0274 | -1.3113 | -4.0422 | -6.4984 | -5.6879 | 1.0758 | 1.0814 | 1.1006 | 30.04 | -0.0034 |
| AUD/JPY | AUDJPY | 99.28 | +0.7080 | +2.0296 | +1.0617 | +1.8204 | +2.4053 | +8.5748 | +1.7004 | -1.7039 | 97.48 | 96.43 | 95.15 | 61.58 | 0.2880 |
| AUD/NZD | AUDNZD | 1.1316 | +0.0707 | -0.0247 | -0.6007 | +0.6171 | +3.5827 | +5.8738 | +2.6213 | +2.3554 | 1.1213 | 1.1041 | 1.0992 | 47.34 | 0.0031 |
| CHF/JPY | CHFJPY | 191.82 | +0.5177 | +1.1883 | +1.2259 | +2.9006 | +3.7349 | +11.28 | +10.37 | +9.8572 | 186.21 | 183.96 | 177.57 | 87.70 | 1.3548 |
| NZD/JPY | NZDJPY | 87.72 | +0.6506 | +2.0523 | +1.6632 | +1.2174 | -1.1395 | +2.5487 | -0.9139 | -3.9687 | 86.91 | 87.33 | 86.54 | 65.19 | 0.0106 |
**Overview:**
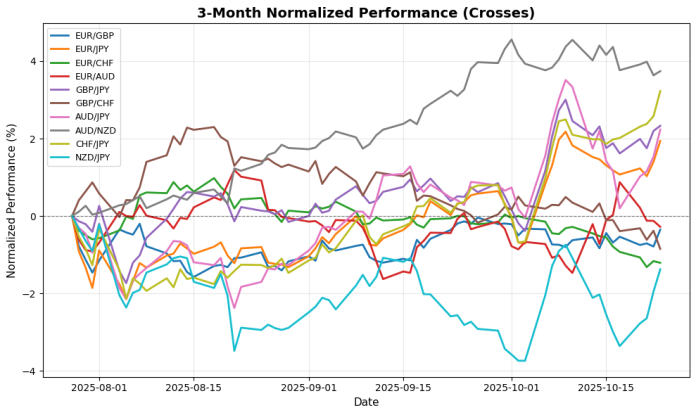
The Crosses FX group exhibits a mixed trend, with bullish momentum in select pairs, while others show signs of weakness. The overall sentiment leans towards strength in the JPY crosses.
**Key Pairs:**
1. **EUR/JPY**: Trading at 177.2340, the RSI at 75.16 indicates overbought conditions, while the positive MACD of 0.7305 suggests strong bullish momentum.
2. **CHF/JPY**: Priced at 191.8190, this pair shows an RSI of 87.70, signaling extreme overbought territory, complemented by a robust MACD of 1.3548, indicating strong upward momentum.
3. **EUR/CHF**: At 0.9237, this pair’s RSI of 18.53 signals oversold conditions, with a negative MACD of -0.0028, suggesting bearish momentum.
**Trading Implications:**
For EUR/JPY and CHF/JPY, watch for potential pull
🌍 Exotic and Emerging Market Currencies
| Name | Symbol | Price | Daily (%) | 5D (%) | 1W (%) | 1M (%) | 3M (%) | 6M (%) | YTD (%) | 12M (%) | MA50 | MA100 | MA200 | RSI | MACD |
|---|---|---|---|---|---|---|---|---|---|---|---|---|---|---|---|
| USD/TRY – U.S. Dollar / Turkish Lira | USDTRY | 41.94 | -0.0489 | +0.0993 | +0.2072 | +1.3191 | +3.4584 | +9.1706 | +18.79 | +22.44 | 41.41 | 40.74 | 39.07 | 88.95 | 0.1653 |
| USD/ZAR – U.S. Dollar / South African Rand | USDZAR | 17.31 | -0.5612 | -0.1417 | -0.1972 | -0.1154 | -1.7158 | -7.6718 | -7.7485 | -1.2149 | 17.43 | 17.60 | 17.99 | 51.81 | -0.0231 |
| USD/THB – U.S. Dollar / Thai Baht | USDTHB | 32.77 | +0.0305 | +0.8308 | +0.7378 | +3.2126 | +1.5180 | -1.8568 | -4.0101 | -2.2083 | 32.29 | 32.38 | 32.99 | 60.25 | 0.1493 |
| USD/SEK – U.S. Dollar / Swedish Krona | USDSEK | 9.3771 | -0.2903 | -0.4092 | -0.9793 | +0.2112 | -1.5700 | -2.4966 | -14.94 | -11.05 | 9.4347 | 9.5044 | 9.8518 | 48.08 | 0.0015 |
| USD/NOK – U.S. Dollar / Norwegian Krone | USDNOK | 9.9659 | -0.4575 | -0.9186 | -1.2866 | +0.5549 | -1.5173 | -4.3470 | -12.02 | -8.7514 | 10.02 | 10.07 | 10.40 | 49.15 | 0.0162 |
| USD/DKK – U.S. Dollar / Danish Krone | USDDKK | 6.4265 | -0.0715 | +0.6752 | +0.2155 | +1.6023 | +1.2143 | -2.1188 | -10.33 | -6.9513 | 6.3862 | 6.4020 | 6.6362 | 62.91 | 0.0143 |
| USD/MXN – U.S. Dollar / Mexican Peso | USDMXN | 18.38 | -0.2880 | -0.2518 | -0.3858 | +0.1428 | -0.8342 | -6.2046 | -10.90 | -7.7863 | 18.52 | 18.65 | 19.37 | 48.20 | -0.0202 |
| USD/PLN – U.S. Dollar / Polish Zloty | USDPLN | 3.6380 | -0.1510 | +0.2566 | -0.3503 | +0.9036 | +0.5973 | -3.0815 | -11.42 | -9.1176 | 3.6389 | 3.6501 | 3.7667 | 52.21 | 0.0027 |
| USD/HUF – U.S. Dollar / Hungarian Forint | USDHUF | 335.69 | +0.2688 | +0.7854 | +0.1584 | +1.8415 | -0.6629 | -5.9558 | -15.02 | -9.4174 | 335.22 | 339.40 | 355.58 | 60.57 | 0.1645 |
| USD/CZK – U.S. Dollar / Czech Koruna | USDCZK | 20.93 | +0.0909 | +0.8973 | +0.4946 | +1.9467 | +0.3327 | -4.5649 | -13.37 | -10.31 | 20.83 | 21.01 | 22.02 | 61.90 | 0.0285 |
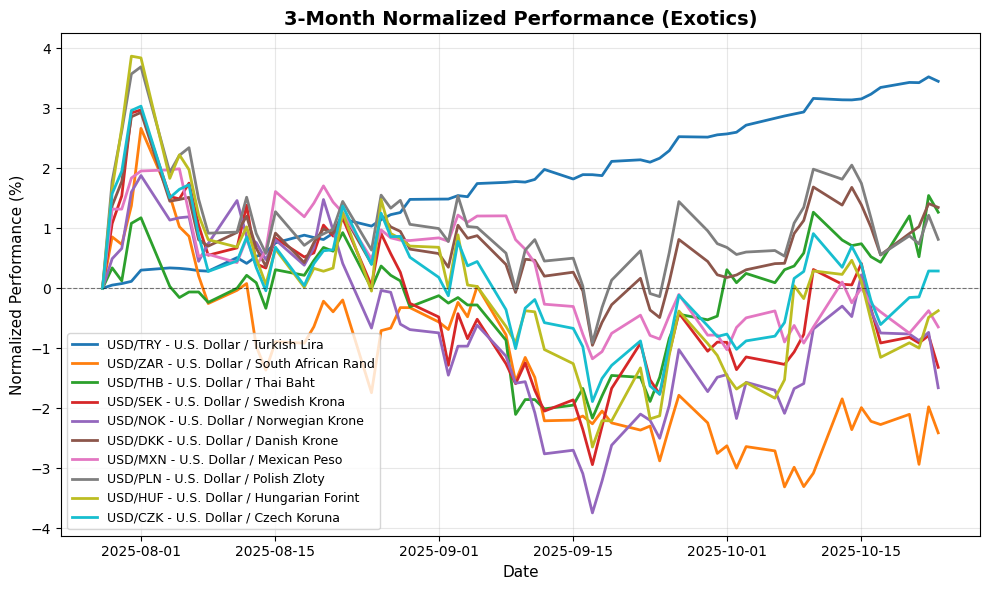
**Overview:** The Exotic FX group displays mixed momentum, with a general bearish trend in most pairs, particularly evident in the USD/ZAR and USD/NOK. However, USD/TRY indicates extreme overbought conditions.
**Key Pairs:**
1. **USD/TRY:** Currently at 41.9379, the pair shows an RSI of 88.95, indicating extreme overbought conditions. The positive MACD (0.1653) suggests bullish momentum, but caution is warranted due to potential reversal.
2. **USD/ZAR:** Trading at 17.3109, this pair has an RSI of 51.81, indicating a neutral-bullish stance. The negative MACD (-0.0231) points to bearish momentum, suggesting potential weakness.
3. **USD/HUF:** Priced at 335.6900, with an RSI of 60.57 and a positive MACD (0.1645), indicating bullish momentum.
**Trading Implications:** Watch for resistance in USD/TRY
Disclaimer
The content on MarketsFN.com is provided for educational and informational purposes only. It does not constitute financial advice, investment recommendations, or trading guidance. All investments involve risks, and past performance does not guarantee future results. You are solely responsible for your investment decisions and should conduct independent research and consult a qualified financial advisor before acting. MarketsFN.com and its authors are not liable for any losses or damages arising from your use of this information.


