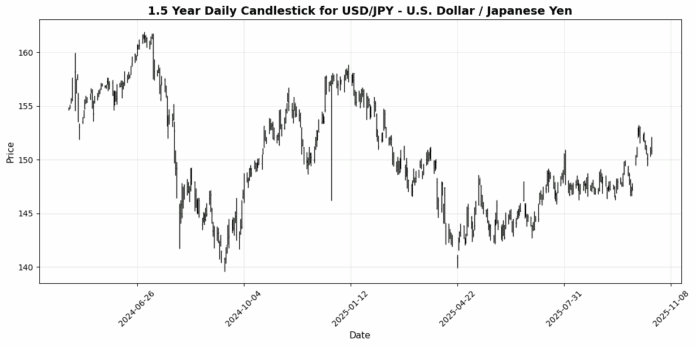
Forex Update: US Dollar Strengthens on Easing Trade Tensions, USD/JPY Climbs 0.78%
📰 Forex and Global Market News
**Market Overview:**
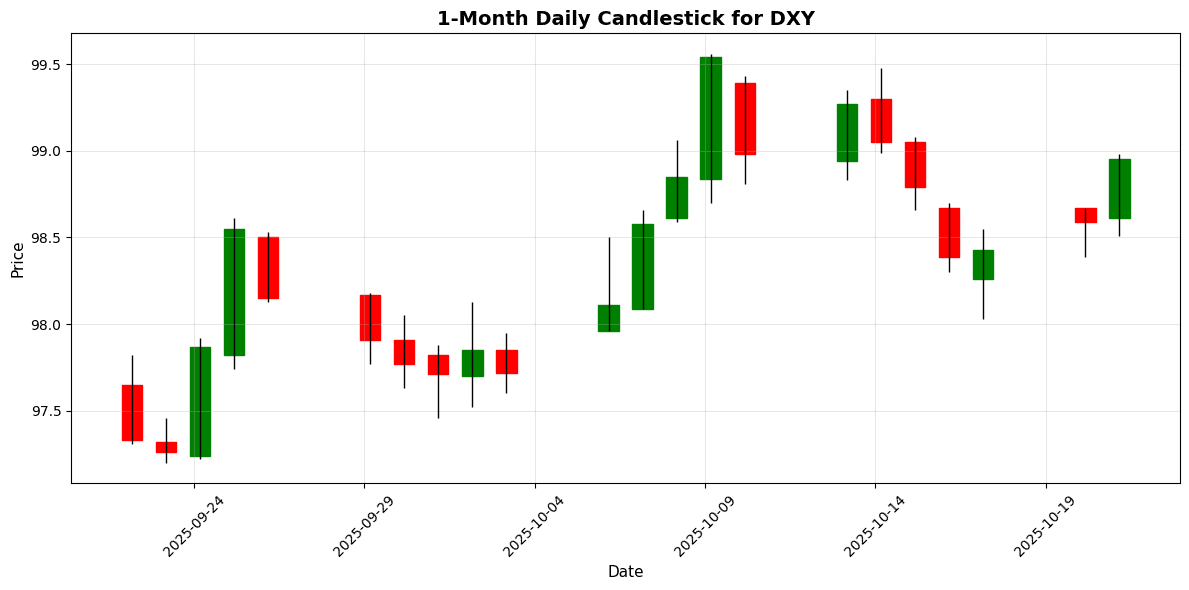
Today’s forex market saw the US Dollar (USD) regain traction amid easing trade tensions and a positive market sentiment, reflected in the Dow Jones Industrial Average reaching record highs. The focus remains on upcoming economic data, particularly the September Consumer Price Index (CPI), which is anticipated to influence future Federal Reserve policy.
**Key Currency Movements:**
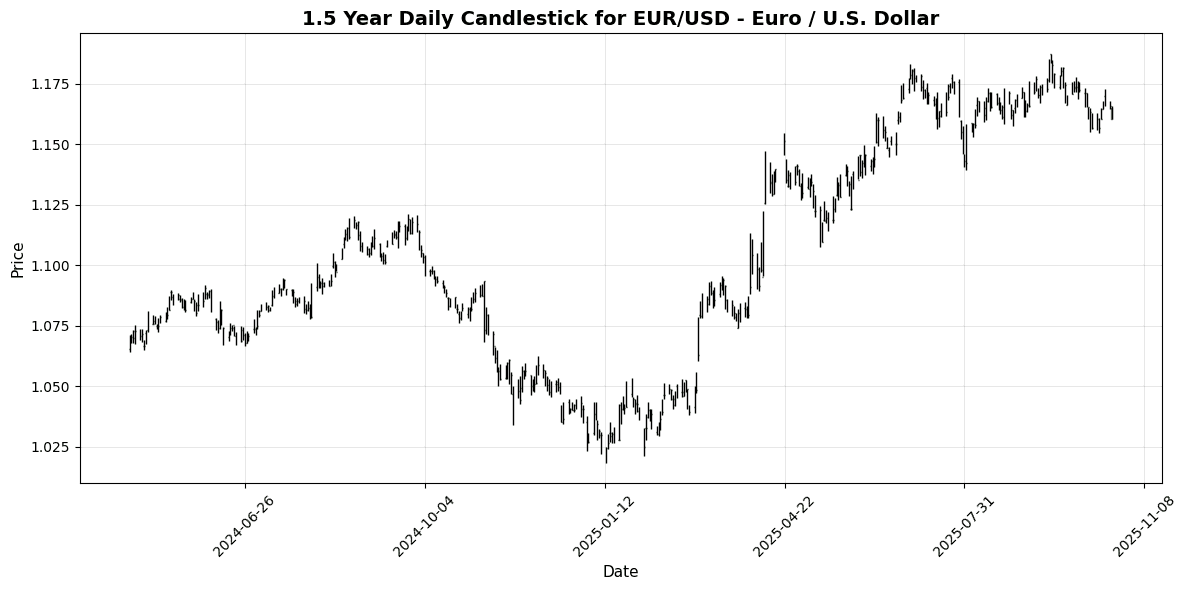
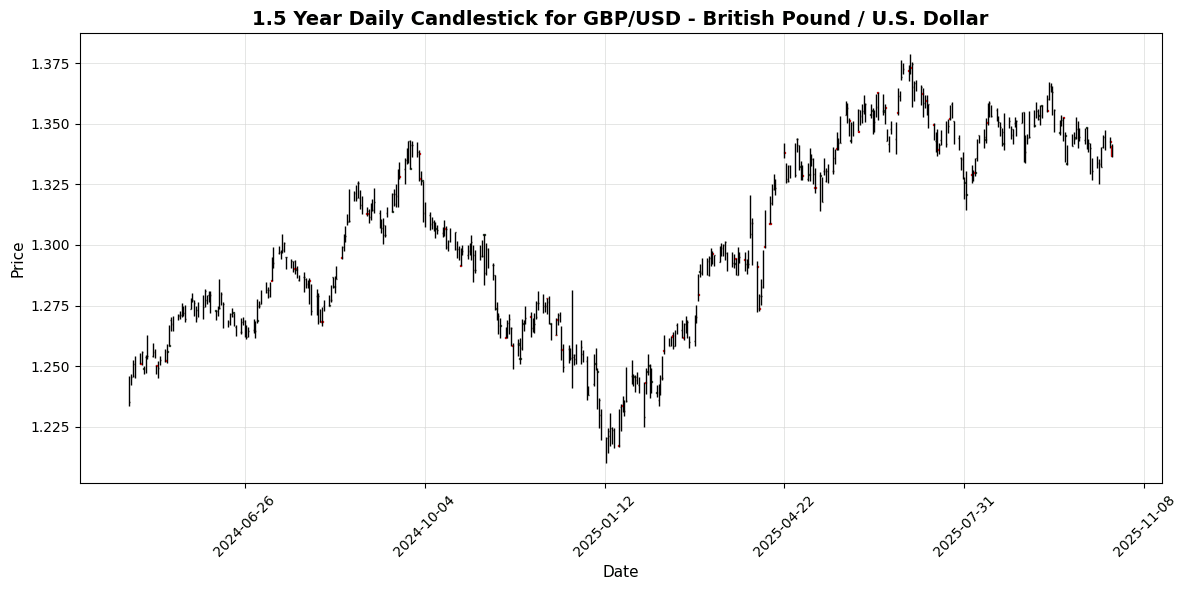
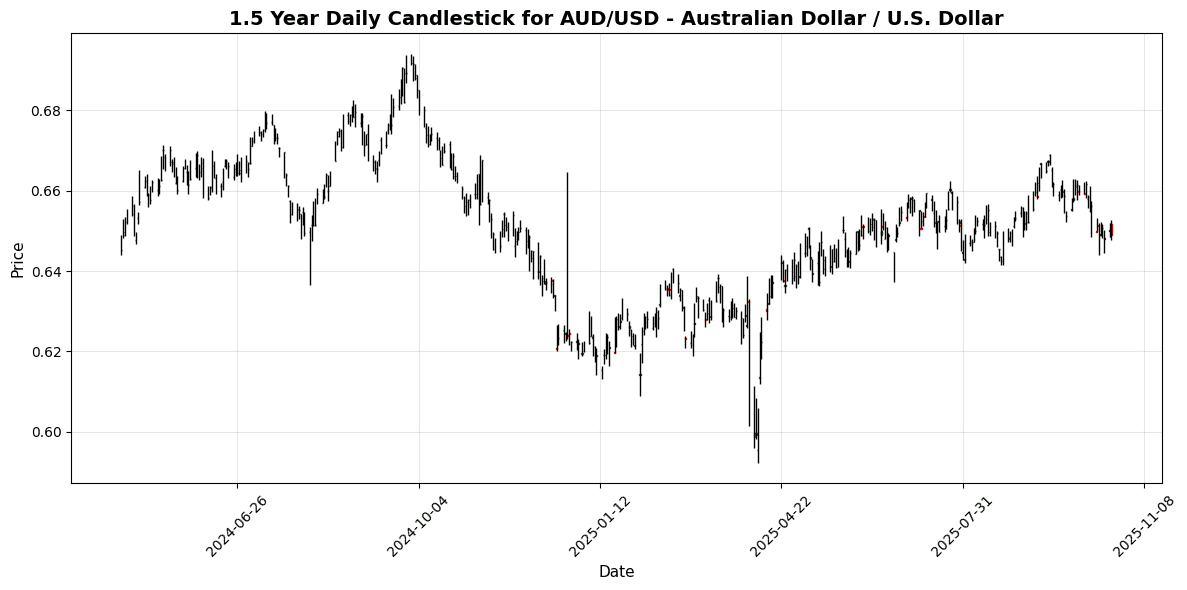
The USD strengthened against major currencies, with the EUR/USD pair testing the critical support level of 1.1600 as the Euro faced renewed selling pressure. The Australian Dollar (AUD) struggled, slipping below 0.6500 against the USD, driven by broad-based Greenback strength. The GBP also faced headwinds, while the Japanese Yen (JPY) remained stable amid cautious trading. The DXY index is currently at 98.95, reflecting a gain of 0.2482%.
**Economic Data and Geopolitical Events:**
Investors are closely watching the upcoming inflation report, which is expected to be pivotal for market direction. Geopolitical developments, including China’s call for resource-rich countries to enhance rare earth supply chains, continue to play a role in market dynamics. Additionally, gold prices plummeted over 5% today, reflecting profit-taking ahead of the CPI release and the USD’s resurgence.
**Closing:**
Overall, the combination of a strengthening USD, key economic data on the horizon, and geopolitical factors are shaping the current forex landscape, with traders positioning themselves for potential volatility in the coming
📅 Economic Calendar Events Today
All times are in US Eastern Time (ET)
| Date | Time | Cur | Imp | Event | Actual | Forecast |
|---|---|---|---|---|---|---|
| 2025-10-21 | 00:00 | 🇪🇺 | Medium | German Buba President Nagel Speaks | ||
| 2025-10-21 | 03:00 | 🇪🇺 | Medium | ECB’s Lane Speaks | ||
| 2025-10-21 | 06:30 | 🇬🇧 | Medium | BoE Gov Bailey Speaks | ||
| 2025-10-21 | 07:00 | 🇪🇺 | Medium | ECB President Lagarde Speaks | ||
| 2025-10-21 | 08:30 | 🇨🇦 | Medium | Core CPI (MoM) (Sep) | 0.2% | |
| 2025-10-21 | 08:30 | 🇨🇦 | Medium | Core CPI (YoY) (Sep) | 2.8% | |
| 2025-10-21 | 08:30 | 🇨🇦 | Medium | CPI (MoM) (Sep) | 0.1% | -0.1% |
| 2025-10-21 | 09:00 | 🇺🇸 | Medium | Fed Waller Speaks | ||
| 2025-10-21 | 13:00 | 🇪🇺 | Medium | German Buba Balz Speaks | ||
| 2025-10-21 | 15:30 | 🇺🇸 | Medium | Fed Waller Speaks | ||
| 2025-10-21 | 16:30 | 🇺🇸 | Medium | API Weekly Crude Oil Stock | ||
| 2025-10-21 | 18:00 | 🇪🇺 | Medium | German Buba President Nagel Speaks | ||
| 2025-10-21 | 19:50 | 🇯🇵 | Medium | Adjusted Trade Balance | -0.11T | |
| 2025-10-21 | 19:50 | 🇯🇵 | Medium | Exports (YoY) (Sep) | 4.6% | |
| 2025-10-21 | 19:50 | 🇯🇵 | Medium | Trade Balance (Sep) | 22.0B |
**Overview:**
Today’s economic calendar features several notable events, primarily focused on central bank speeches and inflation data, impacting major currencies. Traders should pay close attention to the implications of these releases on the EUR, CAD, and JPY.
**Key Releases:**
1. **CAD CPI Data (08:30 ET)**:
– **CPI MoM (Sep)**: Actual: 0.1%, Forecast: -0.1% (Surprise to the upside)
– **Core CPI YoY (Sep)**: Actual: 2.8%, Forecast: (data not provided)
– This suggests a potential tightening in Canadian inflation, which may bolster CAD strength.
2. **JPY Trade Balance (19:50 ET)**:
– **Adjusted Trade Balance**: Actual: -0.11T, Forecast: (data not provided)
– **Exports YoY**: Actual: 4.6%, Forecast: (data not provided)
– A weaker trade balance could weigh on JPY, especially if export growth does not meet expectations.
3. **Central Bank Speeches**:
– Key speeches from ECB officials (Lagarde, Lane, Nagel) and Fed Waller throughout the day may influence market sentiment and expectations regarding future monetary policy.
**FX Impact:**
Expect volatility in EUR/USD and CAD/USD pairs due to the central bank speeches and inflation data. A stronger CAD could lead to CAD appreciation against USD, while JPY may weaken against major currencies if trade data disappoints. Traders should monitor these developments closely for potential trading opportunities.
💱 Major Currency Pairs
| Name | Symbol | Price | Daily (%) | 5D (%) | 1W (%) | 1M (%) | 3M (%) | 6M (%) | YTD (%) | 12M (%) | MA50 | MA100 | MA200 | RSI | MACD |
|---|---|---|---|---|---|---|---|---|---|---|---|---|---|---|---|
| EUR/USD – Euro / U.S. Dollar | EURUSD | 1.1604 | -0.3692 | -0.3634 | +0.3212 | -1.5865 | -1.1513 | +2.4424 | +11.51 | +6.7661 | 1.1693 | 1.1654 | 1.1253 | 35.92 | -0.0024 |
| USD/JPY – U.S. Dollar / Japanese Yen | USDJPY | 151.90 | +0.7802 | +0.6140 | -0.3497 | +2.6726 | +3.4854 | +6.0591 | -3.2447 | +1.5381 | 148.59 | 147.34 | 148.04 | 62.28 | 0.8505 |
| GBP/USD – British Pound / U.S. Dollar | GBPUSD | 1.3367 | -0.2760 | -0.2795 | +0.2578 | -1.3943 | -1.1430 | +0.7725 | +6.5176 | +2.4086 | 1.3474 | 1.3490 | 1.3194 | 43.20 | -0.0028 |
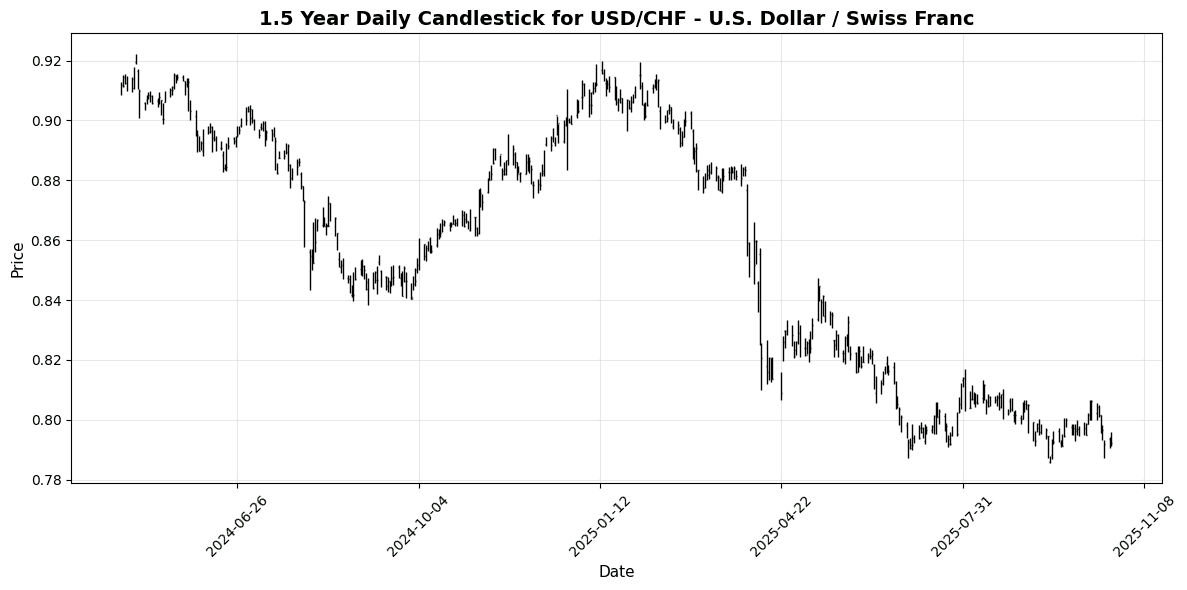
| USD/CHF – U.S. Dollar / Swiss Franc | USDCHF | 0.7962 | +0.4796 | -0.0439 | -1.0059 | +0.4656 | +0.3238 | -4.0492 | -11.85 | -7.9463 | 0.7993 | 0.8024 | 0.8359 | 44.69 | -0.0007 |
| AUD/USD – Australian Dollar / U.S. Dollar | AUDUSD | 0.6490 | -0.4296 | -0.2766 | -0.3317 | -1.9327 | -0.9873 | +1.9592 | +4.3408 | -3.3769 | 0.6554 | 0.6537 | 0.6428 | 28.68 | -0.0023 |
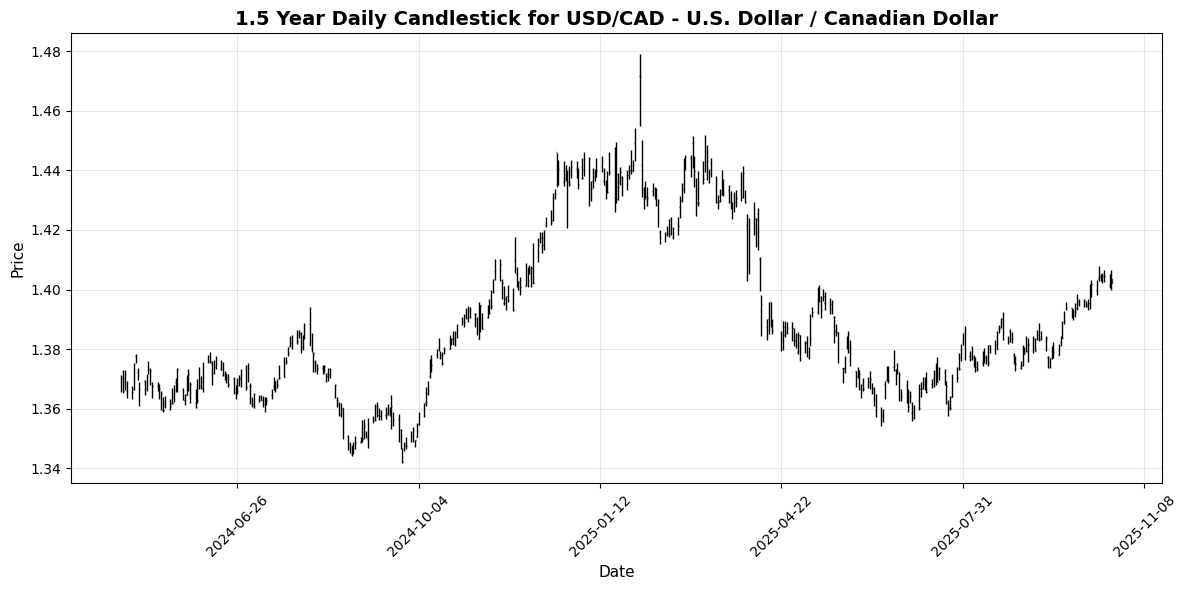
| USD/CAD – U.S. Dollar / Canadian Dollar | USDCAD | 1.4024 | -0.0214 | -0.1566 | -0.1068 | +1.6836 | +3.0851 | +1.0804 | -2.2704 | +1.6261 | 1.3872 | 1.3781 | 1.3971 | 70.95 | 0.0053 |
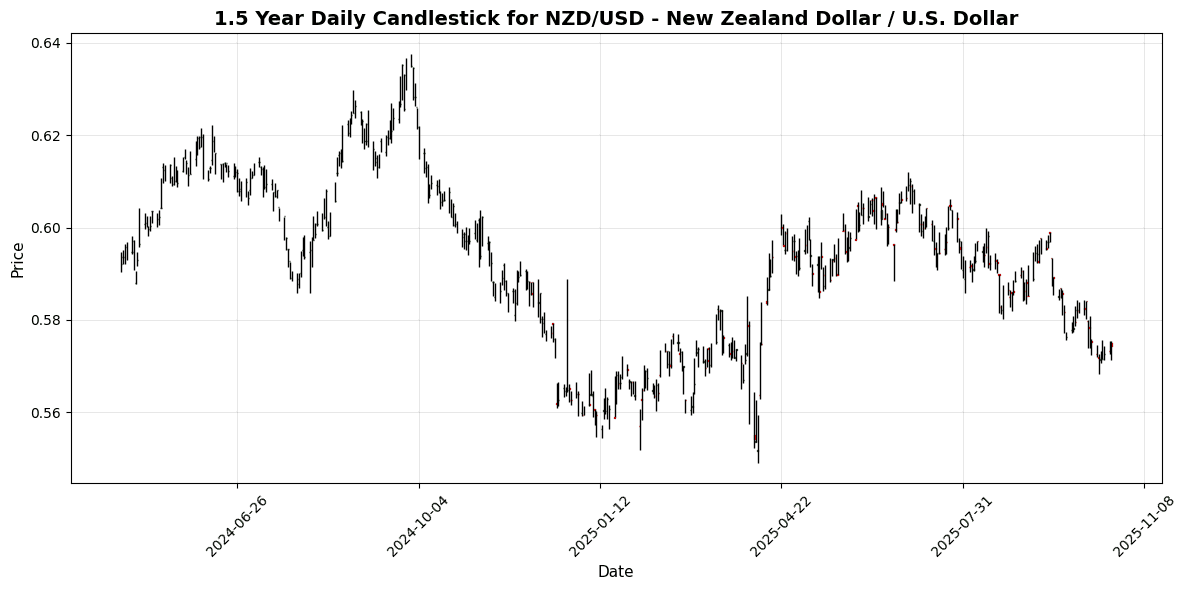
| NZD/USD – New Zealand Dollar / U.S. Dollar | NZDUSD | 0.5743 | -0.0870 | +0.4703 | +0.4462 | -2.5172 | -4.2849 | -3.5182 | +1.8314 | -5.4915 | 0.5853 | 0.5928 | 0.5850 | 36.94 | -0.0041 |
**Overview:**
The Majors FX group is exhibiting mixed signals, with a general bearish undertone. The USD is showing strength against several currencies, particularly against the AUD and GBP, which are in oversold territory.
**Key Pairs:**
1. **USD/CAD**: Currently priced at 1.4024, this pair is nearing overbought conditions with an RSI of 70.95, indicating potential for a price correction. The MACD is positive at 0.0053, suggesting bullish momentum, but caution is warranted as it approaches overbought levels.
2. **EUR/USD**: Priced at 1.1604, this pair is in a bearish phase with an RSI of 35.92, indicating oversold conditions. The negative MACD at -0.0024 reinforces the bearish momentum, suggesting potential for a rebound if support holds.
3. **AUD/USD**: Currently at 0.6490, it is significantly oversold with an RSI of 28.68 and a negative MACD of -0.0023. This pair may see a corrective bounce, but the bearish trend remains intact.
**Trading Implications:**
Key support for EUR/USD lies around 1.1550, while resistance is at
🔀 Cross Currency Pairs
| Name | Symbol | Price | Daily (%) | 5D (%) | 1W (%) | 1M (%) | 3M (%) | 6M (%) | YTD (%) | 12M (%) | MA50 | MA100 | MA200 | RSI | MACD |
|---|---|---|---|---|---|---|---|---|---|---|---|---|---|---|---|
| EUR/GBP | EURGBP | 0.8679 | -0.0806 | -0.1024 | +0.0461 | -0.2012 | -0.0276 | +1.6383 | +4.6684 | +4.2347 | 0.8678 | 0.8639 | 0.8525 | 40.15 | 0.0001 |
| EUR/JPY | EURJPY | 176.22 | +0.4188 | +0.2269 | -0.0528 | +1.0239 | +2.2710 | +8.6310 | +7.8538 | +8.3851 | 173.74 | 171.71 | 166.46 | 60.80 | 0.6865 |
| EUR/CHF | EURCHF | 0.9237 | +0.1301 | -0.4237 | -0.6966 | -1.1292 | -0.8501 | -1.7257 | -1.7236 | -1.7372 | 0.9346 | 0.9350 | 0.9385 | 14.48 | -0.0024 |
| EUR/AUD | EURAUD | 1.7877 | +0.0672 | -0.1017 | +0.6503 | +0.3582 | -0.1765 | +0.4642 | +6.8432 | +10.44 | 1.7840 | 1.7827 | 1.7497 | 56.41 | 0.0026 |
| GBP/JPY | GBPJPY | 203.03 | +0.5014 | +0.3316 | -0.0950 | +1.2381 | +2.2991 | +6.8764 | +3.0619 | +3.9841 | 200.22 | 198.77 | 195.20 | 65.49 | 0.8505 |
| GBP/CHF | GBPCHF | 1.0643 | +0.2071 | -0.3119 | -0.7396 | -0.9235 | -0.8173 | -3.3035 | -6.0926 | -5.7216 | 1.0770 | 1.0824 | 1.1012 | 38.26 | -0.0028 |
| AUD/JPY | AUDJPY | 98.55 | +0.3390 | +0.3145 | -0.7083 | +0.6568 | +2.4418 | +8.1186 | +0.9485 | -1.8769 | 97.38 | 96.31 | 95.13 | 52.21 | 0.2472 |
| AUD/NZD | AUDNZD | 1.1300 | -0.3439 | -0.7413 | -0.7762 | +0.6771 | +3.4455 | +5.6795 | +2.4762 | +2.2767 | 1.1199 | 1.1030 | 1.0989 | 42.41 | 0.0043 |
| CHF/JPY | CHFJPY | 190.77 | +0.3029 | +0.6718 | +0.6659 | +2.1912 | +3.1574 | +10.54 | +9.7660 | +10.31 | 185.89 | 183.63 | 177.37 | 73.75 | 1.2363 |
| NZD/JPY | NZDJPY | 87.20 | +0.6905 | +1.0640 | +0.0700 | +0.0666 | -0.9688 | +2.3078 | -1.4979 | -4.0621 | 86.93 | 87.30 | 86.55 | 57.01 | -0.1123 |
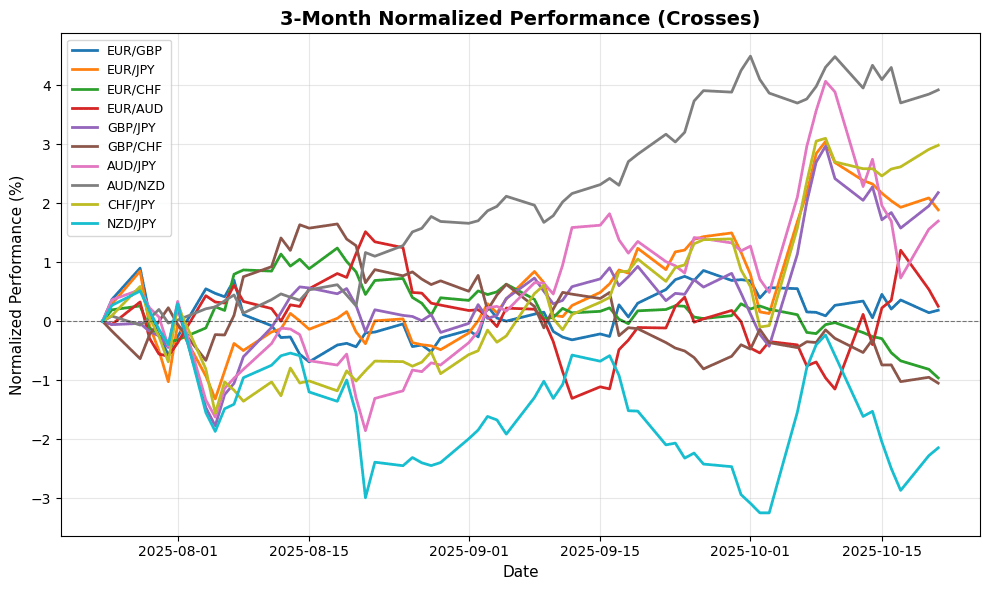
**Overview:** The Crosses FX group exhibits a mixed trend with a slight bullish bias overall. While some pairs show bullish momentum, others indicate bearish conditions, suggesting a cautious trading environment.
**Key Pairs:**
1. **CHF/JPY**: Price at 190.7690, RSI at 73.75 (overbought), and MACD at 1.2363 indicate strong bullish momentum. Watch for potential pullbacks as it approaches overbought territory.
2. **GBP/JPY**: Price at 203.0310, RSI at 65.49 (neutral-bullish), and MACD at 0.8505 suggest continued upward momentum, but monitor for signs of exhaustion.
3. **EUR/CHF**: Price at 0.9237, RSI at 14.48 (oversold), and MACD at -0.0024 indicate bearish pressure. A potential reversal may be imminent if it finds support.
**Trading Implications:** Key resistance for CHF/JPY is at
🌍 Exotic and Emerging Market Currencies
| Name | Symbol | Price | Daily (%) | 5D (%) | 1W (%) | 1M (%) | 3M (%) | 6M (%) | YTD (%) | 12M (%) | MA50 | MA100 | MA200 | RSI | MACD |
|---|---|---|---|---|---|---|---|---|---|---|---|---|---|---|---|
| USD/TRY – U.S. Dollar / Turkish Lira | USDTRY | 41.96 | +0.0880 | +0.2609 | +0.3542 | +1.3605 | +3.7750 | +9.5983 | +18.85 | +22.42 | 41.36 | 40.69 | 39.00 | 97.44 | 0.1713 |
| USD/ZAR – U.S. Dollar / South African Rand | USDZAR | 17.38 | +0.8880 | +0.2127 | +0.3560 | +0.2403 | -0.9623 | -6.8459 | -7.3696 | -1.1218 | 17.44 | 17.61 | 18.01 | 56.24 | -0.0211 |
| USD/THB – U.S. Dollar / Thai Baht | USDTHB | 32.80 | +0.8920 | +0.8300 | +0.6444 | +2.8536 | +1.9267 | -2.2355 | -3.9222 | -0.8764 | 32.27 | 32.38 | 33.01 | 64.91 | 0.1494 |
| USD/SEK – U.S. Dollar / Swedish Krona | USDSEK | 9.4229 | +0.0754 | -0.4957 | -0.8902 | +0.8474 | -0.9528 | -2.7374 | -14.52 | -10.44 | 9.4401 | 9.5083 | 9.8699 | 49.89 | 0.0091 |
| USD/NOK – U.S. Dollar / Norwegian Krone | USDNOK | 10.05 | +0.1404 | -0.4070 | -0.3104 | +1.8829 | -0.1480 | -4.3827 | -11.24 | -7.9122 | 10.02 | 10.07 | 10.42 | 55.05 | 0.0251 |
| USD/DKK – U.S. Dollar / Danish Krone | USDDKK | 6.4363 | +0.3758 | +0.3683 | -0.2871 | +1.6676 | +1.2135 | -2.3486 | -10.19 | -6.1901 | 6.3841 | 6.4041 | 6.6446 | 61.46 | 0.0121 |
| USD/MXN – U.S. Dollar / Mexican Peso | USDMXN | 18.43 | +0.2104 | -0.1094 | -0.1268 | +0.3850 | -1.1212 | -6.0613 | -10.65 | -7.2157 | 18.52 | 18.67 | 19.39 | 55.39 | -0.0216 |
| USD/PLN – U.S. Dollar / Polish Zloty | USDPLN | 3.6560 | +0.5667 | +0.1427 | -0.7229 | +1.1773 | +0.9693 | -3.3443 | -10.98 | -7.6715 | 3.6385 | 3.6522 | 3.7718 | 50.72 | 0.0037 |
| USD/HUF – U.S. Dollar / Hungarian Forint | USDHUF | 335.25 | +0.3773 | +0.0272 | -0.9663 | +1.7423 | -1.2838 | -6.9773 | -15.13 | -8.9887 | 335.31 | 339.77 | 356.25 | 54.33 | 0.0607 |
| USD/CZK – U.S. Dollar / Czech Koruna | USDCZK | 20.93 | +0.4381 | +0.5138 | -0.3883 | +1.6117 | -0.0902 | -5.1007 | -13.35 | -9.8307 | 20.83 | 21.03 | 22.05 | 60.05 | 0.0266 |
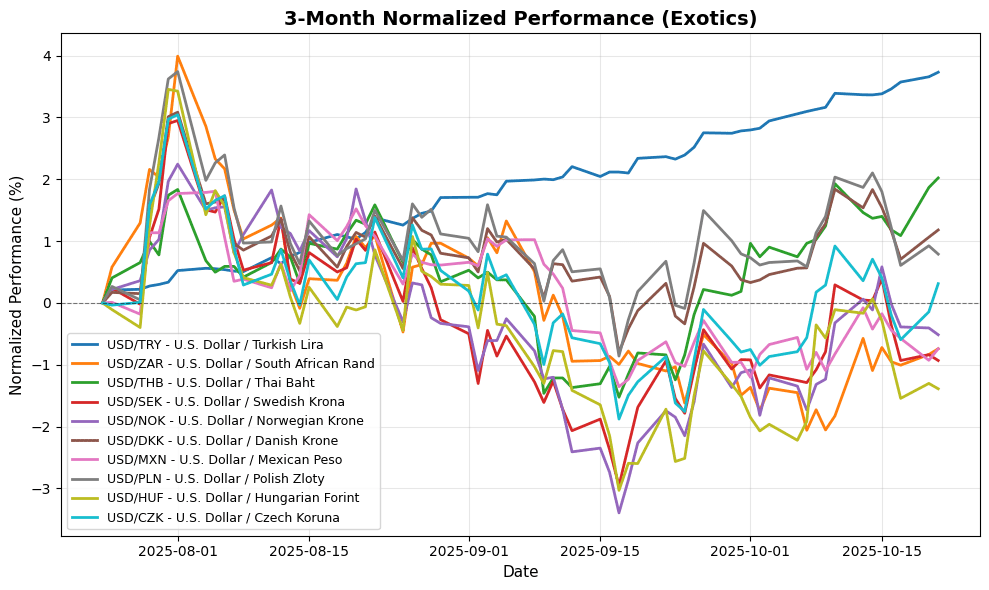
**Overview:** The Exotic FX group is showing mixed signals, with USD/TRY in a strong overbought condition, while other pairs display neutral to slightly bullish momentum.
**Key Pairs:**
1. **USD/TRY:** Currently at 41.9604, the RSI at 97.44 indicates extreme overbought conditions, suggesting a potential price correction. The MACD at 0.1713 supports bullish momentum, but caution is warranted.
2. **USD/ZAR:** Priced at 17.3820, the pair shows an RSI of 56.24, indicating a neutral-bullish stance. However, the MACD at -0.0211 suggests waning momentum, indicating potential bearish shifts.
3. **USD/THB:** At 32.8000, the RSI of 64.91 is approaching overbought territory, while the MACD at 0.1494 indicates sustained bullish momentum.
**Trading Implications:** For USD/TRY, watch for resistance near 42.
Disclaimer
The content on MarketsFN.com is provided for educational and informational purposes only. It does not constitute financial advice, investment recommendations, or trading guidance. All investments involve risks, and past performance does not guarantee future results. You are solely responsible for your investment decisions and should conduct independent research and consult a qualified financial advisor before acting. MarketsFN.com and its authors are not liable for any losses or damages arising from your use of this information.


