GameStop Corp., founded in 1996 by Daniel A. DeMatteo and headquartered in Grapevine, Texas, is a leading retailer specializing in video games and entertainment products. The company operates both physical stores and ecommerce platforms under the GameStop, EB Games, and Micromania brands across the United States, Canada, Australia, and Europe.
Recent news highlights significant movements in the stock market, particularly focusing on GameStop and Oracle. On September 10, 2025, the Dow experienced fluctuations due to unexpected inflation data, while Oracle’s stock soared following strong earnings, largely driven by its AI initiatives. GameStop also captured headlines with a 22% jump in Q2 sales, attributed to its strategic push into collectibles and a notable $528 million boost from Bitcoin investments. This surge in GameStop’s performance is part of a broader trend, as the company has been consistently enhancing its revenue streams through diversification into hardware and collectibles, alongside capitalizing on cryptocurrency trends.
The overall stock market’s reaction to these developments includes a mix of uncertainty due to inflation concerns and positive responses to corporate earnings surpassing expectations. The impact on GameStop’s stock is particularly noteworthy, as it suggests a successful pivot in its business model that could stabilize its financial position and potentially lead to sustained growth. Oracle’s leap in stock value also underscores the growing importance of AI technology in enhancing corporate earnings and investor confidence.
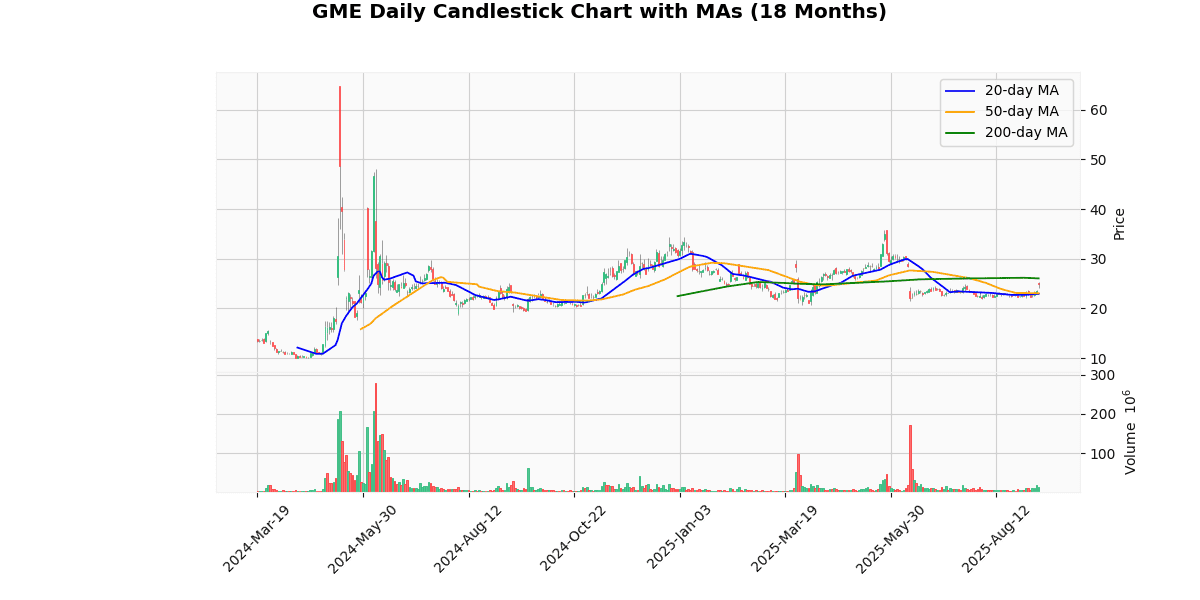
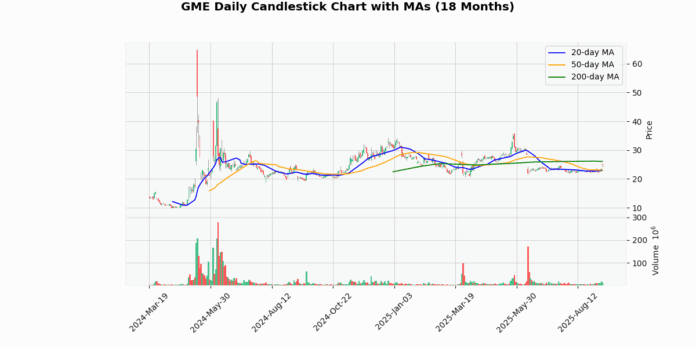
The current price of the asset is $24.84, marking a significant increase of 6.28% today. This recent surge is reflected in its proximity to the week’s high of $25.23, showing a minor gap of -1.55%. The price has rebounded well from the week’s low of $22.56, with a gain of 10.11%.
Looking at broader time frames, the asset is currently 30.63% below the 52-week and year-to-date high of $35.81, yet it has risen 28.64% above the 52-week low of $19.31. This suggests some recovery, although the asset remains well below its peak for the year.
The moving averages indicate mixed signals; the asset is performing well in the short term, up 8.36% and 7.79% above the 20-day and 50-day moving averages, respectively. However, it is still 4.62% below the 200-day moving average, indicating potential long-term bearishness.
The RSI at 65.75 suggests the asset is approaching overbought territory, which might caution against expecting continued short-term gains. The MACD of 0.13, being positive, indicates a bullish momentum in the near term. This combination of indicators suggests that while the asset has positive momentum now, investors should be wary of potential pullbacks as it approaches overbought conditions.
## Price Chart

GameStop Corp. (NYSE: GME) reported a robust financial performance for the second quarter of 2025, with significant year-over-year improvements in several key metrics. For the quarter ending August 2, 2025, GameStop announced net sales of $972.2 million, marking a 21.8% increase from $798.3 million in the same quarter the previous year. The company’s net income saw a substantial rise to $168.6 million, up from $14.8 million in Q2 2024, reflecting a net income margin of 17.3%.
Operating income turned positive at $66.4 million, compared to a loss of $22.0 million in Q2 2024. Adjusted operating income also improved, reaching $64.7 million from a loss of $31.6 million the prior year. The company managed to reduce Selling, General, and Administrative (SG&A) expenses by 19.2% to $218.8 million.
GameStop ended the quarter with $8.7 billion in cash, cash equivalents, and marketable securities, significantly higher than the $4.2 billion reported at the end of Q2 2024. Additionally, the company reported Bitcoin holdings valued at $528.6 million. Basic and diluted earnings per share were $0.38 and $0.31, respectively, both up from $0.04 in Q2 2024. Despite these gains, the company did not declare a quarterly dividend nor did it mention any share repurchase program.
## Earnings Trend Table
| Date | Estimate EPS | Reported EPS | Surprise % | |
|---|---|---|---|---|
| 0 | 2025-09-09 | 0.19 | 0.25 | 31.58 |
| 1 | 2025-06-10 | 0.04 | 0.17 | 325.00 |
| 2 | 2025-03-25 | 0.08 | 0.30 | 275.00 |
| 3 | 2024-12-10 | -0.06 | 0.06 | 194.49 |
| 4 | 2024-09-10 | -0.08 | 0.01 | 111.76 |
| 5 | 2024-06-07 | -0.09 | -0.12 | -33.33 |
| 6 | 2024-03-26 | 0.30 | 0.22 | -25.42 |
| 7 | 2023-09-06 | -0.14 | -0.03 | 78.77 |
Analyzing the EPS trends over the last eight quarters, a notable pattern of volatility and significant positive surprises emerges. Initially, in Q3 2023, the company outperformed expectations significantly, reporting an EPS of -0.03 against an estimate of -0.14, marking a surprise of 78.77%. However, in Q1 2024, the company underperformed with its reported EPS of 0.22 falling short of the expected 0.30, a negative surprise of -25.42%.
The trend shifted dramatically in the subsequent quarters. From Q2 2024 to Q3 2025, the company consistently surpassed analysts’ expectations. Notably, the most substantial positive surprises occurred in Q1 and Q2 2025, with surprise percentages of 275.00% and 325.00%, respectively, where the reported EPS dramatically exceeded the estimates. This trend culminated in Q3 2025, with the company reporting an EPS of 0.25 against an estimate of 0.19, a surprise of 31.58%.
This data indicates a strong recovery and growth phase starting from the latter half of 2024, with the company not only reversing its negative EPS but also consistently exceeding expectations by large margins. This suggests improved operational efficiency, better market conditions, or possibly conservative estimates by analysts. The overall trend points to a robust financial performance in the recent quarters, particularly in 2025.
## Dividend Payments Table
| Date | Dividend |
|---|---|
| 2019-03-14 | 0.095 |
| 2018-12-10 | 0.095 |
| 2018-09-17 | 0.095 |
| 2018-06-11 | 0.095 |
| 2018-03-02 | 0.095 |
| 2017-11-30 | 0.095 |
| 2017-09-07 | 0.095 |
| 2017-06-05 | 0.095 |
The dividend data spanning from June 2017 to March 2019 indicates a consistent dividend payment of $0.095 per share across the eight recorded dates. This stability in dividend payments suggests a steady financial performance and a potentially conservative dividend policy by the company during this period. The lack of variation in the dividend amount could be indicative of the company’s management striving to maintain investor confidence by providing predictable returns, especially if the broader economic or sector-specific conditions were volatile or uncertain during these times. Consistent dividends are often viewed favorably by income-focused investors who prioritize regular income streams. This trend might also reflect the company’s operational stability and a commitment to returning value to shareholders amidst various market conditions. However, the data does not reflect any progressive increase in dividend payouts, which might be a point of consideration for growth-oriented investors.
The four most recent rating changes for Outer reflect a predominantly negative outlook from various financial firms.
1. On June 8, 2023, Wedbush reiterated its “Underperform” rating on Outer, adjusting the target price downward from $6.50 to $6.20. This adjustment suggests a continued bearish outlook on the company’s performance, indicating potential challenges or underperformance relative to the market or sector.
2. Previously, on April 12, 2021, Ascendiant Capital Markets downgraded Outer from “Hold” to “Sell,” with a corresponding target price reduction from $12 to $10. This significant downgrade reflects a shift from a neutral to a negative stance, emphasizing increased concerns over the company’s future financial health or market position.
3. On March 24, 2021, Telsey Advisory Group reiterated its “Underperform” rating but lowered the target price from $33 to $30. This reiteration and price adjustment suggest that while the negative outlook was maintained, there were adjustments to the expected degree of underperformance.
4. On the same day, March 24, 2021, Wedbush downgraded Outer from “Neutral” to “Underperform” and, interestingly, increased the target price from $16 to $29. This unusual combination of a downgrade with a higher price target might indicate a recalibration of expectations based on new market data or company performance metrics, albeit within a negative overall sentiment.
These rating changes collectively indicate a cautious or negative sentiment towards Outer from the investment analysts, with concerns likely centered around operational, competitive, or market challenges impacting the company’s performance.
The current price of the stock stands at $24.84, which shows a varied comparison against the average target prices provided by different analysts. For instance, Wedbush recently reiterated an “Underperform” rating with a target price adjustment from $6.50 to $6.20, indicating a significantly lower expectation compared to the current market price. Ascendiant Capital Markets, in a previous assessment, downgraded the stock from “Hold” to “Sell,” setting their target at $10, which is also well below the current trading price. Conversely, Telsey Advisory Group’s last input from 2021 placed a target price at $30 after a downgrade, which is closer but still below the current price. The mixed signals from these analysts suggest a cautious or negative outlook overall, with the majority of the target prices being below the current market price, pointing towards potential overvaluation concerns as per these analysts’ views.


