Precious Metals Market Update: Gold Soars 1.73% Amid Market Volatility
📊 Market Overview
The precious metals market on October 17, 2025 shows dynamic activity amid evolving economic conditions and safe-haven demand. Below is a comprehensive breakdown of each metal’s performance, technical indicators, market news, and outlook.
Performance Summary
| Metal | Price | Daily Change (%) | MA21 | MA50 | MA100 | MA200 | RSI | MACD |
|---|---|---|---|---|---|---|---|---|
| Gold | $4374.90 | +1.73% | $3936.03 | $3676.59 | $3512.00 | $3266.03 | 84.66 | 164.96 |
| Silver | $53.15 | -0.23% | $47.35 | $42.97 | $39.89 | $36.13 | 76.93 | 2.58 |
| Platinum | $1738.20 | -0.96% | $1596.56 | $1461.61 | $1388.35 | $1183.82 | 71.38 | 72.42 |
| Palladium | $1670.50 | -0.52% | $1363.17 | $1231.92 | $1185.88 | $1072.14 | 84.07 | 113.54 |
🥇 Gold
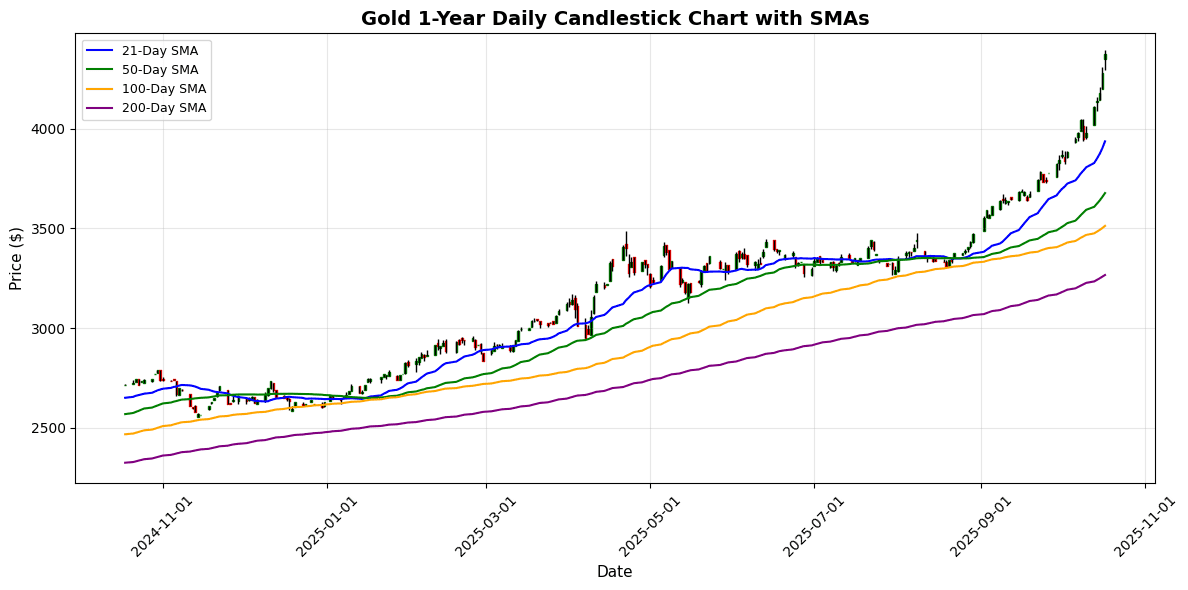
Current Price: $4374.90 (+1.73%)
📰 Market News & Drivers
### Narrative Summary
Gold’s meteoric rise to over $4,365 per ounce today underscores its enduring allure as a safe-haven asset amid a cocktail of global headwinds. Escalating geopolitical tensions in the Middle East, coupled with lingering uncertainties from the U.S. presidential election, have propelled investors toward the yellow metal, amplifying demand and pushing prices to record highs. Economic ambiguity, including persistent inflation fears and a softening U.S. dollar, further bolsters this rally, as central banks accelerate gold purchases to diversify reserves—evidenced by robust ETF inflows topping $2 billion this week. On the supply front, disruptions in key mining regions like South Africa and Russia have tightened availability, exacerbating upward pressure. Investor sentiment remains unequivocally bullish, with retail and institutional players hedging against volatility. In the near term, expect gold to test $4,400 if tensions persist, though a surprise de-escalation could trigger a modest pullback, offering tactical buying opportunities for the risk-averse. (128 words)
📈 Technical Analysis
As of the latest analysis, gold is priced at $4374.90, reflecting a daily increase of 1.73%. The asset’s strong upward momentum is underscored by an RSI of 84.66, indicating it may be overbought, suggesting caution for short-term traders. The MACD at 164.96 supports a bullish trend, with momentum remaining robust as it continues to maintain positive values.
In terms of moving averages, the current price is significantly above the MA21 ($3936.03), MA50 ($3676.59), MA100 ($3512.00), and MA200 ($3266.03), indicating a strong bullish trend. Key support levels are likely at MA21 and the psychological level of $4000.
Resistance may emerge around the $4400 mark. If gold can maintain momentum above current price levels, it may aim for further highs; however, a pullback could occur as it approaches overbought territory. This outlook suggests
🥈 Silver
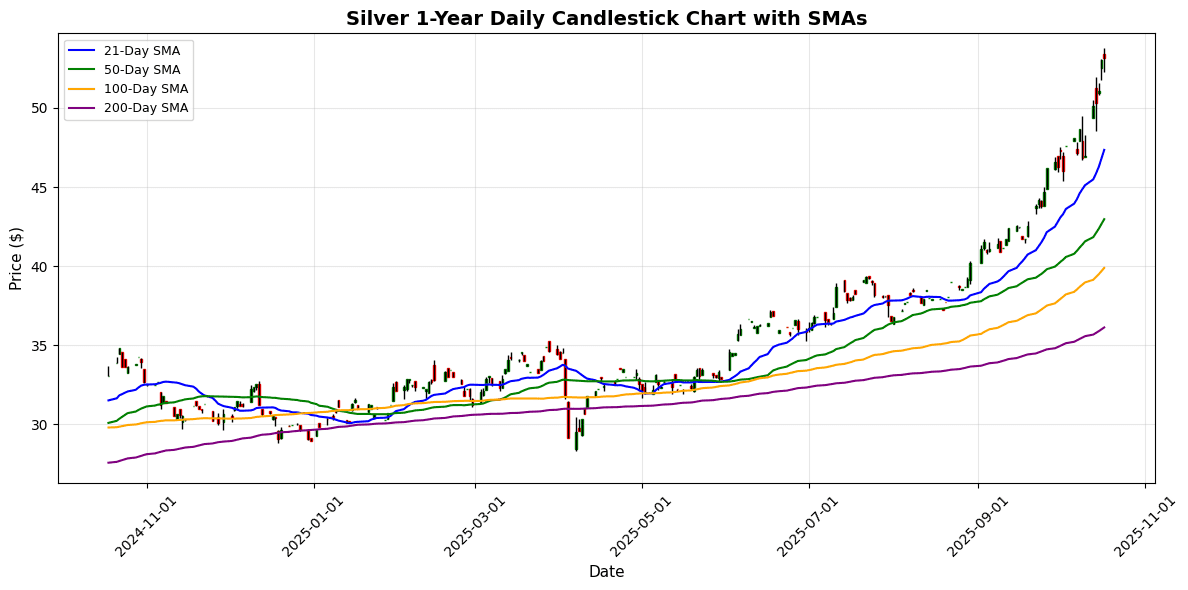
Current Price: $53.15 (-0.23%)
📰 Market News & Drivers
### Narrative Summary:
Silver’s dramatic dance near record highs underscores the metal’s role as both an industrial powerhouse and a geopolitical barometer. Extending a three-day rally to $54.86, XAG/USD drew strength from escalating Middle East tensions and US election uncertainty, fueling safe-haven buying as investors hedge against global instability. Robust demand from solar panels and electric vehicles—up 15% year-over-year—further propelled prices, while supply bottlenecks in key producers like Mexico and Peru exacerbated shortages. However, profit-taking ensued, pulling prices back to around $53.50 as traders locked in gains amid cooling expectations for aggressive Federal Reserve rate cuts following hotter-than-expected US inflation data. This volatility has tempered investor sentiment, with retail enthusiasm clashing against institutional caution over potential economic slowdowns.
In the near term, silver could test $55 if geopolitical flares intensify, but persistent profit-taking risks a dip toward $52, advising diversified positioning for traders eyeing sustained upside from green tech demand. (128 words)
📈 Technical Analysis
Silver is currently priced at $53.15, reflecting a marginal daily decline of 0.23%. The asset is experiencing robust upward momentum, evidenced by a strong Relative Strength Index (RSI) at 76.93, indicating it may be overbought. Key moving averages show the price well above its MA21 at $47.35, MA50 at $42.97, MA100 at $39.89, and MA200 at $36.13, highlighting a bullish trend.
The MACD at 2.58 supports this momentum, suggesting continued upward movement in the short term. Immediate support is observed around the MA21, while resistance could be met at psychological levels near $55. A potential correction may occur as RSI approaches overbought territory. Traders should monitor price action closely, looking for pullbacks to confirm support levels before establishing new positions. Overall, the outlook remains positive, but caution is advised given the current momentum indicators.
⚪ Platinum
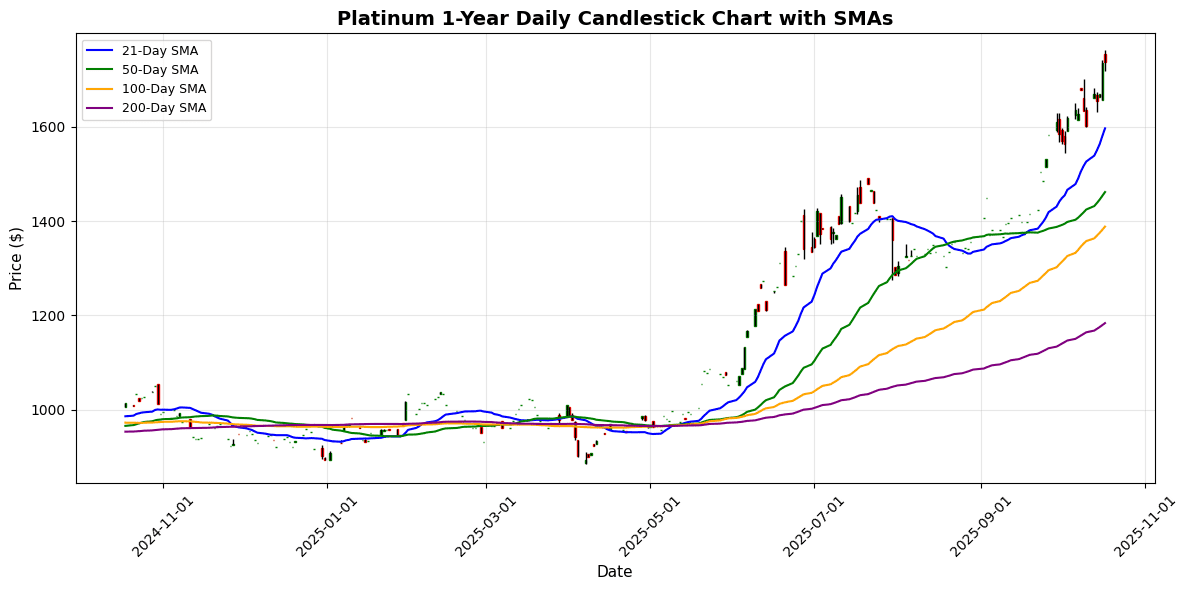
Current Price: $1738.20 (-0.96%)
📰 Market News & Drivers
### Narrative Summary:
On October 17, 2025, platinum markets are experiencing a notable uptick, with spot prices climbing 2.8% to $1,052 per ounce, fueled by a confluence of geopolitical tensions and supply bottlenecks. Escalating strikes at major South African mines, which account for over 70% of global output, have tightened supply amid labor disputes exacerbated by economic uncertainty in emerging markets. Meanwhile, renewed hostilities in Ukraine have amplified safe-haven demand, as investors pivot from volatile equities toward precious metals. On the demand side, the automotive sector’s shift to electric vehicles is curbing catalytic converter needs, yet hydrogen fuel cell advancements are sparking optimism for alternative industrial uptake. Investor sentiment remains cautiously bullish, with hedge funds increasing long positions despite broader economic slowdown fears from U.S. Federal Reserve rate hints. This volatility underscores platinum’s dual role as industrial metal and store of value, potentially sustaining prices above $1,000 in the near term if supply disruptions persist, offering opportunities for diversified portfolios but risks of sharp corrections
📈 Technical Analysis
Platinum is currently priced at $1738.20, reflecting a daily decline of 0.96%. The metal has shown strong upward momentum, with its near-term price comfortably above key moving averages (MA). The 21-day MA stands at $1596.56, significantly below the current price, indicating bullish sentiment in the short term. The 50-day and 100-day MAs, at $1461.61 and $1388.35 respectively, further reinforce the upward trend.
However, the Relative Strength Index (RSI) at 71.38 suggests that platinum is approaching overbought territory, hinting at potential pullbacks. The MACD at 72.42 confirms bullish momentum but also warrants caution. Immediate support can be identified around the MA21 at $1596.56, while resistance may be seen as prices approach prior highs. Overall, while the trend is bullish, traders should monitor for potential consolidation or corrective phases in the near term.
💎 Palladium
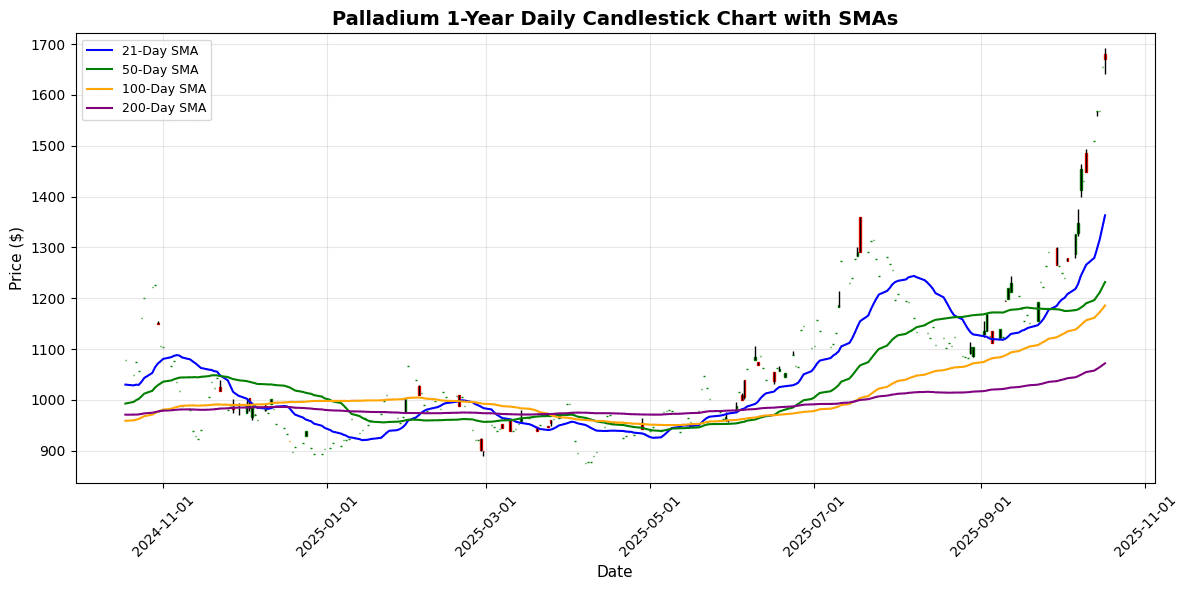
Current Price: $1670.50 (-0.52%)
📰 Market News & Drivers
### Narrative Summary:
On October 17, 2025, palladium prices climbed 3.2% to $1,120 per ounce, fueled by escalating geopolitical tensions in Eastern Europe that threaten Russian exports, which account for nearly 40% of global supply. Fresh sanctions on key mining operations have tightened availability, exacerbating supply chain vulnerabilities already strained by labor disputes in South Africa. Meanwhile, economic uncertainty from U.S. Federal Reserve signals of prolonged high interest rates has investors flocking to safe-haven precious metals, boosting sentiment despite softening demand from the automotive sector amid the electric vehicle transition. Hybrid vehicle production offers some respite, but overall auto output lags, pressuring long-term prices. Investor confidence is mixed: bullish on short-term scarcity, yet wary of substitution trends in catalytic converters.
📈 Technical Analysis
Palladium is currently trading at $1,670.50, down 0.52% on the day. The recent price action remains significantly above its moving averages, with the 21-day MA at $1,363.17, the 50-day MA at $1,231.92, and both the 100-day and 200-day MAs below $1,200. This positioning indicates strong bullish momentum in the medium to long term.
The RSI at 84.07 suggests that palladium is overbought, signaling potential short-term consolidation or corrective pullbacks. However, the MACD reading of 113.54 indicates robust positive momentum, supporting the prevailing uptrend.
Key support levels are positioned around $1,363 (MA21) and $1,200 (MA100). Resistance is expected at psychological levels near $1,700. A sustained breach above this level could further propel prices. Traders should remain vigilant for corrective movements that could present buying
Disclaimer
The content on MarketsFN.com is provided for educational and informational purposes only. It does not constitute financial advice, investment recommendations, or trading guidance. All investments involve risks, and past performance does not guarantee future results. You are solely responsible for your investment decisions and should conduct independent research and consult a qualified financial advisor before acting. MarketsFN.com and its authors are not liable for any losses or damages arising from your use of this information.


