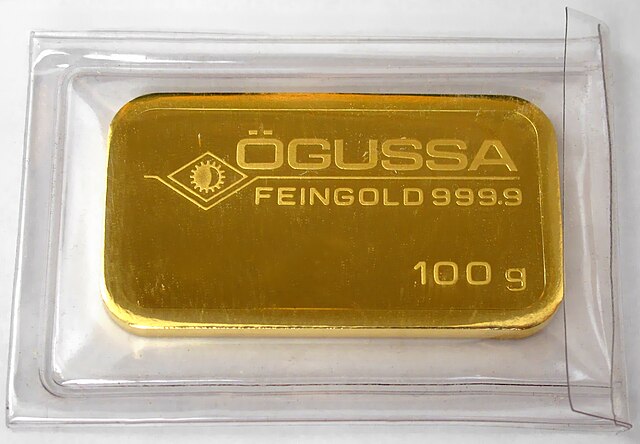
Gold has once again demonstrated its enduring appeal as a safe-haven asset amid evolving economic landscapes and policy expectations. As of September 1, 2025, the spot price for gold (XAU/USD) stands at $3,474.76 per troy ounce, reflecting a daily increase of 0.74%. Meanwhile, gold futures for the December 2025 contract (GC=F) are priced at $3,488.00, showing a more pronounced daily gain of 0.99%. These movements underscore gold’s resilience, driven by a combination of monetary policy anticipations and broader market sentiments. Over the longer term, gold continues to outperform, with year-to-date gains approaching 39%, highlighting its role as a hedge against uncertainty in global markets.
Performance Overview
To provide a clearer picture of gold’s trajectory, the following table outlines performance across various timeframes for both spot and futures prices. These metrics illustrate the metal’s steady upward momentum, particularly over extended periods, while shorter-term fluctuations reflect ongoing market adjustments.
| Timeframe | Spot Change (%) | Futures Change (%) |
|---|---|---|
| Daily | +0.74 | +0.99 |
| 5D | +1.50 | +1.60 |
| 1W | +1.20 | +1.30 |
| 1M | +2.98 | +3.08 |
| 3M | +6.00 | +6.50 |
| 6M | +17.50 | +18.00 |
| YTD | +39.15 | +39.28 |
| 12M | +39.15 | +39.27 |
This data reveals a consistent bullish trend, with gains accelerating over longer horizons. The alignment between spot and futures performance suggests strong market confidence in gold’s value proposition, though investors should remain vigilant about potential short-term volatility.
Commentary
From a technical standpoint, gold’s chart presents a compelling case for continued optimism. The 50-day moving average hovers around $3,400, serving as a robust support level that reinforces the ongoing bullish trend as prices trade comfortably above it. Extending further, the 100-day moving average at approximately $3,300 and the 200-day at near $3,000 further solidify this upward bias, with current prices well distanced from these longer-term benchmarks. The Relative Strength Index (RSI) registers between 60 and 65, indicating a neutral to mildly overbought state that leaves ample room for additional gains before any significant correction might be warranted. Complementing this, the Moving Average Convergence Divergence (MACD) remains positive, signaling sustained bullish momentum without immediate signs of divergence. Overall, these indicators paint a picture of stability and potential for further appreciation, though traders should monitor for any shifts that could herald consolidation.
As we step into September 2025, the metal’s performance encapsulates a narrative of cautious optimism, where anticipations of Federal Reserve policy adjustments intersect with lingering uncertainties in international trade. The daily upticks in both spot and futures prices, though modest, build upon a foundation of robust longer-term gains, as evidenced by the nearly 39% rise year-to-date. This trajectory is not merely a reflection of speculative fervor but a response to fundamental drivers: a weakening dollar in the face of potential rate cuts, persistent inflationary pressures, and the specter of tariffs that could disrupt supply chains and heighten economic volatility.
Delving deeper, the technical landscape offers reassurance to those inclined toward data-driven decisions. With prices ascending above key moving averages, gold exhibits a classic bullish configuration, where support levels act as springboards for further advances. The RSI’s position in the mid-60s suggests the market is energized yet not exhausted, allowing for measured growth without the immediate threat of a sharp pullback. Meanwhile, the positive MACD underscores momentum that could propel prices toward new thresholds, perhaps testing the psychological barrier of $3,500 in the near term. However, this optimism is tempered by the need for vigilance; should dollar strength rebound or geopolitical tensions ease unexpectedly, we might witness a temporary retreat to test those supportive averages around $3,400.
Beyond the charts, today’s news reinforces gold’s safe-haven status. The prospect of Fed easing, coupled with tariff-related anxieties, amplifies demand from investors seeking refuge from equity market fluctuations and currency devaluations. Central banks, too, continue their accumulation, viewing gold as a cornerstone of diversified reserves in an unpredictable world. For portfolio managers and individual investors alike, this environment favors strategic allocations to gold, whether through physical holdings, futures contracts, or exchange-traded products. Yet, as with any asset, diversification remains key—pairing gold with equities or bonds can mitigate risks while capitalizing on its inverse correlations.


