H.B. Fuller Co. is a prominent manufacturer and marketer of adhesives, sealants, and other chemical products, founded in 1887 by Harvey Benjamin Fuller. Based in St. Paul, MN, the company operates through three main business segments: Hygiene, Health, and Consumable Adhesives; Engineering Adhesives; and Construction Adhesives, serving diverse markets from construction to electronics and hygiene.
H.B. Fuller (FUL) recently reported its Q3 2025 earnings, surpassing both earnings and revenue estimates, which could positively impact the stock. The company’s performance was detailed in multiple reports, highlighting its financial health and potential investor gains. Zacks published articles emphasizing that H.B. Fuller beat Q3 expectations, and a detailed analysis of key metrics was also provided, suggesting a robust financial standing. Additionally, Business Wire shared a direct report on the company’s third-quarter results, which could reassure investors about the company’s operational strength.
Other news on the same day discussed broader market conditions, including a general rise in the Dow, S&P 500, and Nasdaq, despite recent tech stock volatility and concerns over AI spending. This broader market context, combined with H.B. Fuller’s strong quarterly performance, could foster increased investor confidence in FUL, potentially leading to stock gains in a volatile market environment.
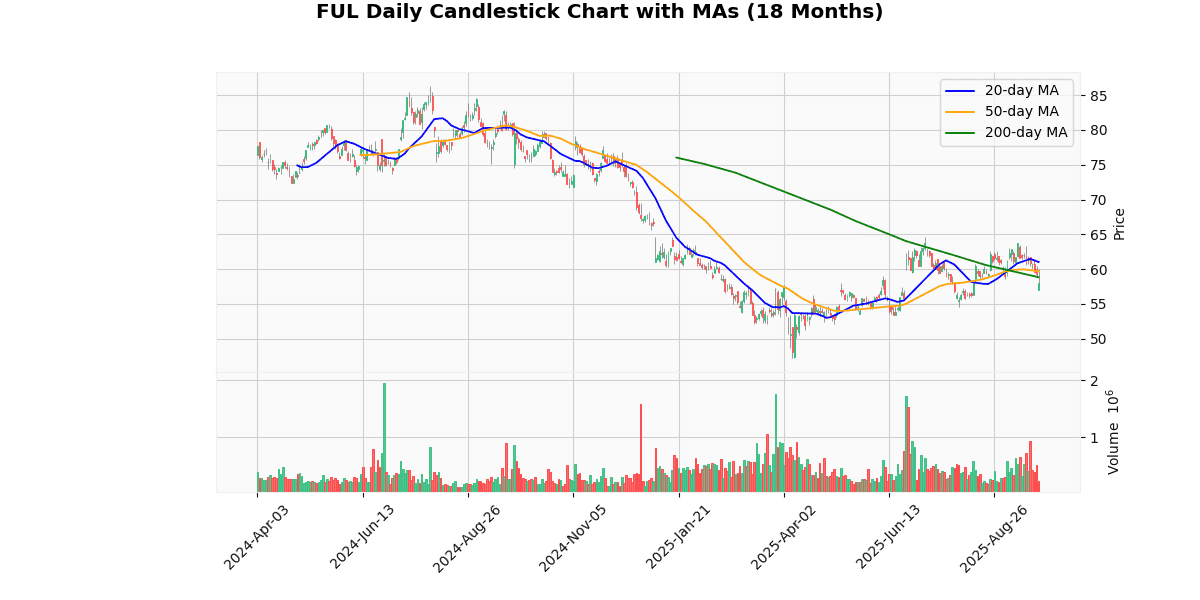
The current price of the asset is $58.05, which marks a significant drop of 2.16% today. This price is notably lower than the 52-week high of $81.19, reflecting a 28.5% decrease, and also below the year-to-date (YTD) high of $64.67 by 10.24%. However, it has risen 23.09% above the 52-week and YTD lows of $47.16, indicating some recovery within the year.
The asset’s price is currently trending below all key moving averages (MA20, MA50, MA200), with respective percentage differences of -4.86%, -2.72%, and -1.32%. This suggests a bearish trend in the short, medium, and long term.
The Relative Strength Index (RSI) at 39.82 indicates that the asset is nearing oversold territory, which might suggest a potential for price stabilization or a slight reversal if buying interest increases. However, the Moving Average Convergence Divergence (MACD) at -0.11 points to ongoing bearish momentum, as it is negative.
Overall, the asset is currently facing downward pressure with bearish signals from both price trends and technical indicators, suggesting cautiousness among investors.
## Price Chart

H.B. Fuller Company (NYSE: FUL) reported its Q2 2025 financial results on June 25, 2025. The company saw a net revenue of $898 million, marking a 2.1% decrease from Q2 2024, though adjusted for the flooring divestiture, revenue increased by 2.8%. The adjusted gross profit margin improved by 110 basis points to 32.2%. Net income stood at $42 million, with a reported diluted EPS of $0.76 and an adjusted diluted EPS of $1.18, reflecting a 5% year-on-year increase.
Adjusted EBITDA rose by 5% to $166 million, with a margin expansion of 130 basis points to 18.4%. Operating cash flow also increased, reaching $111 million. The company repurchased approximately one million shares year-to-date. Despite a slight decline in volume, pricing adjustments contributed a 0.7% increase in organic revenue growth.
For fiscal 2025, H.B. Fuller anticipates a net revenue decline of 2% to 3%, with organic revenue expected to be flat to up 2%. Adjusted EBITDA guidance has been revised to $615 million to $630 million, indicating a 4% to 6% growth. Adjusted EPS is forecasted to be between $4.10 and $4.30, representing a 7% to 12% increase from the previous year. Further insights will be shared in a conference call scheduled for June 26, 2025.
## Earnings Trend Table
| Date | Estimate EPS | Reported EPS | Surprise % | |
|---|---|---|---|---|
| 0 | 2025-09-24 | 1.24 | 1.26 | 1.61 |
| 1 | 2025-06-25 | 1.08 | 1.18 | 9.46 |
| 2 | 2025-03-26 | 0.49 | 0.54 | 9.27 |
| 3 | 2025-01-15 | 1.00 | 0.92 | -7.71 |
| 4 | 2024-09-25 | 1.23 | 1.13 | -7.92 |
| 5 | 2024-06-26 | 1.03 | 1.12 | 8.79 |
| 6 | 2024-03-27 | 0.64 | 0.67 | 5.13 |
| 7 | 2024-01-17 | 1.27 | 1.32 | 3.75 |
Over the last eight quarters, the company has shown a mixed yet generally positive trend in its earnings per share (EPS) performance relative to estimates. The data reveals that in five out of eight quarters, the company exceeded analyst estimates, which suggests a trend of robust earnings management and potential operational efficiency.
Notably, the company reported higher than expected EPS in the most recent quarter (2025-09-24) with a surprise of 1.61%, and significantly higher surprises in Q2 and Q1 of 2025 at 9.46% and 9.27%, respectively. This indicates a strong upward momentum in earnings performance as the year progressed. However, there were two quarters (Q4 2025 and Q3 2024) where the company underperformed relative to expectations, with negative surprise percentages of -7.71% and -7.92%, respectively. These declines could be indicative of seasonal fluctuations or specific operational challenges faced during those periods.
The overall EPS trend suggests variability but with a lean towards positive surprises, which could be appealing to investors looking for companies with a track record of exceeding expectations. The ability of the company to bounce back from underperforming quarters and register strong positive surprises subsequently is also noteworthy, reflecting potential resilience in its business model or operational adjustments.
## Dividend Payments Table
| Date | Dividend |
|---|---|
| 2025-07-31 | 0.235 |
| 2025-04-29 | 0.235 |
| 2025-02-06 | 0.223 |
| 2024-10-17 | 0.223 |
| 2024-07-31 | 0.223 |
| 2024-04-24 | 0.223 |
| 2024-02-06 | 0.205 |
| 2023-10-18 | 0.205 |
The dividend payout data over the last eight recorded periods shows a gradual increase, reflecting a positive trend in the company’s dividend policy. Initially, the dividend was held steady at $0.205, as observed in the payments dated October 18, 2023, and February 6, 2024. This consistency indicates a stable phase in the company’s financial management during that period.
Subsequently, there was an increase to $0.223, first seen in the dividend declared on April 24, 2024. This increased rate was maintained consistently through the dividends paid on July 31, 2024, October 17, 2024, and February 6, 2025. The consistency in this elevated dividend suggests a sustained improvement in the company’s distributable profits or a strategic decision to enhance shareholder returns.
The latest data points, from April 29, 2025, and July 31, 2025, show a further increment to $0.235. This progression underscores a continued positive trajectory in the company’s profitability and a commitment to returning value to shareholders. Overall, the trend over these periods clearly demonstrates a robust and improving dividend policy.
In the recent sequence of rating adjustments for Outer, there have been notable shifts by prominent financial research firms.
1. **Robert W. Baird Upgrade (April 17, 2025)**: Robert W. Baird upgraded Outer from ‘Neutral’ to ‘Outperform’ with a target price set at $60. This upgrade suggests a positive shift in Baird’s perspective on Outer’s operational performance or market position, indicating anticipated outperformance relative to the market or its sector peers.
2. **Seaport Research Partners Downgrade (March 5, 2025)**: Seaport Research Partners downgraded their rating on Outer from ‘Buy’ to ‘Neutral’. This change implies that while Outer might still hold solid fundamentals, its prospects for outsize returns or significant growth compared to earlier evaluations might have tempered, leading to a more conservative investment stance.
3. **Vertical Research Downgrade (January 6, 2025)**: Shortly after initiating coverage, Vertical Research downgraded Outer from ‘Buy’ to ‘Hold’. This adjustment reflects a reevaluation of earlier positive sentiments, possibly due to emerging market conditions, operational challenges, or financial results that do not align with the growth expectations previously set.
4. **Vertical Research Initiation (March 19, 2024)**: Initially, Vertical Research had a positive outlook on Outer, initiating coverage with a ‘Buy’ rating and a target price of $88. This high target price suggests strong confidence in Outer’s growth trajectory and market performance potential at the time of initiation.
These changes collectively reflect a dynamic and evolving view of Outer’s market position and financial health, influenced by ongoing assessments of the company’s performance metrics, market conditions, and potentially, broader economic factors.
As of the latest data, the current price of the stock stands at $58.05. Recent analyst ratings show a mixed sentiment, with the most recent update from Robert W. Baird on April 17, 2025, upgrading the stock from Neutral to Outperform with a target price of $60. This suggests a modest upside potential of approximately 3.35% from the current price. Earlier in the year, both Seaport Research Partners and Vertical Research downgraded their outlooks, indicating a shift in expectations possibly due to changing market conditions or company performance metrics.
Unfortunately, the data provided does not include specific details on Earnings Per Share (EPS) trends or dividend policies, which are critical in assessing the overall financial health and shareholder return aspects of the company. For a comprehensive investment decision, these financial metrics, along with the broader industry and economic context, should be considered alongside the analyst ratings and target prices.
Disclaimer: The information provided here is for educational and informational purposes only and should not be interpreted as financial advice, investment recommendations, or trading guidance. Markets involve risk, and past performance is not indicative of future results. You should always conduct your own research and consult with a qualified financial advisor before making any investment decisions. By acting, you accept full responsibility for your choices.


