Independent Bank Corp. (INDB) Post Earning Analysis
Independent Bank Corp., founded in 1985 and headquartered in Rockland, MA, operates as a bank holding company. It offers a comprehensive range of services including commercial and retail banking, as well as wealth management. The company specializes in real estate loans, including commercial and residential mortgages, and also provides a variety of deposit products and financial services like retail investments and insurance products in Massachusetts.
Recent reports indicate that Independent Bank Corp. (INDB) performed well in the third quarter of 2025, surpassing analysts’ earnings and revenue expectations. According to Zacks, both the Q3 earnings and revenues exceeded estimates, which could suggest a positive outlook for the bank’s stock. Detailed metrics provided by Zacks further elaborate that the company’s financial performance was robust, aligning with or surpassing projected figures. Business Wire reported that Independent Bank Corp. achieved a net income of $34.3 million for the quarter.
The news coverage consistently highlights the company’s financial health, pointing to a potentially favorable impact on INDB’s stock price. The consistent achievement or surpassing of financial estimates, particularly in a challenging economic environment, could reassure investors of the bank’s stability and operational efficiency. This sequence of positive financial disclosures is likely to bolster investor confidence and could lead to an uptick in stock market performance for INDB in the near term.
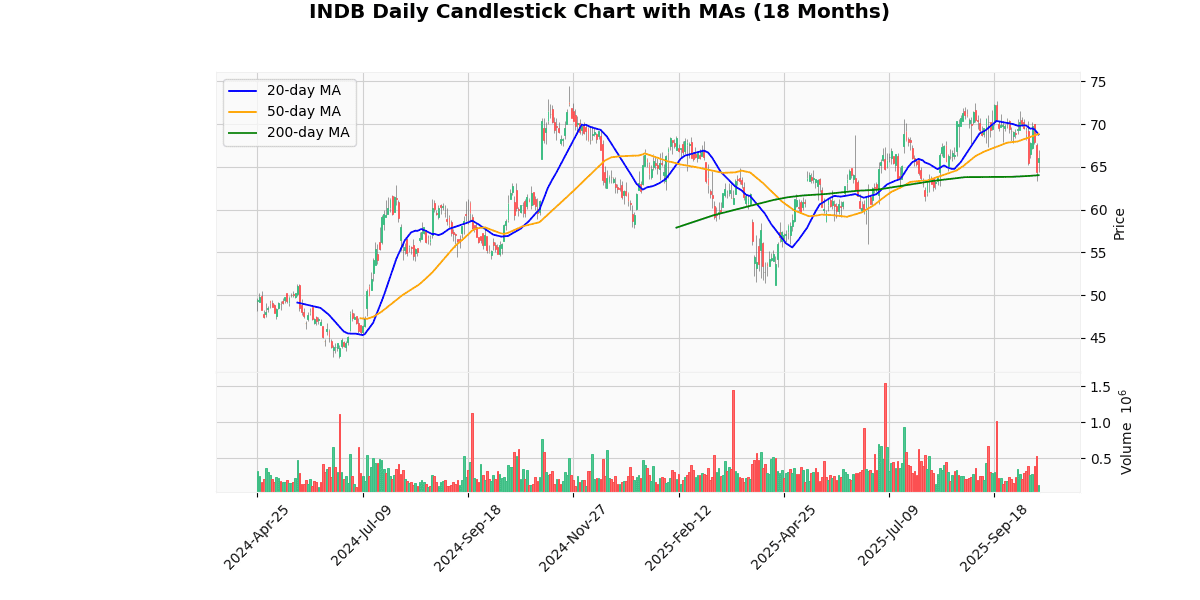
The current price of $66.055 reflects a notable increase of 2.52% for the day, indicating a positive short-term momentum. Despite this rise, the asset is trading below its 20-day and 50-day moving averages by approximately 4%, suggesting a bearish trend in the medium term. However, it remains above the 200-day moving average by around 3.15%, indicating some resilience in a longer-term perspective.
The asset’s price is significantly down from its 52-week high by 11.35% and from the year-to-date high by 9.2%, but has rebounded 28.91% from both the 52-week and year-to-date lows. This recovery highlights a substantial improvement from the lowest levels this year.
The Relative Strength Index (RSI) at 42.71 suggests the asset is neither overbought nor oversold, leaning slightly towards a bearish sentiment. The negative MACD value of -0.7 further supports the view of bearish momentum in recent times. The proximity to the week’s low price, with only a 4.3% increase, combined with the other indicators, suggests cautious optimism, as the asset shows some signs of recovery but still faces downward pressures.
Price Chart

Independent Bank Corp. (INDB) reported its third-quarter financial results for 2025, noting a net income of $34.3 million, or $0.69 per diluted share, a significant decrease from $51.1 million, or $1.20 per diluted share, in the previous quarter. This marks a 32.08% decline in earnings per share. However, the operating net income showed a robust increase, reaching $77.4 million, or $1.55 per diluted share, up 44.71% from Q2 2025.
The quarter was notable for the completion of the acquisition of Enterprise Bancorp on July 1, 2025, which expanded the company’s portfolio by adding 27 branch locations, $3.9 billion in loans, and $4.4 billion in deposits. This contributed to a substantial growth in total assets, loans, and deposits by 24.7%, 27.0%, and 27.7% respectively.
Despite these gains, the bank faced increased merger-related costs of $23.9 million and a higher noninterest expense, which surged by 47.8% due to rises in salaries and employee benefits. The bank’s return on average assets and common equity declined to 0.55% and 3.82%, respectively. The net interest margin improved slightly by 25 basis points to 3.62%.
Overall, while INDB experienced significant growth in operational metrics, the costs associated with expansion and increased expenses impacted profitability metrics negatively.
Earnings Trend Table
| Date | Estimate EPS | Reported EPS | Surprise % | |
|---|---|---|---|---|
| 0 | 2025-10-16 | 1.54 | 1.55 | 0.65 |
| 1 | 2025-04-17 | 1.16 | 1.06 | -8.23 |
| 2 | 2025-01-16 | 1.16 | 1.21 | 4.09 |
| 3 | 2024-10-17 | 1.06 | 1.01 | -4.27 |
| 4 | 2024-07-18 | 1.12 | 1.21 | 8.52 |
| 5 | 2024-04-18 | 1.15 | 1.12 | -2.61 |
| 6 | 2024-01-18 | 1.24 | 1.26 | 1.41 |
| 7 | 2023-10-19 | 1.33 | 1.38 | 3.56 |
Over the last eight quarters, the EPS (Earnings Per Share) trends for the company show a mix of both surpassing and falling short of analyst estimates, with fluctuations in performance. Notably, the company has exceeded estimates in five out of the eight quarters, suggesting a generally positive trend in earnings surprises.
Starting from the most recent quarter in October 2025, the company reported an EPS of $1.55 against an estimate of $1.54, marking a modest surprise of 0.65%. This follows a significant underperformance in April 2025, where the reported EPS of $1.06 fell short of the $1.16 estimate by -8.23%, representing the largest negative surprise in the observed period.
The company demonstrated its ability to exceed expectations notably in July 2024, with an EPS of $1.21 against an estimate of $1.12, resulting in an 8.52% positive surprise. This was one of the stronger performances relative to expectations.
Analyzing the data further, it appears there is a seasonal pattern where the company tends to underperform in the second quarter of each year (April 2024 and April 2025) and overperform in the third and fourth quarters (July and October across 2024 and 2025).
Overall, the EPS trend indicates a generally stable to positive outlook, with occasional quarters of underperformance. This suggests that while the company manages to meet or exceed expectations most of the time, there are periods of volatility that investors should be mindful of.
Dividend Payments Table
| Date | Dividend |
|---|---|
| 2025-09-29 | 0.59 |
| 2025-06-30 | 0.59 |
| 2025-03-31 | 0.59 |
| 2024-12-30 | 0.57 |
| 2024-09-30 | 0.57 |
| 2024-07-01 | 0.57 |
| 2024-03-28 | 0.57 |
| 2023-12-22 | 0.55 |
The dividend data from the last eight quarters shows a modest yet steady upward trend in dividend payouts. Starting from the quarter ending December 22, 2023, where dividends were recorded at $0.55, there has been a gradual increase. The dividends remained constant at $0.57 through four consecutive quarters spanning from December 30, 2024, to July 1, 2024. This period of stability suggests a cautious yet positive approach by the management towards cash distribution, possibly reflecting steady cash flows and a stable financial outlook during that period.
Subsequently, there is a noticeable increase to $0.59 starting from the quarter ending March 31, 2025, and this rate was maintained in the subsequent two quarters up to September 29, 2025. This increment indicates a further strengthening in the company’s financial position and possibly a confident outlook towards future earnings and profitability. Overall, the data reflects a prudent yet optimistic dividend policy, likely aimed at sustaining investor confidence and providing consistent shareholder returns amidst varying economic conditions.
The four most recent rating changes for the analyzed entity exhibit a trend of improving sentiment from financial analysts, particularly from Seaport Research Partners.
-
Raymond James Upgrade on October 21, 2024: This firm upgraded its rating from “Market Perform” to “Strong Buy,” setting a target price of $74. This significant upgrade suggests a robust improvement in the company’s outlook or performance, indicating expectations of substantial growth or a resolution of previous challenges.
-
Seaport Research Partners Upgrade on July 22, 2024: Previously rated as “Neutral,” the firm upgraded the stock to “Buy” with a target price of $65. This change reflects a positive reassessment of the company’s valuation or prospects, possibly driven by operational improvements or favorable market conditions.
-
Seaport Research Partners Upgrade on October 23, 2023: The firm upgraded their recommendation from “Sell” to “Neutral,” indicating a shift in perspective, albeit without specifying a target price. This adjustment might suggest that the reasons for the initial sell rating have been mitigated, albeit not enough for a more bullish stance.
-
Seaport Research Partners Initiation on September 12, 2023: The firm initiated coverage with a “Sell” rating and a target price of $45. This initiation at a sell stance indicates that, at that time, the analyst perceived significant downside risks or underperformance relative to market or sector peers.
These changes, particularly the sequence of upgrades by Seaport Research Partners followed by a strong endorsement from Raymond James, suggest a turning tide in the financial analysis of the company, potentially driven by improved financial health, strategic initiatives, or market conditions that favor the entity’s business model.
The current price of the stock is $66.06. Over the past year, there have been notable changes in analyst ratings and target prices. Most recently, Raymond James upgraded the stock from “Market Perform” to “Strong Buy” with a target price of $74, suggesting a potential upside of approximately 12%. Earlier, Seaport Research Partners upgraded their rating from “Neutral” to “Buy” with a target price of $65, which the stock has now surpassed. This progression follows an initial “Sell” rating from Seaport Research Partners with a target price of $45, indicating a significant positive shift in sentiment towards the stock over the year.
The series of upgrades, particularly the recent shift to “Strong Buy” by Raymond James, highlights an improving outlook on the stock by analysts, reflecting expectations of stronger performance or market conditions favorable to the stock’s sector. This trend suggests a growing confidence among analysts about the company’s future earnings potential and overall financial health.
Disclaimer: The information provided here is for educational and informational purposes only and should not be interpreted as financial advice, investment recommendations, or trading guidance. Markets involve risk, and past performance is not indicative of future results. You should always conduct your own research and consult with a qualified financial advisor before making any investment decisions. By acting, you accept full responsibility for your choices.


