Based on the OPEC Monthly Oil Market Report – August 2025
Original report: OPEC Monthly Oil Market Report – August 2025
Introduction: Stability Amid Subtle Shifts
OPEC’s August 2025 Monthly Oil Market Report (MOMR) arrives at a nuanced moment in energy markets—one where resilience exists alongside emerging vulnerabilities. Crude prices are largely range-bound, refinery output is surging, but regional margin variation and shifting trade patterns pose fresh questions. As winter approaches, can this fragile equilibrium hold?
Crude Trends: A Mixed Picture
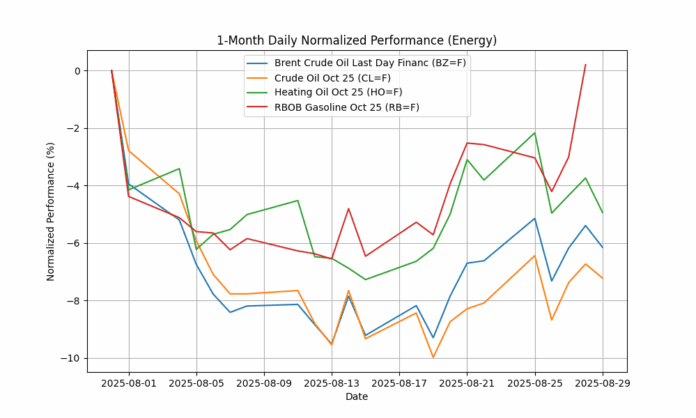
In July, the OPEC Reference Basket (ORB) climbed modestly by $1.24 to $70.97 per barrel. In contrast, Brent eased slightly to $69.55, and WTI dipped to $67.24, while GME Oman gained $1.93 to $71.42—underscoring stronger sour crude demand in Eastern markets. Backwardated forward curves for Brent and WTI signal healthy immediate demand, with Oman tightening further into backwardation. Speculative positioning rose sharply for Brent and retracted for WTI.
Global Economy & Demand: Asian Momentum Drives Growth
OPEC raised its global GDP growth forecast to 3.0% in 2025, with 2026 steady at 3.1%—moderate revisions nudging upward in the U.S. (1.8%) and China (4.8%), with India still leading at 6.5%.
In oil demand, 2025 global growth remains steady at 1.3 mb/d, overwhelmingly driven by non-OECD regions (≈1.2 mb/d), compared to a subdued 0.1 mb/d in OECD markets. For 2026, demand growth is projected at 1.4 mb/d, still powered by Asia.
Supply Dynamics: Non-OPEC Gains and OPEC+ Stability
Non-OPEC liquids supply is expected to increase by 0.8 mb/d in 2025, led by the U.S., Brazil, Canada, and Argentina; growth slows to 0.6 mb/d in 2026.
Within OPEC+, output rose by 335 tb/d in July to 41.94 mb/d, while NGLs and non-conventional liquids from DoC countries are projected to increase by 0.1 mb/d both years, reaching 8.7–8.8 mb/d.
Call volumes on OPEC crude are estimated at 42.5 mb/d in 2025 and 43.1 mb/d in 2026, indicating sustained reliance on OPEC supply.
Refining & Margins: Record Runs, Regional Strain
Global refinery throughput hit a record 83.6 mb/d in July, rising 884 tb/d month-on-month and 2.0 mb/d year-on-year, particularly from Asia, led by robust Chinese refining activity.
Margin trends diverged: strong rebound in Atlantic and European downstream margins, buoyed by diesel tightness; Singapore margins weakened under product surpluses from China.
Upcoming new refining capacities could lift runs further into Q4 2025 and Q1 2026, yet too much throughput may erode margins in an oversupplied product environment.
Winter Demand: Heating Fuels & Feedstocks Under Watch
OPEC expects heating demand to climb by 70 tb/d in Q4, with 50 tb/d in the Americas and 20 tb/d in Europe. Q1 2026 could bring another 100 tb/d boost, with LPG demand also on the rise.
Petrochemical feedstock use remains strong: China’s LPG and naphtha demand on track for a 70 tb/d annual increase in Q4, while India and other Asian economies maintain steady growth.
Still, OPEC warns that actual consumption will hinge greatly on winter weather—colder legs tighten markets, milder conditions could weigh on margins amid elevated refinery runs.
Tanker Market: Freight Slows, but Trade Remains Robust
July spot rates cooled across most tanker segments: VLCCs dropped ~14%, with Middle East-to-Asia routes leading a 20% fall. Suezmax and Aframax saw moderate declines; clean tanker routes diverged—with Mediterranean rates climbing 5%, while East of Suez fell 11%.
Trade Flows: China Soars, U.S. Retreats
Trade patterns underline persistent Asian dominance:
- U.S. crude exports fell to 3.3 mb/d, lowest since March 2022, while imports held at 6.1 mb/d.
- China’s crude imports surged to 12.2 mb/d, a 22-month high, influenced by inventory buildup; product exports, especially fuel oil, rose sharply.
- India’s crude imports dipped below 5 mb/d; LPG imports, however, reached a seven-month high.
- Japan saw crude intake fall below 2 mb/d for the first time since mid-2021, with product flows also subdued.
Inventory—Still Lean, But Building
OECD stocks numbered 2,789 mb in June, down 57.9 mb year-on-year and 91.7 mb below the five-year average. Crude levels declined, while product inventories climbed. Forward coverage dropped to 60.2 days, indicating thinner buffers. While still below norms, any substantial Q3 stock builds could quickly sour sentiment heading into winter.
Cross-Commodity Trends: Gas, Coal & Metals
OPEC highlighted related market shifts: U.S. gas (Henry Hub) rose ~5.6%, while Europe’s TTF gas eased 6%, coal (Australia) gained 3.5%, driven by Chinese/Indian restocking. Metals climbed amid tariff hedging, with gold around $1,340/oz and platinum up over 40% year-on-year.
Conclusion: A Balancing Act Under Pressure
This MOMR paints a market that is robust but perilously balanced:
- Crude pricing reflects tight prompt markets (backwardation, speculative positioning).
- Refiners are working at record levels, yet margins differ by region.
- Winter demand is a wildcard—it might shore up fundamentals or strain them further.
- Tanker metrics hint at weaker freight even as trade flows shift.
- Inventories remain lean, though unevenly distributed.
China’s role remains central: as import demand rises and Western exports decline, the global landscape tilts East. How refiners manage output, how winter unfolds, and the pace of stockbuilding will determine whether the market stays steady—or swings into volatility.


