JPMorgan Chase & Co. (JPM) Post Earning Analysis
JPMorgan Chase & Co., founded in 1799 and headquartered in New York, is a leading global financial services firm. It offers a broad range of services including investment banking, consumer financial services, commercial banking, transaction processing, and asset management. The company operates through multiple segments: Consumer and Community Banking, Commercial and Investment Bank, Asset and Wealth Management, and Corporate, each catering to distinct client needs and markets.
Recent updates in the financial sector indicate a significant performance boost for major banks such as Bank of America and Morgan Stanley, driven by a 43% jump in investment-banking revenue, leading to a substantial profit beat. This trend was mirrored by JPMorgan and Goldman Sachs, which also reported strong quarterly results, largely attributed to heightened trading and investment banking activities. Despite these positive outcomes, JPMorgan CEO Jamie Dimon highlighted potential risks in the AI sector, advising a cautious approach to project evaluations to avoid bubble-like conditions.
Furthermore, the broader stock market seems to be reacting positively to these robust bank earnings, with stock indices like the S&P 500 likely benefiting from this financial uptick. However, Dimon’s warnings about possible credit issues in the banking industry, referencing recent troubles like the Tricolor bankruptcy, suggest that banks might still face significant challenges ahead.
These developments could influence investor sentiment positively in the short term, bolstering confidence in financial stocks. However, the caution advised by industry leaders about potential market overvaluations in AI and credit risks could temper long-term expectations. Investors and stakeholders in the banking and financial sectors should monitor these trends closely to adjust their strategies accordingly.
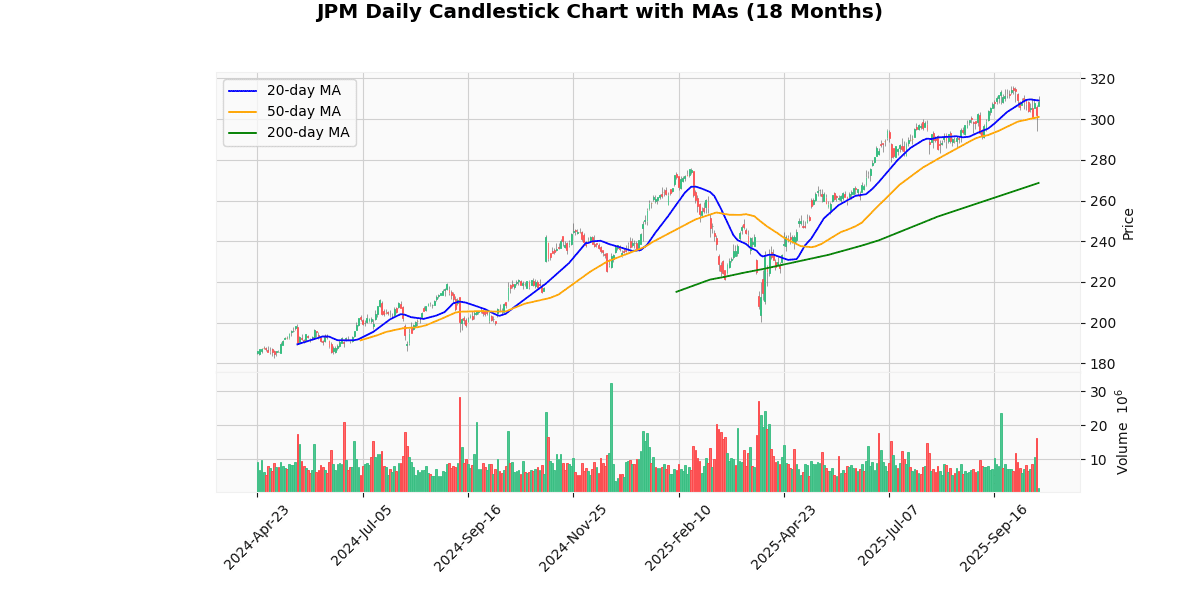
The current price of the asset is $308.22, reflecting a significant daily increase of 2.33%. This recent surge places the price just below the week’s high of $311.32 and near the 52-week and YTD highs of $316.47, suggesting a strong short-term upward momentum.
The asset has shown considerable growth from its 52-week and YTD lows of $200.22, with an impressive increase of approximately 54%. This robust year-long recovery is further underscored by its current standing above all major moving averages: it is 14.72% above the 200-day MA, 2.38% above the 50-day MA, and slightly below the 20-day MA by 0.3%, indicating a potential consolidation phase in the very short term.
The RSI at 53.19 suggests that the asset is neither overbought nor oversold, providing a neutral signal. However, the positive MACD of 0.76 indicates underlying bullish momentum. These technical indicators, combined with the asset’s performance relative to its moving averages and recent highs/lows, suggest a generally bullish outlook, albeit with potential for slight volatility in the near term.
Price Chart

JPMorgan Chase & Co. reported robust financial results for the third quarter of 2025, with notable increases in revenue and earnings per share. The company disclosed a net income of $14.4 billion, marking a 12% rise from the same period the previous year. Earnings per share (EPS) also saw a significant increase, up 16% year-over-year to $5.07. Total revenue for the quarter came in at $46.4 billion, with managed revenue slightly higher at $47.1 billion, both reflecting a growth of 9% compared to Q3 2024.
The firm’s net interest income was reported at $24.1 billion, a 2% increase from the prior year, while noninterest revenue surged by 16% to $23.0 billion. Noninterest expenses rose to $24.3 billion, up 8% due to higher compensation and operational costs. Provisions for credit losses were substantial at $3.4 billion, with net charge-offs increasing by 24% to $2.6 billion.
JPMorgan also highlighted capital distributions, declaring a common dividend of $4.1 billion, which translates to $1.50 per share, and executing $8.0 billion in common stock net repurchases. The firm’s book value per share increased by 9% to $124.96, and its tangible book value per share grew by 10% to $105.70. The Basel III common equity Tier 1 capital stood at $287 billion, with capital ratios of 14.8% and 14.9% under standardized and advanced approaches, respectively.
Overall, JPMorgan Chase & Co. demonstrated strong financial health and growth in the third quarter of 2025, underscored by significant increases in revenue and net income across its various business segments.
Earnings Trend Table
| Date | Estimate EPS | Reported EPS | Surprise % | |
|---|---|---|---|---|
| 0 | 2025-10-14 | 4.85 | 5.07 | 4.54 |
| 1 | 2025-04-11 | 4.61 | 4.91 | 6.42 |
| 2 | 2025-01-15 | 4.11 | 4.81 | 17.08 |
| 3 | 2024-10-11 | 4.01 | 4.37 | 9.02 |
| 4 | 2024-07-12 | 4.19 | 4.26 | 1.75 |
The examination of EPS trends over the last eight quarters reveals a consistent pattern of outperformance relative to estimates, indicative of robust financial health and potentially conservative forecasting. Notably, the most recent quarter (Q3 2025) reported an EPS of 5.07 against an estimate of 4.85, marking a 4.54% positive surprise. This trend of surpassing expectations is evident across all observed quarters.
A significant highlight in the data is the Q1 2025, where the company reported an EPS of 4.81, vastly exceeding the estimate of 4.11 by a remarkable 17.08%. This quarter stands out as the peak of performance relative to expectations, suggesting a possible cyclical peak or an exceptionally strong quarter due to specific operational successes or market conditions.
The trend over the quarters shows a gradual increase in both estimated and reported EPS, indicating consistent growth and operational improvement. For instance, the reported EPS has risen from 4.26 in Q3 2024 to 5.07 in Q3 2025, underscoring sustained profitability enhancements.
Overall, the data portrays a company that not only consistently beats estimates but also shows a pattern of growing earnings, which could be attractive to investors looking for financial stability and growth.
Dividend Payments Table
| Date | Dividend |
|---|---|
| 2025-10-06 | 1.5 |
| 2025-07-03 | 1.4 |
| 2025-04-04 | 1.4 |
| 2025-01-06 | 1.25 |
| 2024-10-04 | 1.25 |
| 2024-07-05 | 1.15 |
| 2024-04-04 | 1.15 |
| 2024-01-04 | 1.05 |
The review of the dividend data from January 2024 to October 2025 reveals a clear upward trend in the dividend payments over the period. Starting from January 2024, dividends were at 1.05, showing a steady and consistent increase in subsequent quarters. By July 2024, dividends had risen to 1.15, marking a 9.5% increase within six months. This upward trajectory continued through 2024 and into 2025, with dividends further increasing to 1.25 by October 2024 and maintaining this level through January 2025.
The second half of 2025 saw another rise, with dividends reaching 1.4 in April and July, and eventually peaking at 1.5 by October 2025. This represents a significant growth of 42.9% from the initial figure in January 2024. The consistent increase in dividend payments over these eight quarters suggests a robust financial performance and a strong commitment to returning value to shareholders. This progressive dividend policy could be indicative of the company’s confidence in its ongoing profitability and operational stability.
In the recent series of rating changes, the financial sector experienced notable adjustments by several prominent firms.
-
Keefe Bruyette on July 9, 2025: Keefe Bruyette upgraded their rating from “Market Perform” to “Outperform” with a target price set at $327. This upgrade suggests a positive revision of the firm’s future performance expectations, potentially due to improved financial metrics or market conditions that could favor the company’s business model.
-
HSBC Securities on July 8, 2025: A day prior to Keefe Bruyette’s upgrade, HSBC Securities downgraded their rating from “Hold” to “Reduce” with a new target price of $259. This downgrade indicates a bearish outlook, suggesting that the expected performance of the firm may deteriorate, or that the market conditions could become less favorable for its operational success.
-
Robert W. Baird on June 27, 2025: Robert W. Baird issued a downgrade from “Neutral” to “Underperform” and set the target price at $235. This significant adjustment reflects a strong pessimistic stance regarding the company’s future earnings potential or operational efficiency.
-
TD Cowen on May 15, 2025: Earlier in the quarter, TD Cowen initiated coverage on the firm with a “Buy” rating and a target price of $305. This initiation indicates a positive outlook, with expectations of above-average market performance driven by solid fundamentals or strategic initiatives likely to enhance shareholder value.
These shifts in ratings and target adjustments provide a mixed but insightful view into the evolving perceptions of analysts regarding the firm’s financial health and market positioning. Each rating change potentially impacts investor sentiment and could influence the company’s stock performance in the forthcoming periods.
The current price of the stock stands at $308.22. This price is positioned between the varied target prices set by different analysts. Keefe Bruyette recently upgraded the stock to ‘Outperform’ with a target price of $327, suggesting potential growth from the current level. Conversely, HSBC Securities and Robert W. Baird have downgraded the stock to ‘Reduce’ and ‘Underperform’ with target prices of $259 and $235 respectively, indicating a bearish outlook. TD Cowen initiated coverage with a ‘Buy’ rating and a target price of $305, slightly below the current price.
This mixed sentiment among analysts reflects a diverse perspective on the stock’s future movement, highlighting the uncertainty and varying expectations based on different valuation metrics or market outlooks. The average of the provided target prices is approximately $281.50, which is below the current trading price, suggesting that the stock might be perceived as overvalued by some analysts.
Disclaimer: The information provided here is for educational and informational purposes only and should not be interpreted as financial advice, investment recommendations, or trading guidance. Markets involve risk, and past performance is not indicative of future results. You should always conduct your own research and consult with a qualified financial advisor before making any investment decisions. By acting, you accept full responsibility for your choices.


