Top 10 Performers
Arm Holdings plc. ADR (ARM) (11.03%)
Technical Analysis
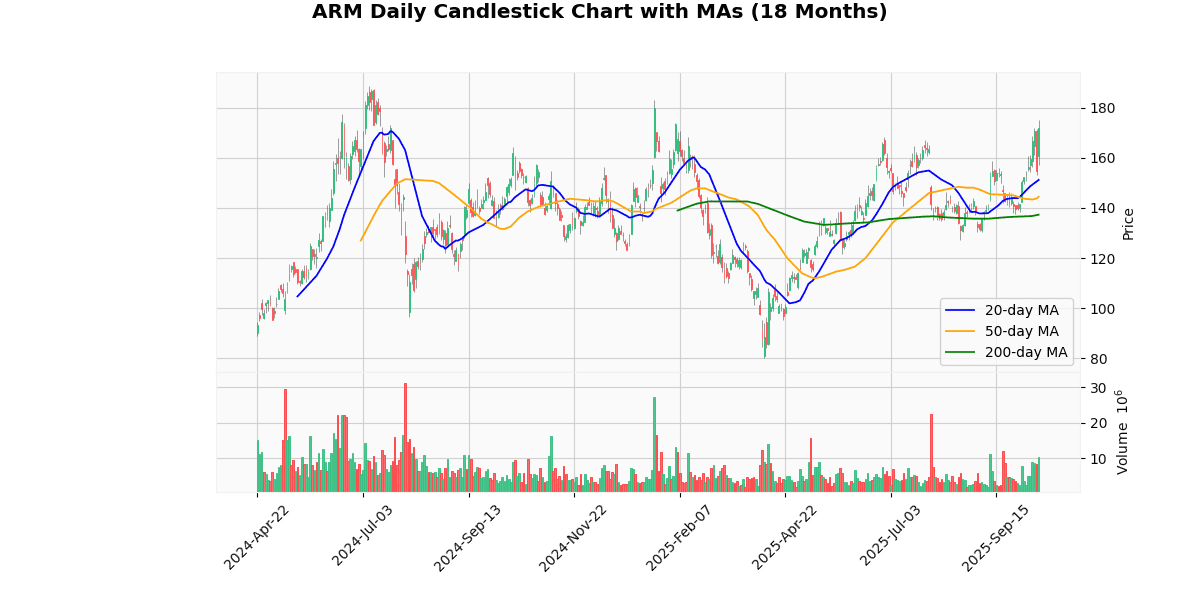
The current price of the asset at $171.94 indicates a robust upward trend, as it stands well above all key moving averages: 20-day MA at $151.15, 50-day MA at $144.45, and 200-day MA at $137.29. This positioning suggests a strong bullish momentum in the short, medium, and long term. The significant gap between the current price and these averages, especially the 200-day MA, highlights sustained buying interest and investor confidence in the asset’s growth potential. The consistent increase across these moving averages also points to a solidifying uptrend, with the shorter-term MA (20-day) accelerating faster than the longer-term MAs, reinforcing the current bullish market sentiment. Investors might view these metrics as a confirmation of a favorable market positioning, potentially leading to continued upward movement in price.
Recent Ratings
| Date | Status | Outer | Rating | Price |
|---|---|---|---|---|
| 2025-08-11 00:00:00 | Initiated | Seaport Research Partners | Buy | $150 |
| 2025-07-31 00:00:00 | Reiterated | TD Cowen | Buy | $155 → $175 |
| 2025-07-16 00:00:00 | Upgrade | BNP Paribas Exane | Neutral → Outperform | $210 |
| 2025-07-10 00:00:00 | Initiated | Goldman | Neutral | $160 |
Broadcom Inc (AVGO) (9.88%)
Recent News (Last 24 Hours)
Recent news highlights a significant surge in Broadcom’s stock following its strategic partnership with OpenAI to develop custom AI systems. This collaboration, which involves a multi-year deal to build up to 10 gigawatts of custom chips, has positioned Broadcom favorably in the semiconductor industry, catalyzing a notable rally in its shares and broader sector ETFs. The deal is anticipated to be more cost-effective than current GPU options, potentially disrupting competitors like Nvidia and reshaping investment perspectives within the AI chip market.
The easing of geopolitical tensions has also contributed to a broader market upswing, with major U.S. stock indexes like the Dow, S&P 500, and Nasdaq experiencing significant gains. This positive sentiment is further buoyed by the semiconductor sector’s robust performance, underscored by Broadcom’s recent achievements and bullish outlook reaffirmed by Bernstein.
Investors are advised to monitor the developments around Broadcom’s integration with OpenAI’s technology, as this could herald sustained growth and influence market dynamics, particularly in the technology and AI sectors. The strategic moves by Broadcom and the overall market rebound present potential investment opportunities, albeit with considerations of the evolving geopolitical and economic landscape.
Technical Analysis
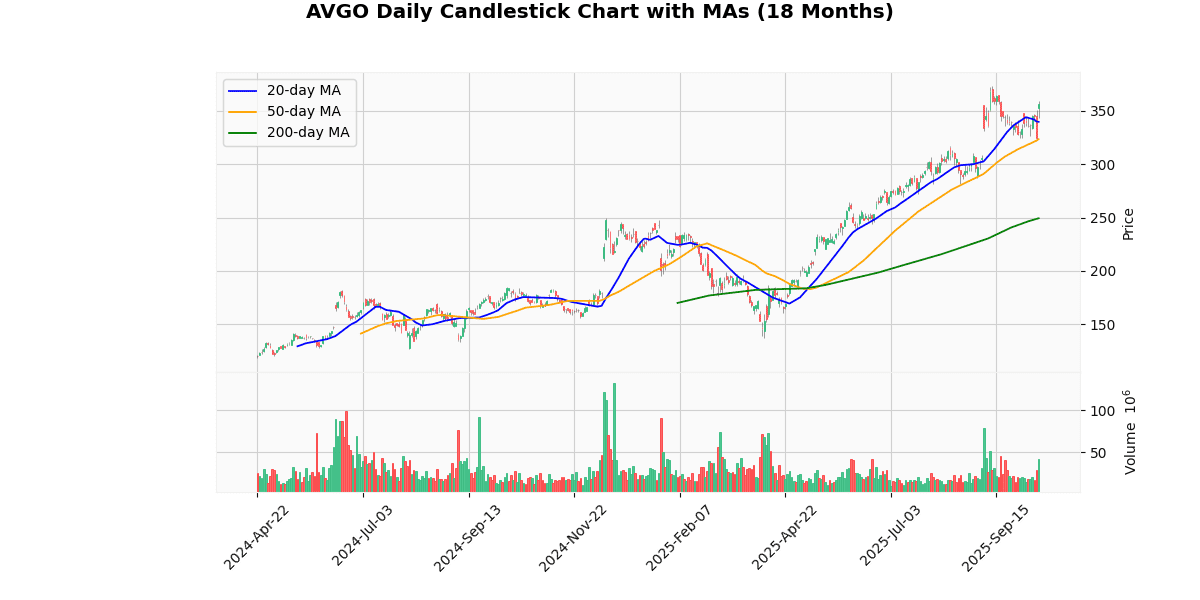
The current price of the asset at $356.7 indicates a robust upward trend, as evidenced by its position above all key moving averages: 20-day MA at $339.66, 50-day MA at $323.45, and 200-day MA at $249.35. This positioning suggests a strong bullish momentum in the short, medium, and long term. The significant gap between the current price and the 200-day MA highlights a potential overextension in the market, which could lead to volatility or price corrections in the near future. However, the consistent increase in moving averages, with the 20-day MA above the 50-day MA, and both well above the 200-day MA, reinforces the strength of the current uptrend. Investors should monitor for any signs of reversal but may find continued growth opportunities in this bullish market environment.
Recent Ratings
| Date | Status | Outer | Rating | Price |
|---|---|---|---|---|
| 2025-09-15 00:00:00 | Initiated | Macquarie | Outperform | $420 |
| 2025-09-05 00:00:00 | Reiterated | TD Cowen | Buy | $355 → $370 |
| 2025-08-28 00:00:00 | Reiterated | Oppenheimer | Outperform | $305 → $325 |
| 2025-07-10 00:00:00 | Initiated | Goldman | Buy | $315 |
ON Semiconductor Corp (ON) (9.55%)
Recent News (Last 24 Hours)
On October 13, 2025, onsemi (ON) stock experienced an uptick, as highlighted by StockStory, although specific details on the reasons behind the rise were not provided in the summary. This movement could indicate positive investor sentiment or reactions to favorable company news, potentially impacting the stock’s short-term trading volume and price stability.
Additionally, broader market activities included significant movements in stocks like Broadcom and Warner Bros. Discovery, as reported by Investopedia. Such movements in major stocks suggest a possibly volatile trading environment which could affect associated sectors and supply chains, including semiconductor companies like onsemi.
Furthermore, MP Materials’ stock climb, noted by MarketWatch, amid U.S.-China trade tensions, underscores the geopolitical factors influencing market dynamics. This situation could lead to increased market caution, impacting stocks across various sectors, including technology and manufacturing, which are sensitive to trade policy changes.
Overall, these developments could influence investor strategies, particularly in technology and trade-sensitive stocks, potentially leading to shifts in market liquidity and investor behavior in related sectors.
Technical Analysis
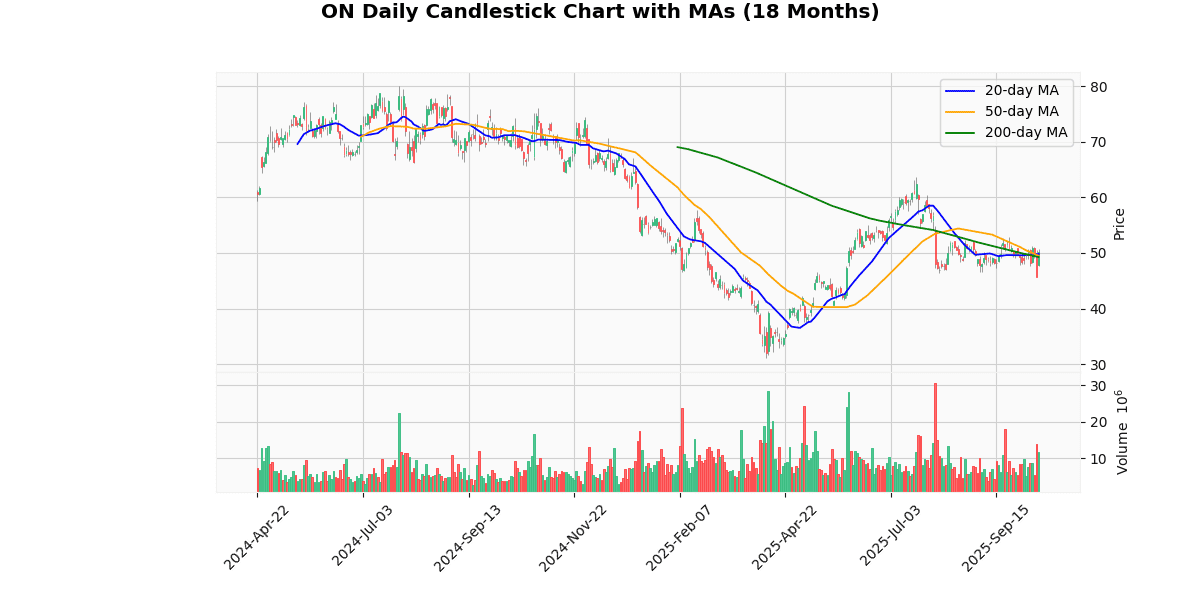
The current price of the asset at $50.11 indicates a bullish trend when compared to its moving averages across different time frames: 20-day MA at $49.79, 50-day MA at $49.48, and 200-day MA at $49.26. This ascending order of moving averages suggests a consistent upward momentum in the short, medium, and long term. The price positioning above all three moving averages further reinforces a positive market sentiment, indicating that the asset is potentially in a strong bullish phase. Investors might view these metrics as a confirmation of a sustained uptrend, potentially leading to increased buying interest. However, it’s crucial for traders to monitor for any signs of reversal, especially if the price begins to approach these moving average levels closely, which could serve as key support zones.
Recent Ratings
| Date | Status | Outer | Rating | Price |
|---|---|---|---|---|
| 2025-08-05 00:00:00 | Reiterated | TD Cowen | Buy | $68 → $55 |
| 2025-08-05 00:00:00 | Downgrade | BofA Securities | Buy → Neutral | $56 |
| 2025-07-10 00:00:00 | Initiated | Goldman | Neutral | $60 |
| 2025-06-18 00:00:00 | Initiated | Cantor Fitzgerald | Neutral | $55 |
Microchip Technology Inc (MCHP) (6.59%)
Recent News (Last 24 Hours)
Microchip Technology Inc. (MCHP) experienced a significant surge in its stock price today, following the company’s announcement of the launch of its pioneering 3 nm PCIe Gen 6 switch, designed to enhance modern AI infrastructure. This development, reported by GlobeNewswire early in the morning, underscores Microchip’s leading edge in semiconductor innovation, particularly in the rapidly growing field of artificial intelligence.
The new 3 nm technology is expected to deliver substantial improvements in performance and efficiency, positioning Microchip as a key player in the AI technology supply chain. This could potentially lead to increased market share and higher demand for Microchip’s products, influencing long-term revenue growth.
The market’s response suggests strong confidence in Microchip’s strategic direction and its ability to capitalize on expanding opportunities within the AI sector. This move is likely to attract further attention from institutional investors and analysts, potentially leading to upward revisions in stock ratings and price targets.
Technical Analysis
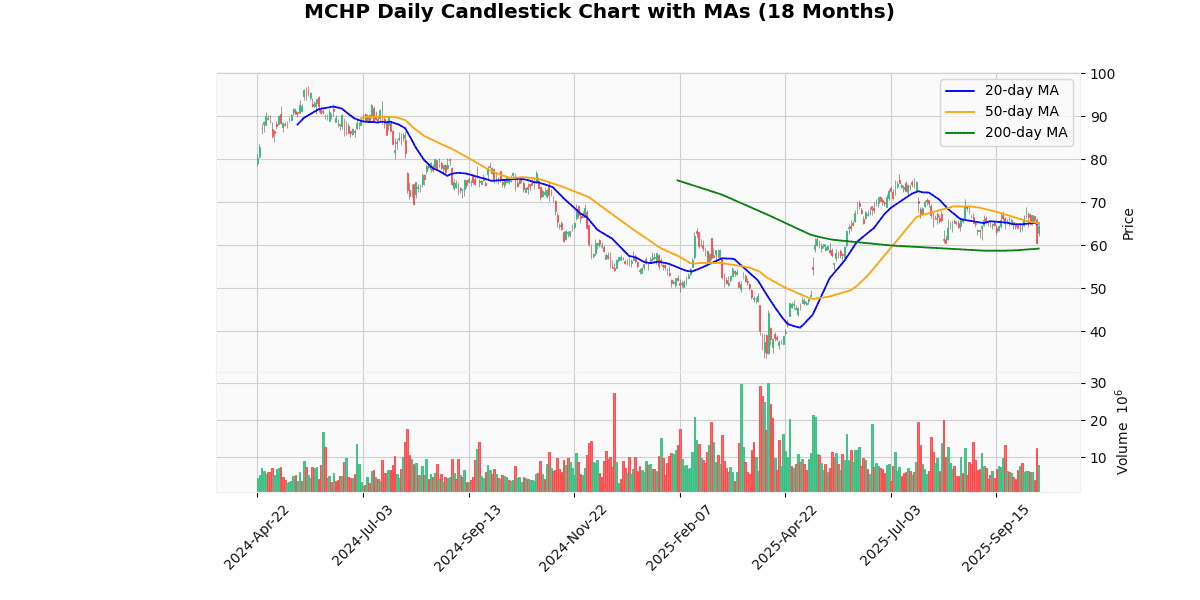
The current price of the asset at $64.39 is positioned below both the 20-day and 50-day moving averages (MA), which are $65.05 and $65.12, respectively. This indicates a short-term downward trend as the price is trading below the levels that represent the average prices over the last 20 and 50 days. However, the price remains well above the 200-day moving average of $59.20, suggesting that the longer-term trend is still bullish. The fact that the shorter-term MAs are closely aligned but above the current price could signal a consolidation phase or a potential resistance area around the $65 mark. Investors might view any approach towards these moving averages as a test for either a rebound to continue the longer-term uptrend or a further decline if the price fails to surpass these levels.
Recent Ratings
| Date | Status | Outer | Rating | Price |
|---|---|---|---|---|
| 2025-09-15 00:00:00 | Initiated | Wells Fargo | Equal Weight | $60 |
| 2025-08-08 00:00:00 | Reiterated | TD Cowen | Hold | $75 → $60 |
| 2025-07-10 00:00:00 | Initiated | Goldman | Buy | $88 |
| 2025-06-18 00:00:00 | Initiated | Cantor Fitzgerald | Neutral | $70 |
Micron Technology Inc (MU) (6.15%)
Recent News (Last 24 Hours)
Micron Technology, Inc. (MU) has recently been the focus of significant analyst attention, potentially impacting its stock performance. Morgan Stanley upgraded Micron to “Overweight” and increased its price target to $220, reflecting a positive outlook on the company’s future performance (Insider Monkey). This upgrade aligns with UBS’s recent action, where they raised their price target for Micron to $225, citing a brighter outlook for High Bandwidth Memory (HBM) demand (Insider Monkey).
These analyst upgrades and positive mentions could lead to increased investor confidence and upward pressure on Micron’s stock price, making it a noteworthy candidate for value investors looking for robust returns in the technology sector.
Technical Analysis
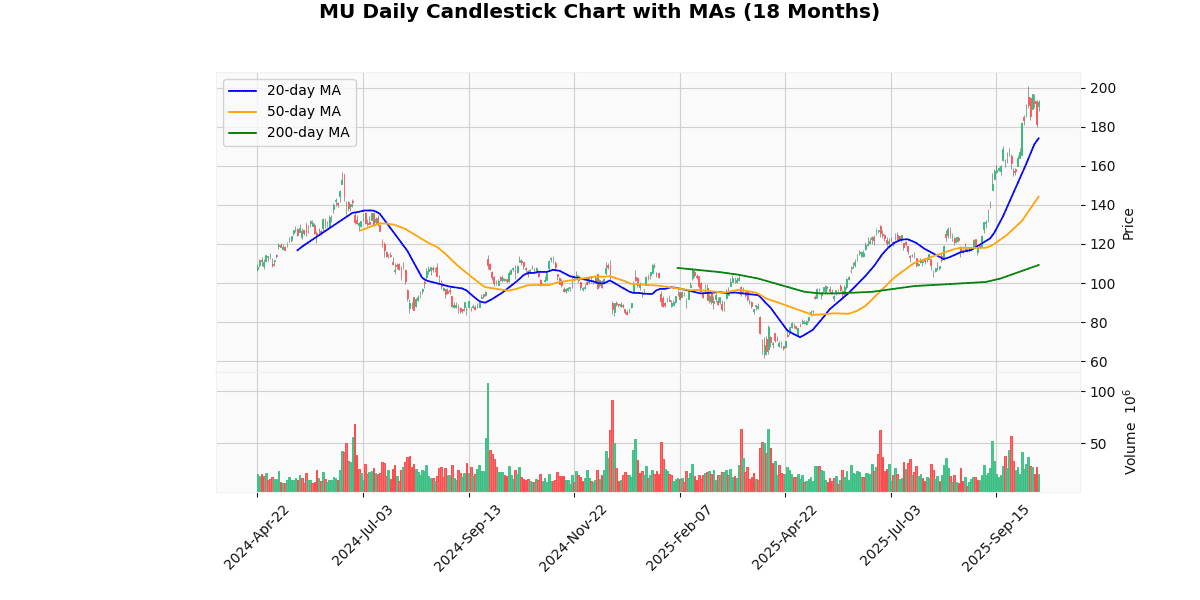
The current price of the asset at $192.77 exhibits a robust upward trend when analyzed against its moving averages (MAs). The 20-day MA at $174.04, the 50-day MA at $144.19, and the 200-day MA at $109.21 all confirm a strong bullish momentum, as each shorter-term MA is positioned well above the longer-term MAs. This configuration suggests that recent prices have consistently outperformed historical averages, indicating sustained buying interest.
The significant gap between the current price and all three MAs could also imply that the asset might be approaching overbought territory, which could lead to potential volatility or price corrections in the near term. However, the steep gradient of the MAs, particularly the 200-day MA, underscores a solid long-term uptrend, reinforcing confidence among long-term investors. Market participants should monitor for any signs of reversal, but the prevailing trend remains decisively positive.
Recent Ratings
| Date | Status | Outer | Rating | Price |
|---|---|---|---|---|
| 2025-10-13 | Upgrade | BNP Paribas Exane | Underperform → Outperform | $270 |
| 2025-10-08 00:00:00 | Reiterated | UBS | Buy | $195 → $225 |
| 2025-10-07 00:00:00 | Initiated | Itau BBA | Outperform | $249 |
| 2025-10-06 00:00:00 | Upgrade | Morgan Stanley | Equal-Weight → Overweight | $220 |
NXP Semiconductors NV (NXPI) (5.52%)
Technical Analysis
The current price of the asset at $216.70 is positioned below both the 20-day and 50-day moving averages (MA20 at $223.99 and MA50 at $223.64), indicating a short-term bearish trend as the price has recently declined relative to these averages. However, it is important to note that the current price remains above the 200-day moving average (MA200 at $210.08), suggesting that the longer-term trend remains bullish. This juxtaposition between the short-term and long-term trends might signal a potential consolidation phase or a temporary pullback within a broader upward trajectory. Investors should monitor if the price will stabilize or rebound towards the shorter-term moving averages, or if a sustained drop below the MA200 could indicate a shift to a longer-term bearish trend.
Recent Ratings
| Date | Status | Outer | Rating | Price |
|---|---|---|---|---|
| 2025-07-10 00:00:00 | Initiated | Goldman | Buy | $276 |
| 2025-04-30 00:00:00 | Reiterated | TD Cowen | Buy | $185 → $210 |
| 2025-02-20 00:00:00 | Upgrade | Citigroup | Neutral → Buy | $210 → $290 |
| 2025-02-12 00:00:00 | Upgrade | Morgan Stanley | Equal-Weight → Overweight | $231 → $257 |
Tesla Inc (TSLA) (5.42%)
Recent News (Last 24 Hours)
Tesla Inc. (TSLA) has experienced a significant slump in Cybertruck sales, which dropped by 62.6% in the third quarter of this year, as reported by Quartz. This downturn comes amid a broader surge in the electric vehicle (EV) market, suggesting specific challenges for this model in a competitive environment. Despite this setback, Tesla’s stock has shown resilience with various analysts and financial news outlets highlighting its potential.
Furthermore, Tesla has made strategic moves to counteract sales challenges, including price cuts which MarketWatch describes as a gamble that could potentially pay off by boosting demand. Additionally, Tesla is ramping up production at its Shanghai Gigafactory to meet rising demand, indicating proactive measures to maintain its market leadership.
Overall, while the drop in Cybertruck sales presents a near-term challenge, Tesla’s broader strategic initiatives and strong market positioning may cushion the stock from significant negative impacts. Investors should monitor how Tesla’s pricing strategies and production adjustments evolve in response to market dynamics and competitive pressures.
Technical Analysis
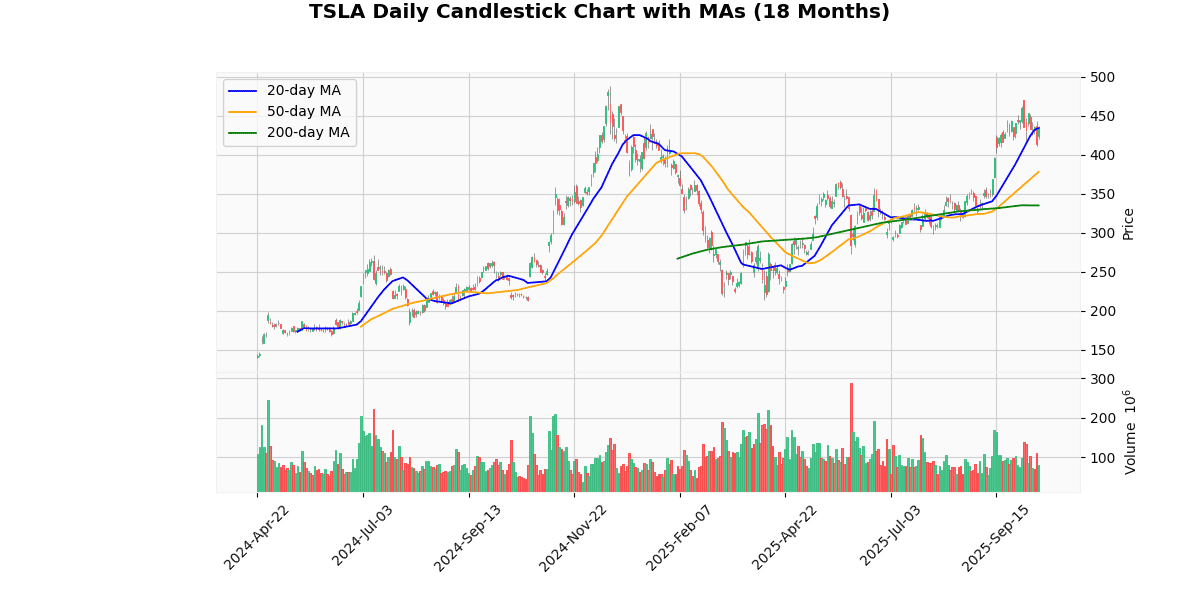
The current price of the asset at $435.9 indicates a bullish trend, as it is positioned above all key moving averages: 20-day MA at $434.01, 50-day MA at $378.01, and 200-day MA at $334.88. This alignment suggests a strong upward momentum over short, medium, and long-term periods. The price surpassing the 20-day MA, albeit marginally, reinforces the continuation of the recent uptrend, signaling robust investor confidence and potential resistance near this level. The significant gap between the current price and the 50-day and 200-day MAs underscores a robust bullish sentiment in the market, possibly indicating that the asset is overextended in the short term. Investors might look for consolidation or a minor pullback before further upward movements, keeping an eye on the 20-day MA for immediate support.
Recent Ratings
| Date | Status | Outer | Rating | Price |
|---|---|---|---|---|
| 2025-10-13 | Initiated | Melius | Buy | $520 |
| 2025-10-10 00:00:00 | Reiterated | RBC Capital Mkts | Outperform | $325 → $500 |
| 2025-10-09 00:00:00 | Reiterated | TD Cowen | Buy | $374 → $509 |
| 2025-10-08 00:00:00 | Reiterated | Stifel | Buy | $440 → $483 |
Qualcomm Inc (QCOM) (5.38%)
Recent News (Last 24 Hours)
Qualcomm Inc. (QCOM) experienced a decline in its stock value as recent developments in China have raised concerns among investors. On October 13, 2025, news broke that China’s market regulation agency has initiated an investigation into Qualcomm for potential violations of the country’s Anti-Monopoly Law. This scrutiny, detailed by DigiTimes, follows Qualcomm’s recent activities in the region, which are now under regulatory examination for compliance with competitive practices.
Investors are advised to closely monitor the situation as the investigation could lead to fines, restrictions, or changes in Qualcomm’s business practices in China. The outcome of this probe, coupled with the broader geopolitical climate, could significantly influence Qualcomm’s financial performance and stock valuation in the near term.
Technical Analysis
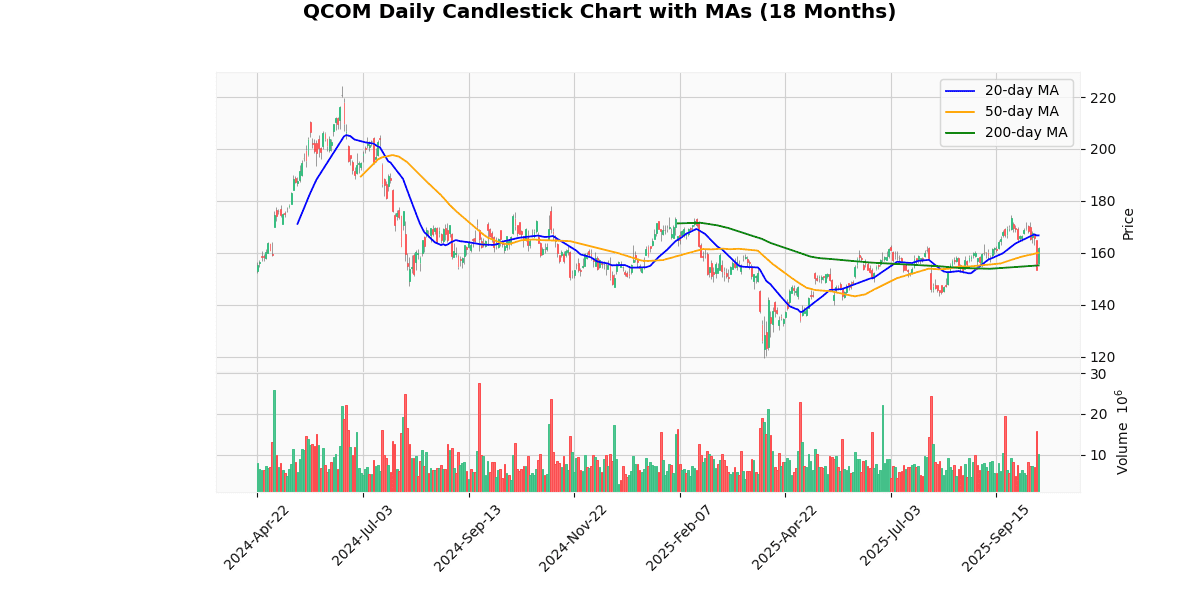
The current price of the asset at $161.78 shows a nuanced position relative to its moving averages. It is currently trading below the 20-day moving average (MA20) of $166.76, indicating a short-term bearish sentiment as it has recently underperformed. However, it is positioned above both the 50-day and 200-day moving averages, at $160.03 and $155.18 respectively, suggesting a stronger position in the medium to long-term perspective. This positioning above the MA50 and MA200 could indicate underlying bullish trends, with potential support levels that might encourage buying interest. Investors might view the dip below the MA20 as a temporary pullback within a generally upward trend, provided the price remains supported above the longer-term moving averages. This mixed signal warrants a cautious approach, balancing between short-term sell-offs and long-term acquisition strategies.
Recent Ratings
| Date | Status | Outer | Rating | Price |
|---|---|---|---|---|
| 2025-08-26 00:00:00 | Upgrade | Arete | Neutral → Buy | $200 |
| 2025-07-31 00:00:00 | Reiterated | Piper Sandler | Overweight | $190 → $175 |
| 2025-07-31 00:00:00 | Reiterated | Mizuho | Outperform | $190 → $185 |
| 2025-05-09 00:00:00 | Initiated | Seaport Research Partners | Neutral |
ASML Holding NV (ASML) (5.18%)
Recent News (Last 24 Hours)
Recent developments in the financial markets have highlighted significant movements in rare earth stocks and key technology companies. The announcement of a more costly U.S.-China deal has notably driven up prices in the rare earth sector, suggesting a potential increase in costs for companies dependent on these materials, which could impact their stock performance positively in the short term due to heightened demand expectations.
In the technology sector, ASML Holding N.V. (ASML) has been a focal point, with multiple news items underscoring its current market position and future prospects. Ahead of its Q3 earnings, there is considerable attention on ASML’s bookings and EUV (extreme ultraviolet) demand, which are critical indicators of the company’s performance and semiconductor industry health. Analysts and funds are showing interest, with Bristlemoon Global Fund establishing a position in ASML, indicating a positive outlook from institutional investors.
Technical Analysis
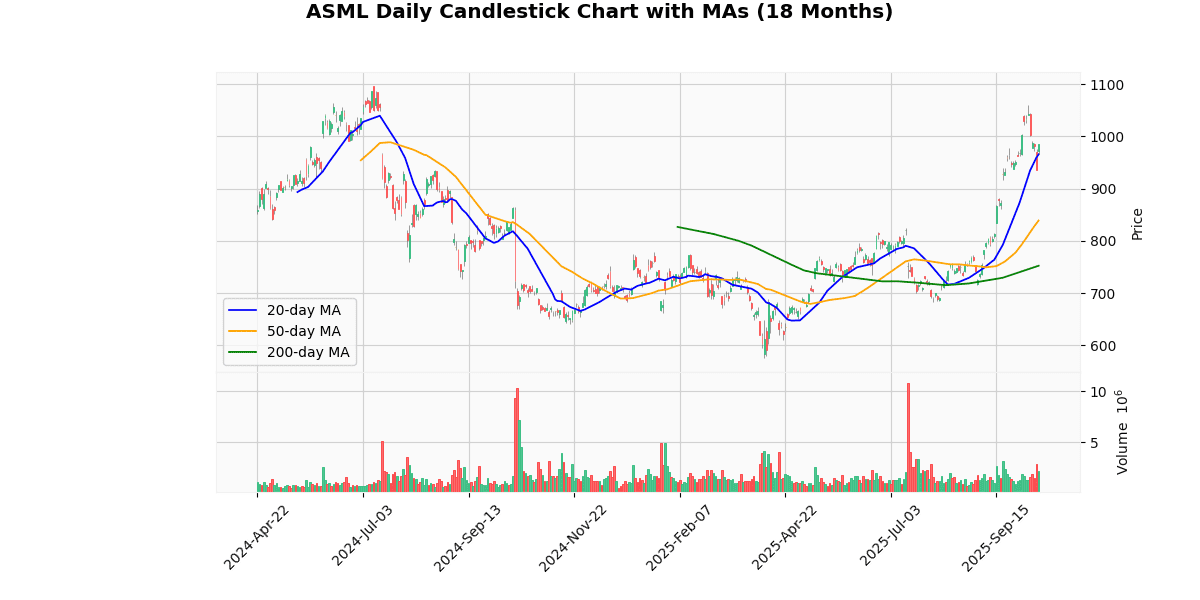
The current price of the asset at $984.66 indicates a strong upward trend, as evidenced by its position above all key moving averages: 20-day MA at $965.56, 50-day MA at $838.90, and 200-day MA at $752.47. This positioning above the moving averages suggests a robust bullish momentum in the short, medium, and long term. The significant gap between the current price and the 50-day and 200-day MAs highlights sustained buying interest and potential underestimation by the market in earlier periods. The rise above the 20-day MA further confirms recent positive sentiment among investors, potentially indicating continued upward movement. Traders should monitor for any signs of consolidation or retracement, but the prevailing trend points towards a favorable market positioning for continued growth.
Recent Ratings
| Date | Status | Outer | Rating | Price |
|---|---|---|---|---|
| 2025-10-06 00:00:00 | Downgrade | New Street | Buy → Neutral | |
| 2025-09-29 00:00:00 | Upgrade | Mizuho | Neutral → Outperform | |
| 2025-09-22 00:00:00 | Upgrade | Morgan Stanley | Equal-Weight → Overweight | |
| 2025-09-22 00:00:00 | Upgrade | Erste Group | Hold → Buy |
Lam Research Corp (LRCX) (4.90%)
Recent News (Last 24 Hours)
Lam Research Corporation (LRCX) has recently been highlighted in several financial news outlets, indicating a positive momentum in its stock performance and technological advancements. On October 13, 2025, Lam Research announced a significant breakthrough in advanced packaging etch technology, as reported by Insider Monkey. This innovation is likely to enhance the company’s competitive edge in the semiconductor equipment sector, potentially leading to increased market share and revenue growth.
Additionally, StockStory noted that LRCX stock is experiencing an uptick, which investors should be aware of. This rise could be attributed to the company’s latest technological advancements and strong market positioning. Furthermore, the Heartland Mid Cap Value Fund has identified Lam Research as a standout quality value holding, suggesting strong fundamentals and potential for long-term investment returns.
Technical Analysis
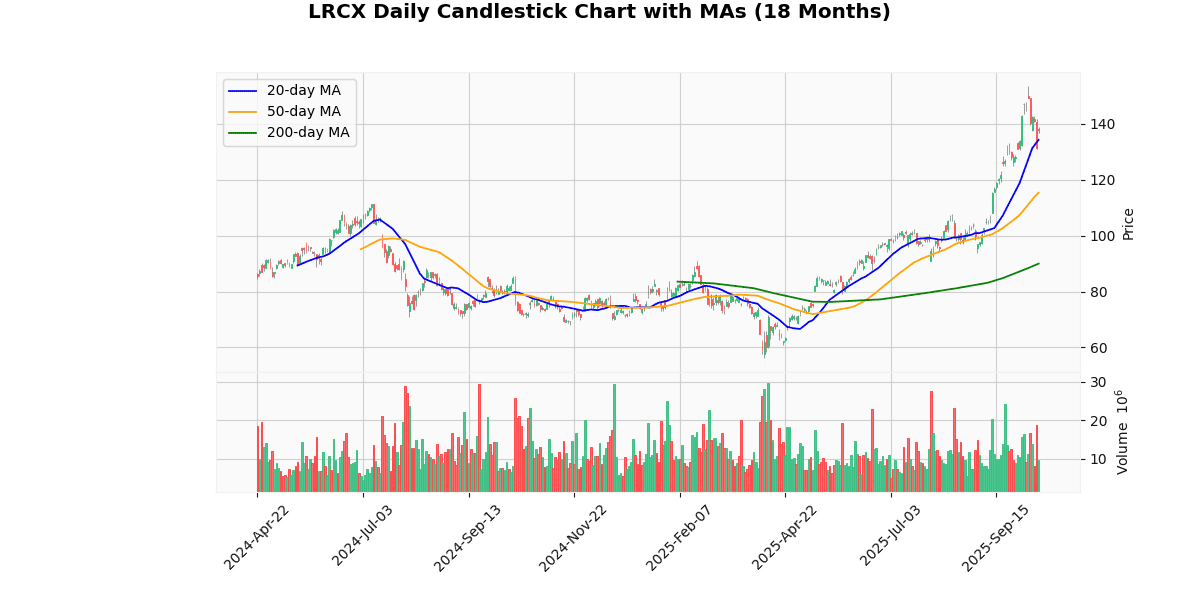
The current price of the asset at $137.81 indicates a strong upward trend when compared to its moving averages: 20-day MA at $134.29, 50-day MA at $115.4, and 200-day MA at $89.98. This pattern suggests a robust bullish momentum, as the price is consistently above all key moving averages, which are themselves in ascending order. The significant gap between the 50-day and 200-day moving averages further underscores a sustained positive sentiment in the market over the medium to long term. Investors might view these indicators as a strong buy signal, particularly as the price continues to set new highs relative to its moving averages. However, traders should also be cautious of potential overextensions or corrections, given the steep rise over a relatively short period.
Recent Ratings
| Date | Status | Outer | Rating | Price |
|---|---|---|---|---|
| 2025-09-30 00:00:00 | Initiated | HSBC Securities | Hold | $127 |
| 2025-09-29 00:00:00 | Upgrade | Deutsche Bank | Hold → Buy | $150 |
| 2025-09-23 00:00:00 | Downgrade | KeyBanc Capital Markets | Overweight → Sector Weight | |
| 2025-09-22 00:00:00 | Upgrade | Morgan Stanley | Underweight → Equal-Weight | $125 |
Worst 10 Performers
Fastenal Co (FAST) (-7.54%)
Recent News (Last 24 Hours)
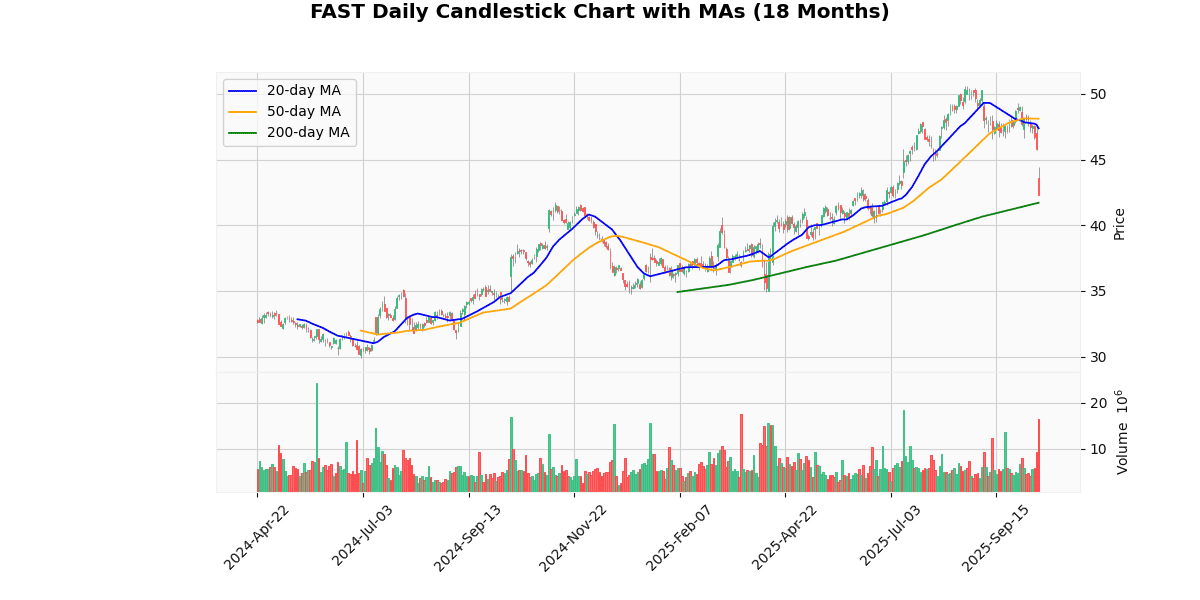
Fastenal Co (FAST) reported its Q3 2025 earnings, revealing strong sales growth despite broader market challenges. However, the company’s stock experienced a downturn due to a miss on Q3 earnings and sales expectations, alongside soft pricing which overshadowed its financial results. This was highlighted in multiple reports, including those from Zacks and Bloomberg, indicating a gap lower after the Q3 profit miss and a general decline in stock price following the earnings announcement.
Investors and analysts will likely continue to scrutinize Fastenal’s ability to manage pricing pressures and maintain its sales growth amidst a challenging economic environment. The broader implications for the industrial sector and stock market sentiment, particularly within the S&P 500 industrials, were also noted by Investor’s Business Daily, suggesting a cautious outlook for similar stocks in the sector.
Technical Analysis
The current price of the asset, at $42.33, is trading below both the 20-day and 50-day moving averages (MAs), which are $47.38 and $48.11, respectively. This positioning suggests a bearish short-term trend, as the price is underperforming relative to recent averages. However, it is noteworthy that the current price is slightly above the 200-day MA of $41.72, indicating that the longer-term trend might be shifting towards bullish. The fact that the shorter-term MAs are significantly higher than the 200-day MA also reflects a recent downturn in price, possibly due to short-term market pressures or corrections after a longer period of bullish behavior. Investors might view this as a potential buying opportunity if they believe the longer-term bullish trend will resume, or as a signal for caution if the downward pressure continues.
Recent Ratings
| Date | Status | Outer | Rating | Price |
|---|---|---|---|---|
| 2025-10-08 00:00:00 | Initiated | Barclays | Equal Weight | $49 |
| 2025-08-21 00:00:00 | Initiated | Northcoast | Neutral | |
| 2025-08-07 00:00:00 | Upgrade | Robert W. Baird | Neutral → Outperform | $55 |
| 2025-04-03 00:00:00 | Upgrade | Wolfe Research | Underperform → Peer Perform |
Monster Beverage Corp (MNST) (-3.55%)
Recent News (Last 24 Hours)
PepsiCo’s stock experienced a notable increase of 3.7% following the release of its third-quarter earnings. This surge prompts a critical examination of whether the rally is justified based on the fundamentals disclosed in the earnings report or if it might be an overreaction by the market. Investors and analysts will likely scrutinize the underlying financial health and future outlook provided by PepsiCo to determine if the current stock price accurately reflects its market value and growth potential.
Companies with strong cash positions are often considered more resilient and capable of funding growth opportunities without the need to incur debt. This financial stability may make them attractive investment opportunities, especially in uncertain economic times. The impact of these factors on stock performance and investor sentiment will be crucial for market participants tracking both short-term movements and long-term trends.
Technical Analysis
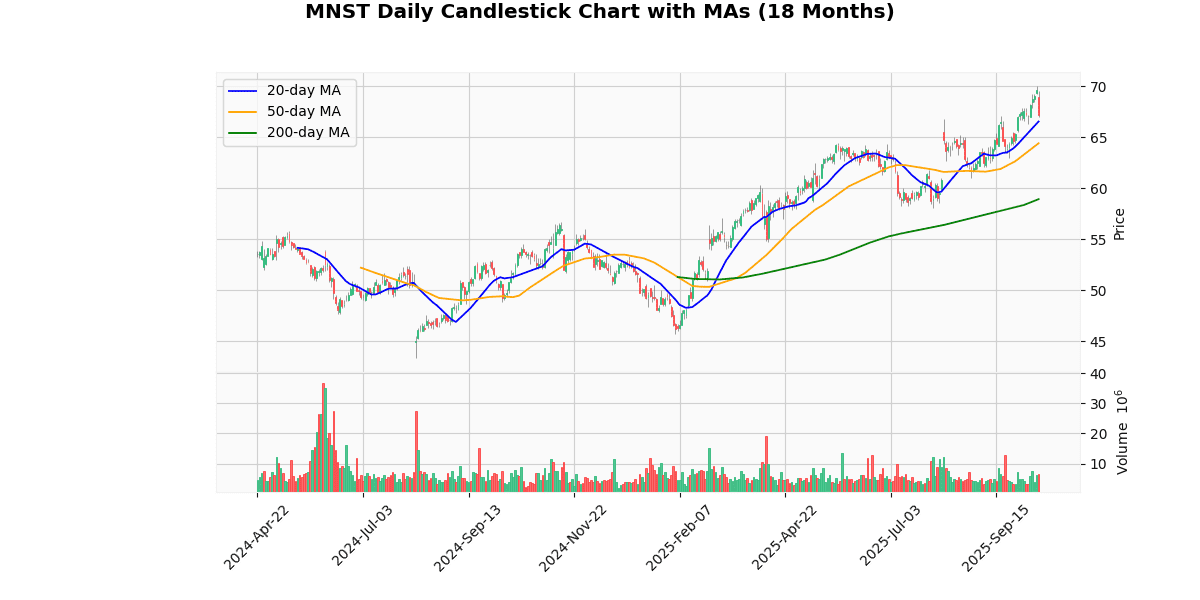
The current price of the asset at $67.15 indicates a bullish trend when analyzed against its moving averages (MAs). The price is positioned above the 20-day MA of $66.55, the 50-day MA of $64.41, and significantly above the 200-day MA of $58.93. This positioning suggests a strong upward momentum in the short-term, as the asset is trading above both recent and longer-term average prices.
The gap between the current price and the 200-day MA is particularly notable, highlighting a robust longer-term uptrend. Investors might view this as a confirmation of sustained positive sentiment and a potential continuation of the upward movement. However, traders should monitor for any signs of overextension or potential pullbacks, given the relatively steep rise compared to the 200-day average, which could indicate overheating in the market.
Recent Ratings
| Date | Status | Outer | Rating | Price |
|---|---|---|---|---|
| 2025-10-10 00:00:00 | Reiterated | RBC Capital Mkts | Outperform | $68 → $75 |
| 2025-10-08 00:00:00 | Reiterated | UBS | Neutral | $67 → $72 |
| 2025-09-16 00:00:00 | Reiterated | Citigroup | Buy | $74 → $76 |
| 2025-08-13 00:00:00 | Reiterated | Roth Capital | Neutral | $56 → $60 |
Trade Desk Inc (TTD) (-2.07%)
Technical Analysis
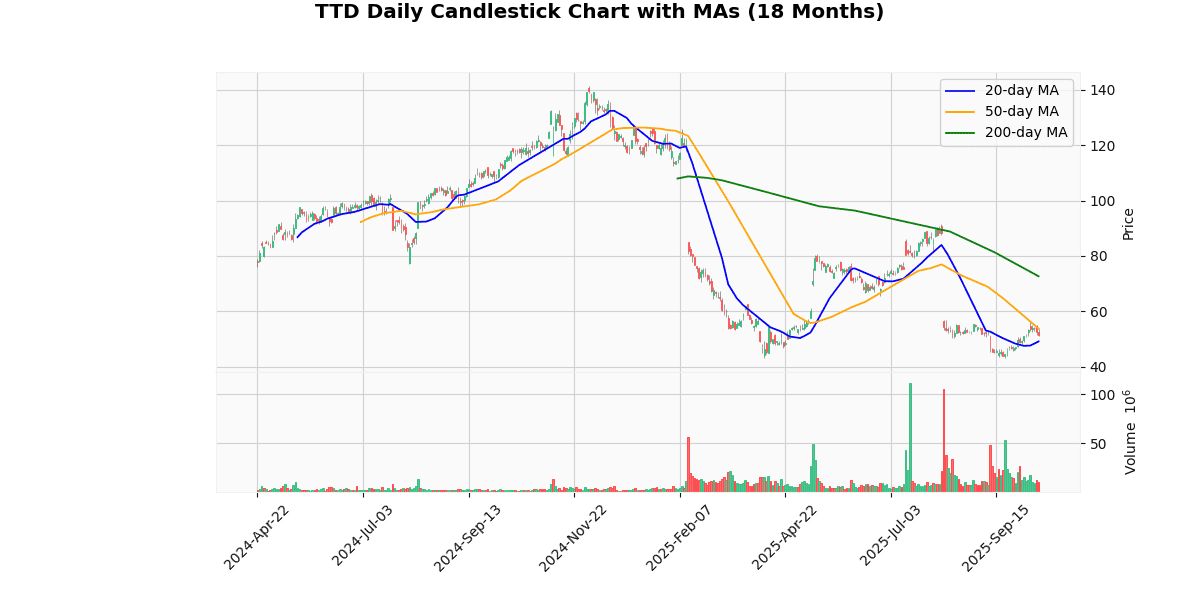
The current price of the asset at $51.28 reflects a recent uptick as it surpasses the 20-day moving average (MA20) of $49.06, suggesting a short-term bullish momentum. However, the price remains below the 50-day moving average (MA50) of $53.72 and significantly below the 200-day moving average (MA200) of $72.62, indicating a longer-term bearish trend. The positioning below the MA50 and MA200 suggests that despite recent gains, the asset is still facing substantial overhead resistance. The substantial gap between the MA200 and the current price highlights a pronounced bearish sentiment over the medium to long term. Investors might view the recent price increase as a corrective rally within a broader downtrend, unless further price action consistently closes above these key moving averages.
Recent Ratings
| Date | Status | Outer | Rating | Price |
|---|---|---|---|---|
| 2025-10-06 00:00:00 | Reiterated | Wells Fargo | Equal Weight | $68 → $53 |
| 2025-09-10 00:00:00 | Downgrade | Morgan Stanley | Overweight → Equal-Weight | $50 |
| 2025-08-11 00:00:00 | Downgrade | Jefferies | Buy → Hold | $50 |
| 2025-08-11 00:00:00 | Downgrade | HSBC Securities | Buy → Hold | $56 |
T-Mobile US Inc (TMUS) (-1.63%)
Recent News (Last 24 Hours)
ABB has announced the sale of its robotics division to a private equity firm for $5.4 billion, a strategic move that could significantly reshape its business focus and financial structure. This divestiture, reported on October 13, 2025, is part of ABB’s ongoing efforts to streamline its operations and concentrate on higher growth areas. The sale price suggests a robust valuation, reflecting the strong demand and potential growth prospects within the robotics industry.
From a financial perspective, this transaction is likely to bolster ABB’s balance sheet by providing substantial liquidity, which could be used to reduce debt, return capital to shareholders, or invest in core areas with higher growth potential. Investors should monitor how ABB plans to allocate the proceeds from this sale, as it could influence the company’s future growth trajectory and profitability. Additionally, the market’s reaction to this news will be crucial in determining the short-term impact on ABB’s stock price.
Technical Analysis
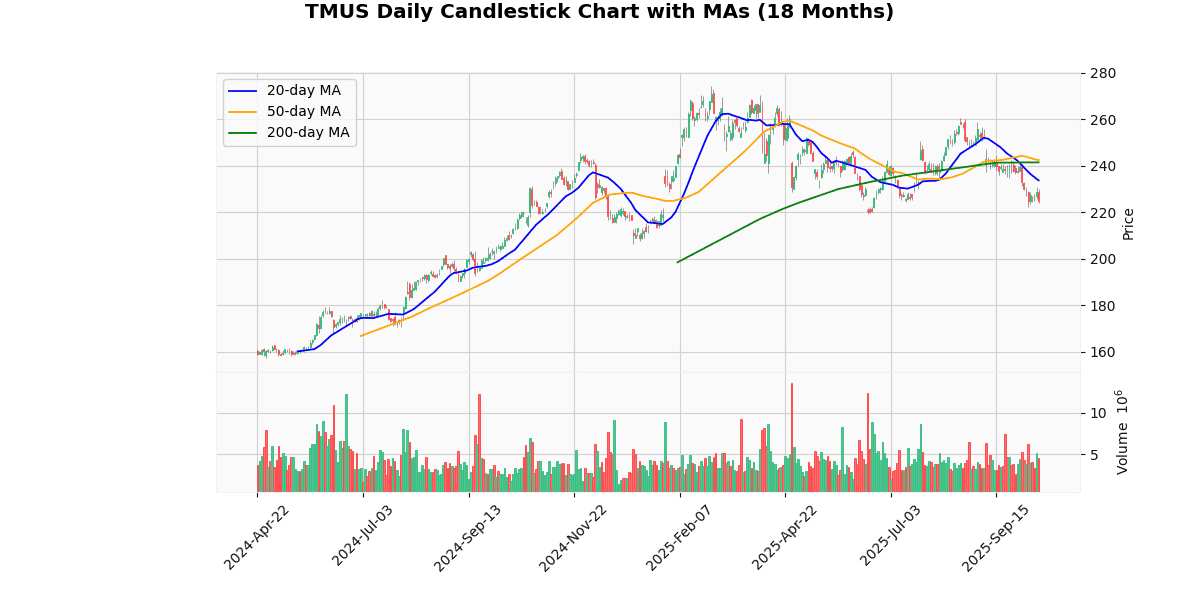
The current price of the asset at $225.06 indicates a bearish trend as it is positioned below all key moving averages: the 20-day MA at $233.76, the 50-day MA at $242.48, and the 200-day MA at $241.54. This alignment suggests that the asset has been experiencing a consistent downward trajectory in the short to medium term. The price being below the 20-day MA highlights recent negative momentum, while its position under the 50-day and 200-day MAs confirms a broader bearish sentiment among investors. This could imply potential resistance levels near the moving averages if a recovery were to occur. Investors might view these MAs as critical thresholds that the asset needs to surpass to shift sentiment to bullish. Overall, the market positioning indicates a cautious or bearish outlook in the near term.
Recent Ratings
| Date | Status | Outer | Rating | Price |
|---|---|---|---|---|
| 2025-09-02 00:00:00 | Resumed | Goldman | Buy | $286 |
| 2025-07-09 00:00:00 | Downgrade | KeyBanc Capital Markets | Sector Weight → Underweight | $200 |
| 2025-07-07 00:00:00 | Upgrade | Rothschild & Co Redburn | Sell → Neutral | $228 |
| 2025-07-07 00:00:00 | Resumed | BofA Securities | Neutral | $255 |
PayPal Holdings Inc (PYPL) (-1.36%)
Recent News (Last 24 Hours)
PayPal Holdings Inc. (NASDAQ: PYPL) faces a challenging outlook as Goldman Sachs downgraded the stock to ‘Sell’ from ‘Neutral’, citing increased margin pressures and a tougher operational environment. This adjustment was highlighted in multiple reports from Barrons.com and Investor’s Business Daily, reflecting a consensus on the financial headwinds facing the company. The downgrade is significant as it suggests a bearish outlook from one of the leading financial institutions, potentially influencing investor sentiment and stock performance negatively.
Concurrently, PayPal has been proactive, unveiling a new Ads Manager aimed at democratizing retail media for small businesses, as reported by Insider Monkey. This move could be seen as an effort to diversify revenue streams and enhance value propositions for smaller enterprises, which might offset some of the negative impacts from the broader financial challenges.
However, the overall sentiment from financial analysts seems mixed, as Zacks recently highlighted PayPal as a top value stock for the long-term, suggesting that the current dip might be viewed as a buying opportunity for long-term investors. This presents a nuanced picture where short-term challenges coexist with potential long-term strategic gains. The market’s reaction to these developments will be crucial in determining PayPal’s stock trajectory in the upcoming quarters.
Technical Analysis
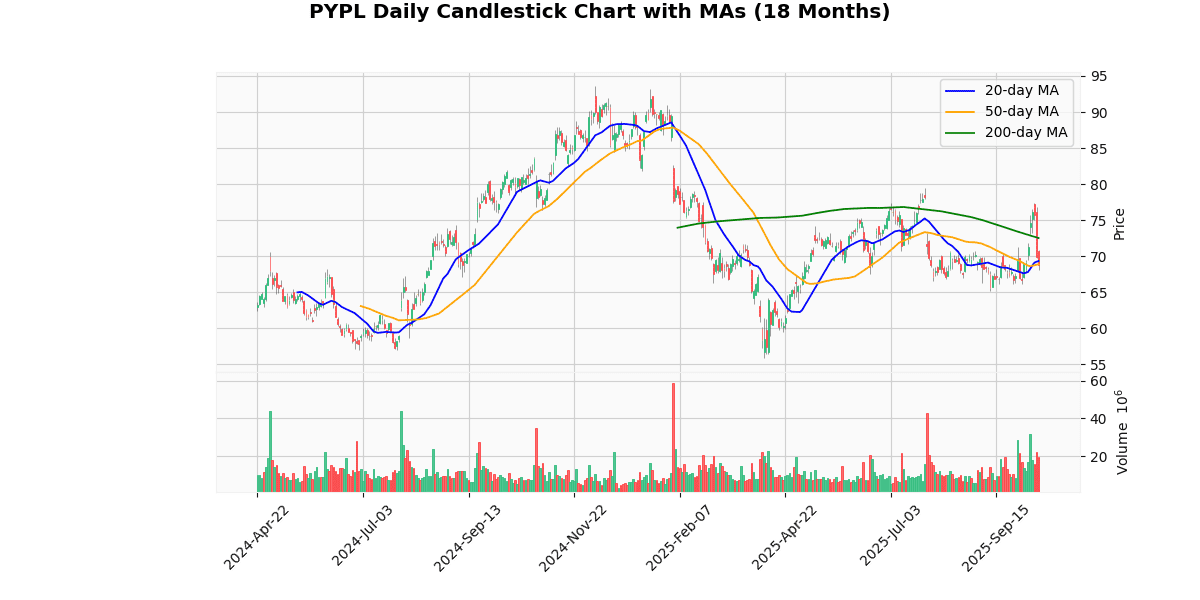
The current price of the asset at $68.86 shows a slight dip below both the 20-day moving average (MA20) of $69.36 and the 50-day moving average (MA50) of $68.90, indicating a short-term bearish sentiment. This positioning below the MA20 and MA50 suggests that the asset has been experiencing recent downward pressure. Moreover, the more significant deviation from the 200-day moving average (MA200) at $72.53 underscores a longer-term downtrend, reflecting a broader bearish outlook over the past months. This could potentially signal a consolidation phase or a continued bearish trend if not countered by significant positive market catalysts. Investors might view this as an opportunity to monitor for potential entry points if the asset shows signs of reversing these trends, but caution is advised given the prevailing downward momentum.
Recent Ratings
| Date | Status | Outer | Rating | Price |
|---|---|---|---|---|
| 2025-10-13 | Downgrade | Goldman | Neutral → Sell | $70 |
| 2025-10-03 00:00:00 | Downgrade | Wolfe Research | Outperform → Peer Perform | |
| 2025-07-17 00:00:00 | Resumed | Deutsche Bank | Hold | $75 |
| 2025-07-14 00:00:00 | Upgrade | Seaport Research Partners | Sell → Neutral |
Biogen Inc (BIIB) (-1.28%)
Technical Analysis
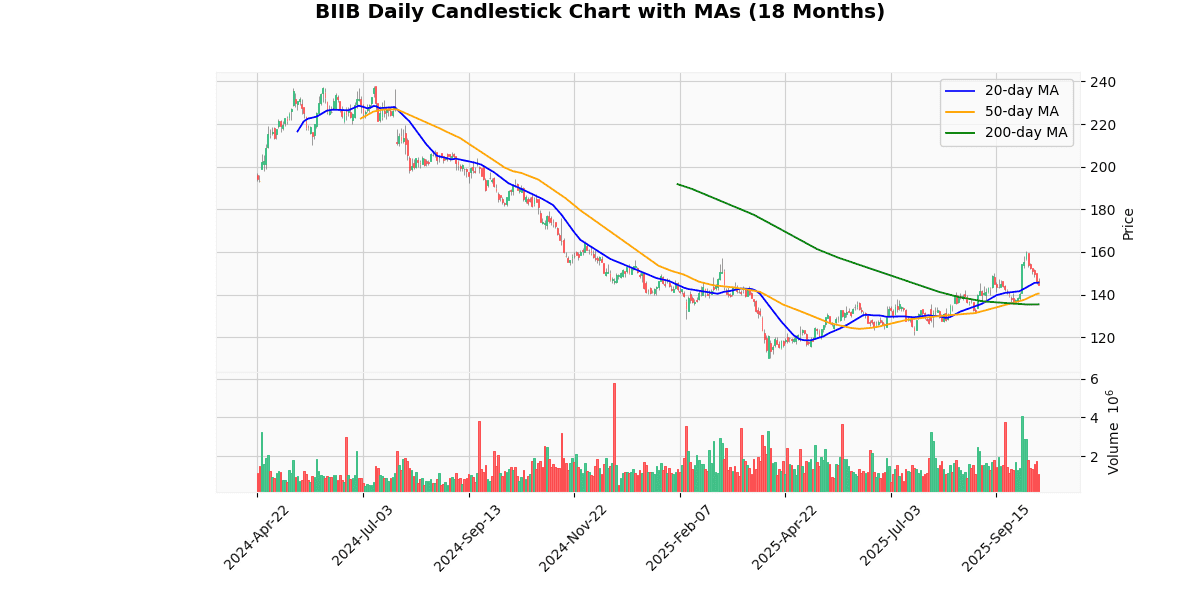
The current price of the asset at $144.69 shows a slight decline below the 20-day moving average (MA20) of $145.58, indicating a potential short-term bearish sentiment. However, when viewed against the longer-term moving averages, specifically the 50-day (MA50) at $140.46 and the 200-day (MA200) at $135.37, the price exhibits a bullish trend. The positioning above both the MA50 and MA200 suggests that despite recent minor pullbacks, the overall market sentiment over the medium to long term remains positive. The price being closer to the MA20 than the MA50 or MA200 also highlights that any downward pressure might be short-lived, with prevailing market trends favoring upward momentum. Investors might view these indicators as a sign of underlying strength, potentially reinforcing confidence in sustained growth.
Recent Ratings
| Date | Status | Outer | Rating | Price |
|---|---|---|---|---|
| 2025-09-25 00:00:00 | Initiated | Jefferies | Buy | $190 |
| 2025-07-21 00:00:00 | Resumed | Truist | Hold | $142 |
| 2025-04-28 00:00:00 | Downgrade | HSBC Securities | Buy → Hold | $118 |
| 2025-04-04 00:00:00 | Downgrade | Argus | Buy → Hold |
Regeneron Pharmaceuticals Inc (REGN) (-1.22%)
Recent News (Last 24 Hours)
Regeneron Pharmaceuticals, Inc. (REGN) recently disclosed two significant developments that could influence its stock performance. Firstly, the company announced promising results from its gene therapy research aimed at treating genetic hearing loss. This breakthrough could potentially open up a new market for Regeneron, enhancing its product pipeline and possibly leading to future revenue growth if the therapy progresses successfully through further clinical trials and regulatory approval processes.
Secondly, Regeneron is preparing to take an $83 million charge, which could impact its financials in the short term. This charge might raise concerns among investors regarding the company’s upcoming earnings report and could potentially affect its stock price negatively. However, the long-term outlook might remain strong if the gene therapy research continues to yield positive results.
Overall, while the charge presents a financial challenge, the advancement in gene therapy could bolster investor confidence in Regeneron’s innovative capabilities and long-term growth prospects. Investors should watch how these developments play out in influencing Regeneron’s market position and financial health.
Technical Analysis
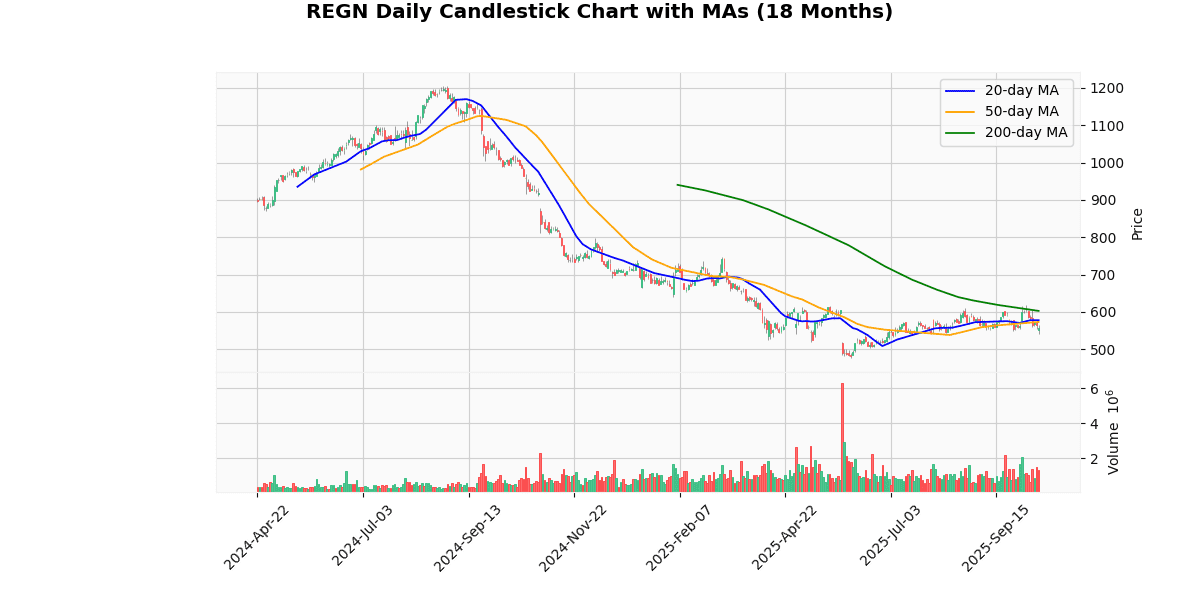
The current price of $557.73 indicates a bearish trend as it is positioned below all key moving averages: the 20-day MA at $577.95, the 50-day MA at $573.32, and significantly below the 200-day MA at $602.84. This downward positioning suggests that the asset is experiencing a sustained period of selling pressure. The fact that the shorter-term MAs (20-day and 50-day) are also below the longer-term 200-day MA further confirms the bearish momentum, indicating that recent prices are consistently lower than historical averages. Investors might view this as a negative signal, with potential for further declines unless there is a significant shift in market dynamics or external factors that could drive a positive revaluation. Caution is advised for those considering entry, as the current trends show no immediate signs of reversal.
Recent Ratings
| Date | Status | Outer | Rating | Price |
|---|---|---|---|---|
| 2025-08-14 00:00:00 | Initiated | Rothschild & Co Redburn | Buy | $890 |
| 2025-06-30 00:00:00 | Downgrade | Argus | Buy → Hold | |
| 2025-05-30 00:00:00 | Downgrade | Wells Fargo | Overweight → Equal Weight | $580 |
| 2025-05-30 00:00:00 | Downgrade | RBC Capital Mkts | Outperform → Sector Perform | $662 |
Xcel Energy Inc (XEL) (-0.95%)
Technical Analysis
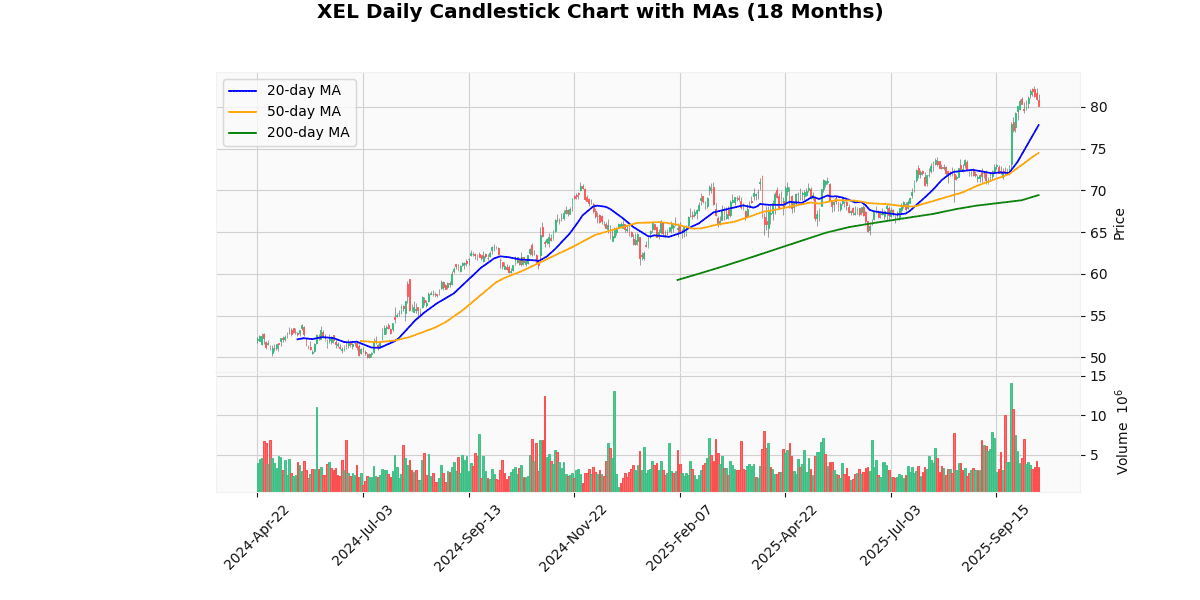
The current price of the asset at $80.16 reflects a bullish trend when analyzed against its moving averages (MAs). It is trading above the 20-day MA of $77.81, the 50-day MA of $74.48, and significantly surpassing the 200-day MA of $69.43. This positioning indicates a strong upward momentum in the short, medium, and long term, suggesting a robust buying interest in the market.
The consistent elevation of the current price above all key MAs typically signals a solid bullish sentiment among investors. The gap between the current price and the 200-day MA is particularly noteworthy, underscoring a potential long-term confidence in the asset’s value appreciation. Investors might consider this an opportune time to engage, anticipating further gains, provided other market conditions remain favorable.
Recent Ratings
| Date | Status | Outer | Rating | Price |
|---|---|---|---|---|
| 2025-10-07 00:00:00 | Initiated | Evercore ISI | Outperform | $92 |
| 2025-09-22 00:00:00 | Upgrade | BMO Capital Markets | Market Perform → Outperform | $80 |
| 2025-01-13 00:00:00 | Upgrade | Wells Fargo | Equal Weight → Overweight | $70 → $72 |
| 2024-12-12 00:00:00 | Upgrade | JP Morgan | Neutral → Overweight | $69 → $80 |
PepsiCo Inc (PEP) (-0.79%)
Recent News (Last 24 Hours)
On October 13, 2025, PepsiCo’s stock experienced a notable increase of 3.7% following the release of their Q3 earnings. This surge raises questions about whether the rally is justified based on the fundamentals or if it is potentially overextended. Investors and analysts will likely scrutinize the earnings details to determine the sustainability of PepsiCo’s current valuation.
In related industry news, Coca-Cola is implementing a new innovation strategy, also covered by Zacks, which could either enhance the company’s competitive edge or impose additional financial burdens. The outcome of this strategy could significantly impact Coca-Cola’s operational costs and market position, influencing investor sentiment and stock performance.
Additionally, CELH (Celsius Holdings Inc.) is reportedly seeing growth in its foodservice sector, suggesting potential for further expansion. This development could attract investor interest as it may indicate underlying strength in CELH’s business model and market expansion strategies.
Furthermore, Zacks recommended purchasing five low-beta, high-yielding stocks to mitigate the effects of recent market volatility, indicating a strategic move for investors seeking stability in a fluctuating market environment.
Technical Analysis
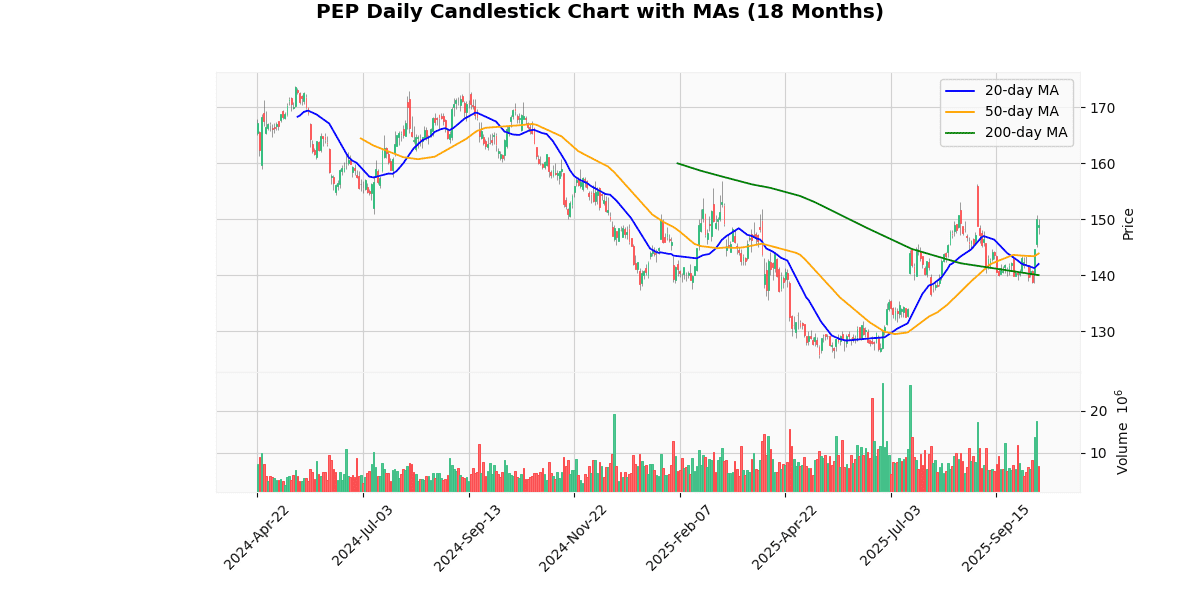
The current price of the asset at $148.89 indicates a bullish trend, as it is positioned above all key moving averages: the 20-day ($142.01), 50-day ($143.88), and 200-day ($140.01). This positioning suggests a strong upward momentum in the short, medium, and long term. The price exceeding the 20-day moving average by a significant margin highlights recent positive sentiment among investors, potentially driven by favorable market news or strong financial performance. The gap between the current price and the 200-day moving average further underscores a robust bullish outlook over a longer period. Investors might view these indicators as a confirmation of a sustained uptrend, possibly influencing further buying activity. However, vigilance is advised as such upward trends can invite corrective pullbacks, especially if driven by speculative trading.
Recent Ratings
| Date | Status | Outer | Rating | Price |
|---|---|---|---|---|
| 2025-04-15 00:00:00 | Downgrade | BofA Securities | Buy → Neutral | $155 |
| 2025-03-18 00:00:00 | Downgrade | Barclays | Overweight → Equal Weight | $168 → $156 |
| 2025-03-12 00:00:00 | Downgrade | Jefferies | Buy → Hold | $171 → $170 |
| 2025-01-07 00:00:00 | Initiated | Piper Sandler | Overweight | $171 |
Cisco Systems Inc (CSCO) (-0.71%)
Recent News (Last 24 Hours)
Recent financial news highlights several key developments that could influence stock market dynamics.
In related news, Cisco has been spotlighted for its strategic enhancements to the Webex platform, integrating AI to improve customer experiences and expand globally. This move, reported by Insider Monkey, positions Cisco favorably as it capitalizes on the burgeoning AI market, potentially offsetting some concerns about overvaluation in the sector (Insider Monkey, 2025-10-13).
These developments suggest a nuanced market landscape where AI’s role is both a driver of growth and a point of caution for investment strategies.
Technical Analysis
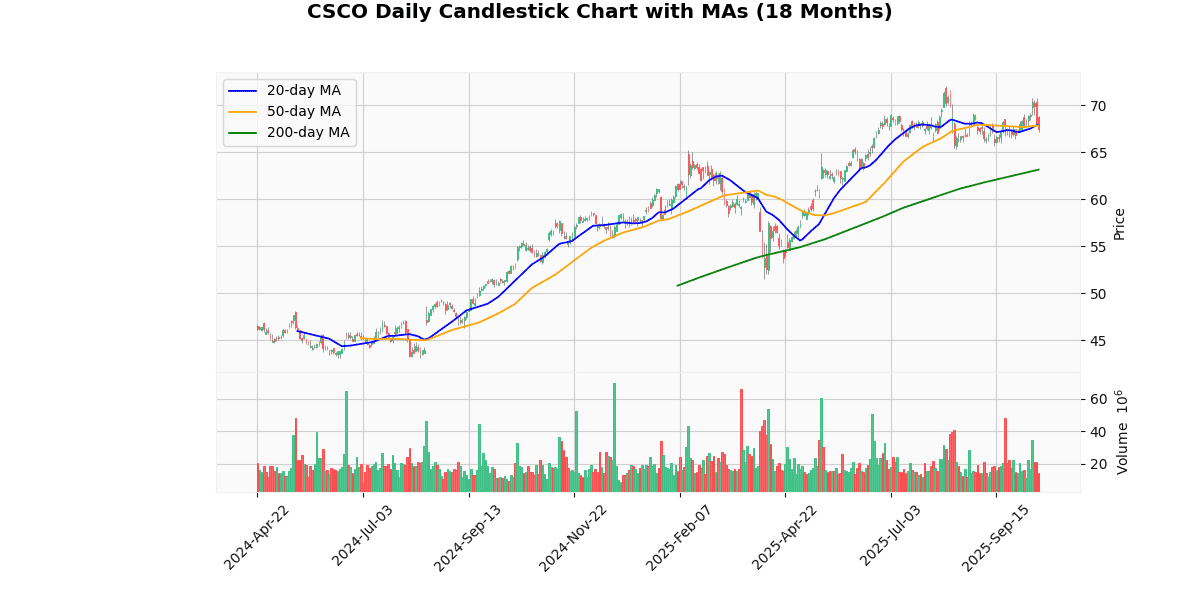
The current price of the asset stands at $67.46, exhibiting a slight decline when compared to both the 20-day and 50-day moving averages (MAs), which are positioned at $67.93 and $67.86, respectively. This indicates a short-term downward trend as the price is currently trading below the more recent averages. However, a broader perspective provided by the 200-day MA, which is significantly lower at $63.16, suggests that the longer-term trend remains bullish. The price being above the 200-day MA highlights underlying strength in the longer-term market sentiment, despite recent pullbacks. Investors might view the recent dip as a minor correction within a generally upward-trending market. This setup could potentially offer a buying opportunity if the price stabilizes or rebounds, assuming the long-term bullish trend persists.
Recent Ratings
| Date | Status | Outer | Rating | Price |
|---|---|---|---|---|
| 2025-08-15 00:00:00 | Downgrade | HSBC Securities | Buy → Hold | $69 |
| 2025-07-28 00:00:00 | Downgrade | Evercore ISI | Outperform → In-line | $72 |
| 2025-07-08 00:00:00 | Initiated | Wolfe Research | Peer Perform | |
| 2025-06-26 00:00:00 | Initiated | KeyBanc Capital Markets | Overweight | $77 |
Disclaimer
The content on MarketsFN.com is provided for educational and informational purposes only. It does not constitute financial advice, investment recommendations, or trading guidance. All investments involve risks, and past performance does not guarantee future results. You are solely responsible for your investment decisions and should conduct independent research and consult a qualified financial advisor before acting. MarketsFN.com and its authors are not liable for any losses or damages arising from your use of this information.


