Top 10 Performers
Advanced Micro Devices Inc (AMD) (9.40%)
Recent News (Last 24 Hours)
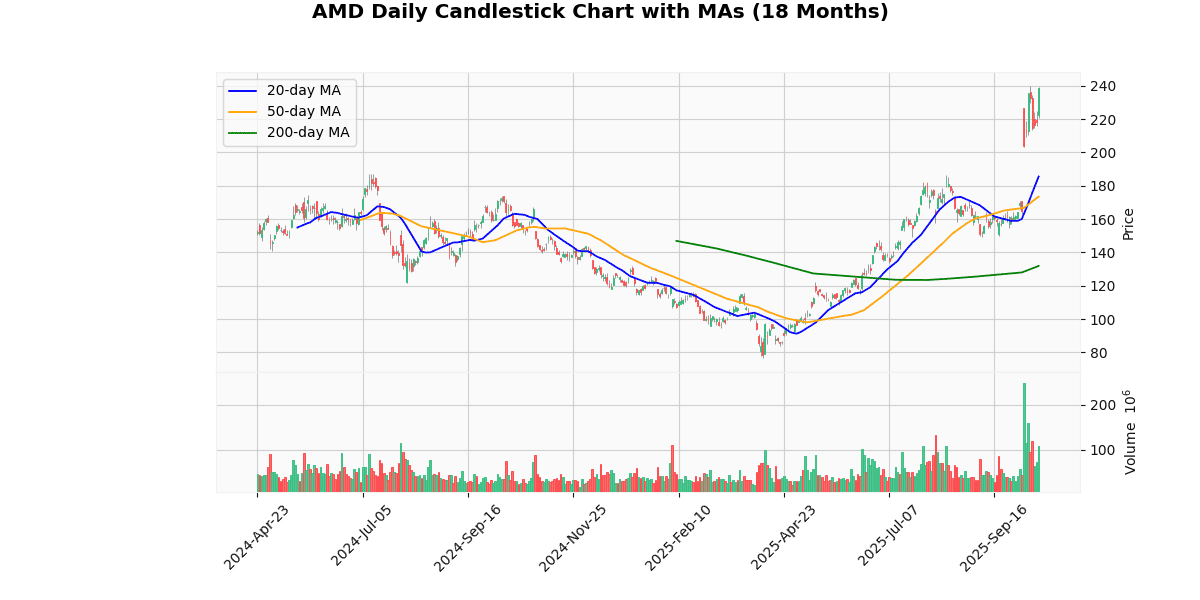
Advanced Micro Devices (AMD) experienced a significant surge in its stock price, climbing 9.4% as reported on October 15, 2025. This notable increase is attributed to several strategic developments and market dynamics that have favorably impacted investor sentiment towards AMD. Key among these is AMD’s expanded partnership with Oracle, involving the supply of 50,000 MI450 GPUs for Oracle’s next-generation AI supercluster, signaling robust demand for AMD’s AI chips and reinforcing its competitive position in the high-growth AI market.
Additionally, AMD’s involvement in high-profile deals with OpenAI further underscores its strategic alignment with leading AI initiatives, which is likely to enhance its market share and revenue prospects in the burgeoning AI sector. Analysts have pointed to AMD’s AI chip business as ‘underestimated,’ suggesting potential for significant growth that has not been fully priced into the stock until now.
The broader market context also supports AMD’s rally, with chip stocks showing overall strength on the same day, indicating a favorable industry environment. This collective momentum, coupled with specific positive developments for AMD, presents a compelling case for its stock’s performance. Investors and analysts will likely continue to monitor AMD’s execution on these partnerships and its ability to capitalize on the expanding AI technology landscape, which could drive further valuation adjustments.
Technical Analysis
The current price of the asset at $238.6 indicates a robust upward trend, significantly outpacing its 20-day, 50-day, and 200-day moving averages (MAs) of $185.54, $173.52, and $131.94, respectively. This substantial premium over all three MAs suggests strong bullish momentum in the short, medium, and long term. The steep gradient between the MAs, with each longer-term average considerably lower than the shorter-term ones, further underscores this momentum. The positioning well above the 200-day MA highlights a solid investor confidence and a potential shift in market sentiment towards more optimistic expectations. Traders might view these indicators as a sign of sustained upward pressure, though caution is warranted as such sharp inclines could also lead to volatility or corrective pullbacks as the market seeks equilibrium.
Recent Ratings
| Date | Status | Outer | Rating | Price |
|---|---|---|---|---|
| 2025-10-14 00:00:00 | Upgrade | Wolfe Research | Peer Perform → Outperform | $300 |
| 2025-10-13 00:00:00 | Reiterated | Mizuho | Outperform | $205 → $275 |
| 2025-10-08 00:00:00 | Upgrade | DZ Bank | Hold → Buy | $250 |
| 2025-10-07 00:00:00 | Upgrade | Jefferies | Hold → Buy | $300 |
KLA Corp (KLAC) (5.98%)
Technical Analysis
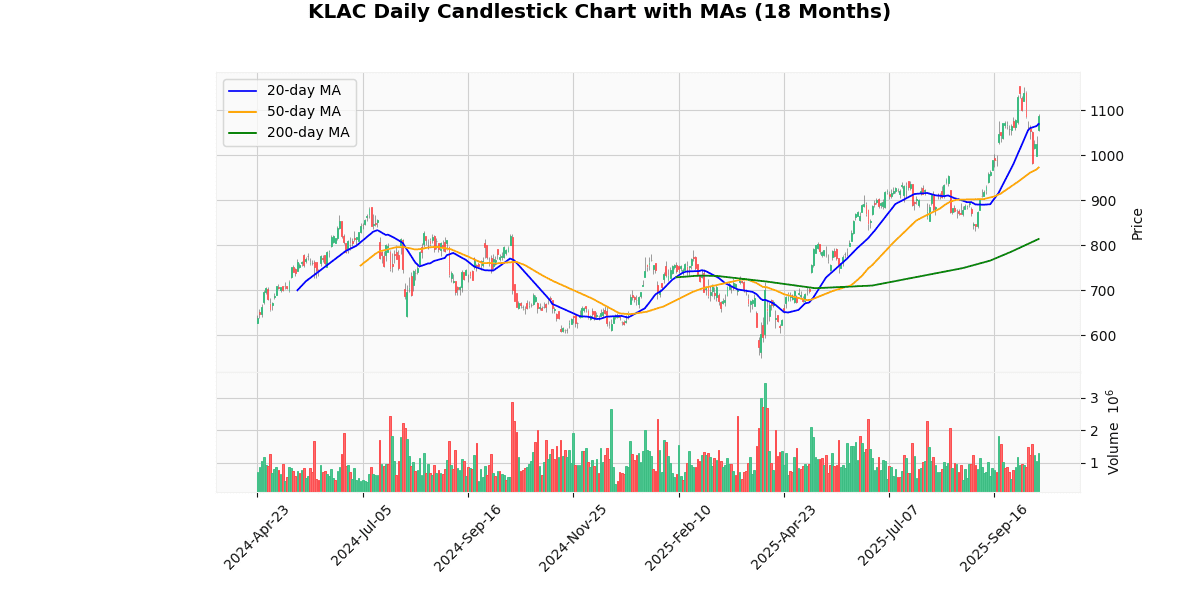
The current price of the asset at $1087.01 reflects a robust upward trend when analyzed against its moving averages (MA) across different time frames. The 20-day MA at $1069.97 indicates a strong short-term bullish momentum, as the current price is positioned above this level. This is further underscored by the 50-day MA at $972.96 and the 200-day MA at $814.11, both significantly lower than the current price, suggesting a sustained positive trajectory over the medium to long term.
The substantial gap between the 200-day MA and the current price highlights a potentially overextended market, which might caution investors about the sustainability of the current price level without a corrective pullback. However, the consistent elevation above all three key MAs generally signals a solid bullish stance in the market, attracting continued investor interest.
Recent Ratings
| Date | Status | Outer | Rating | Price |
|---|---|---|---|---|
| 2025-09-22 00:00:00 | Downgrade | Morgan Stanley | Overweight → Equal-Weight | $1093 |
| 2025-08-01 00:00:00 | Reiterated | TD Cowen | Hold | $800 → $900 |
| 2025-07-10 00:00:00 | Initiated | Goldman | Neutral | $980 |
| 2025-07-08 00:00:00 | Downgrade | Wells Fargo | Overweight → Equal Weight | $920 |
Lam Research Corp (LRCX) (4.68%)
Recent News (Last 24 Hours)
Lam Research Corporation (LRCX) has been in the spotlight recently with significant developments that could impact its stock performance. Firstly, the company’s stock is currently on an upward trajectory, as highlighted in a recent report from StockStory. This positive movement in stock price suggests increasing investor confidence potentially driven by anticipated strong financial performance or strategic corporate developments.
Further, a new analyst rating from HSBC has given LRCX a “Hold” rating. This rating indicates a neutral outlook on the stock, suggesting that the stock is fairly valued at its current price, considering expected future earnings and market conditions. Investors might interpret this as a signal to maintain their positions, expecting stability rather than significant growth or decline.
Additionally, a report from Zacks anticipates earnings growth for Lam Research ahead of its next week’s earnings release. This expected growth could be a critical factor for the stock, as earnings performance often drives market sentiment and stock prices. If the actual earnings align with or exceed the expectations, it could further bolster investor confidence and positively impact the stock price.
Overall, these developments suggest a cautiously optimistic outlook for LRCX, with potential for growth based on upcoming earnings, balanced by a current analyst perspective of market-value alignment. Investors should closely monitor the forthcoming earnings announcement for potential shifts in stock valuation.
Technical Analysis
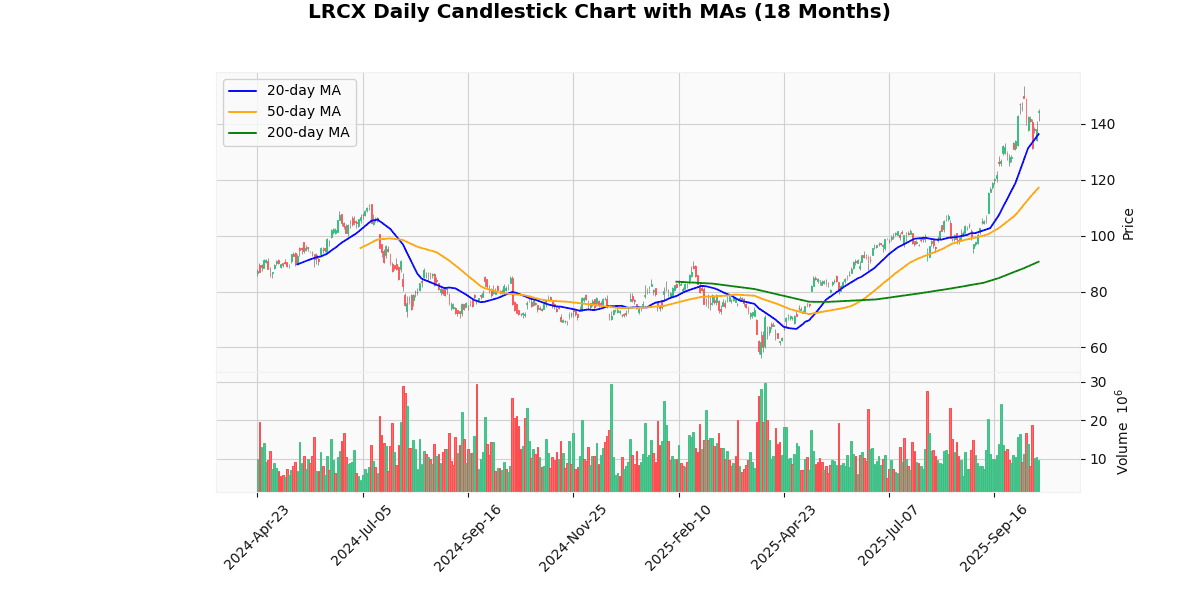
The analysis of the provided price metrics reveals a bullish trend in the asset’s performance. The current price of $144.78 significantly exceeds all three key moving averages: 20-day MA at $136.35, 50-day MA at $117.17, and 200-day MA at $90.67. This indicates a strong upward momentum and positive investor sentiment over both short and long-term periods. The substantial gap between the current price and the 200-day MA highlights robust gains over a longer horizon, suggesting sustained investor confidence and potential underestimation of the asset’s earlier valuations. The consistent increase across these moving averages could attract more buying interest, potentially driving the price further up unless external market factors intervene. Investors should monitor for any signs of reversal, but the current trend points towards continued bullish behavior.
Recent Ratings
| Date | Status | Outer | Rating | Price |
|---|---|---|---|---|
| 2025-09-30 00:00:00 | Initiated | HSBC Securities | Hold | $127 |
| 2025-09-29 00:00:00 | Upgrade | Deutsche Bank | Hold → Buy | $150 |
| 2025-09-23 00:00:00 | Downgrade | KeyBanc Capital Markets | Overweight → Sector Weight | |
| 2025-09-22 00:00:00 | Upgrade | Morgan Stanley | Underweight → Equal-Weight | $125 |
Applied Materials Inc (AMAT) (4.30%)
Recent News (Last 24 Hours)
Applied Materials (AMAT) has experienced significant positive sentiment in the financial markets as evidenced by recent analyst actions. On October 15, 2025, Bank of America upgraded AMAT stock to a “Buy” rating, setting a price target of $250, primarily due to the strength in the DRAM sector. This upgrade suggests a bullish outlook on the company’s performance in the semiconductor equipment market, particularly in memory products which are critical for various technology applications.
Additionally, on the same day, Bernstein reaffirmed its “Outperform” rating on AMAT. This continued endorsement from a reputable analytical firm further solidifies the market’s confidence in Applied Materials’ operational stability and growth prospects.
These analyst upgrades are likely to influence investor sentiment positively, potentially leading to an increase in stock price and trading volume. Investors will be closely monitoring AMAT’s performance in the DRAM sector, as success in this area could significantly impact future earnings and market share.
Technical Analysis
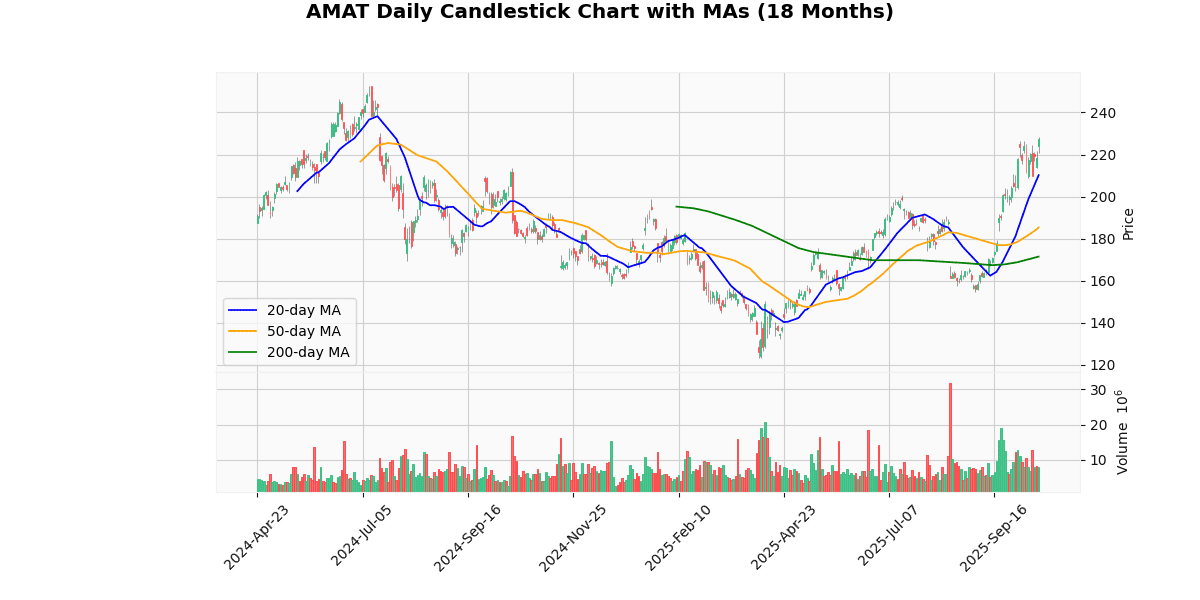
The current price of the asset at $227.58 shows a robust upward trend when compared to its moving averages: 20-day MA at $210.16, 50-day MA at $185.34, and 200-day MA at $171.45. This indicates a strong bullish momentum in the short, medium, and long term. The significant gap between the current price and all three moving averages suggests that the asset has been consistently outperforming historical averages, possibly driven by positive market sentiment or fundamental developments. The ascending order of the moving averages further reinforces the bullish trend, with the short-term gains outpacing the longer-term averages, which could attract more buyers into the market. Investors might view these indicators as a potential for continued upward movement, though caution should be advised as the market might also adjust for overvaluation.
Recent Ratings
| Date | Status | Outer | Rating | Price |
|---|---|---|---|---|
| 2025-10-13 00:00:00 | Upgrade | BofA Securities | Neutral → Buy | $250 |
| 2025-09-22 00:00:00 | Upgrade | Morgan Stanley | Equal-Weight → Overweight | $209 |
| 2025-09-12 00:00:00 | Downgrade | Mizuho | Outperform → Neutral | $175 |
| 2025-08-20 00:00:00 | Downgrade | Daiwa Securities | Outperform → Neutral | $170 |
Intel Corp (INTC) (4.27%)
Recent News (Last 24 Hours)
In recent financial news, Intel Corporation (INTC) has been a focal point due to several developments. The company’s unveiling of a new AI chip aimed at competing with AMD has led to a positive uptick in its stock price, as reported by GuruFocus.com. However, this surge in market cap, which increased by $80 billion, prompted Bank of America to downgrade Intel’s stock to ‘Underperform,’ citing concerns over the rapid valuation increase as potentially unsustainable (Insider Monkey).
These developments come at a time when the semiconductor industry is seeing heightened interest due to the increasing importance of AI technologies. ASML, another key player in the semiconductor sector, reported strong orders amid an AI spending frenzy, despite missing revenue expectations (The Wall Street Journal). This suggests a robust demand environment for semiconductor-related products, which could benefit companies like Intel if they continue to innovate and execute effectively.
Overall, Intel’s strategic moves in the AI and semiconductor spaces appear poised to influence its stock performance, contingent on the company’s ability to capitalize on these opportunities and manage market expectations.
Technical Analysis
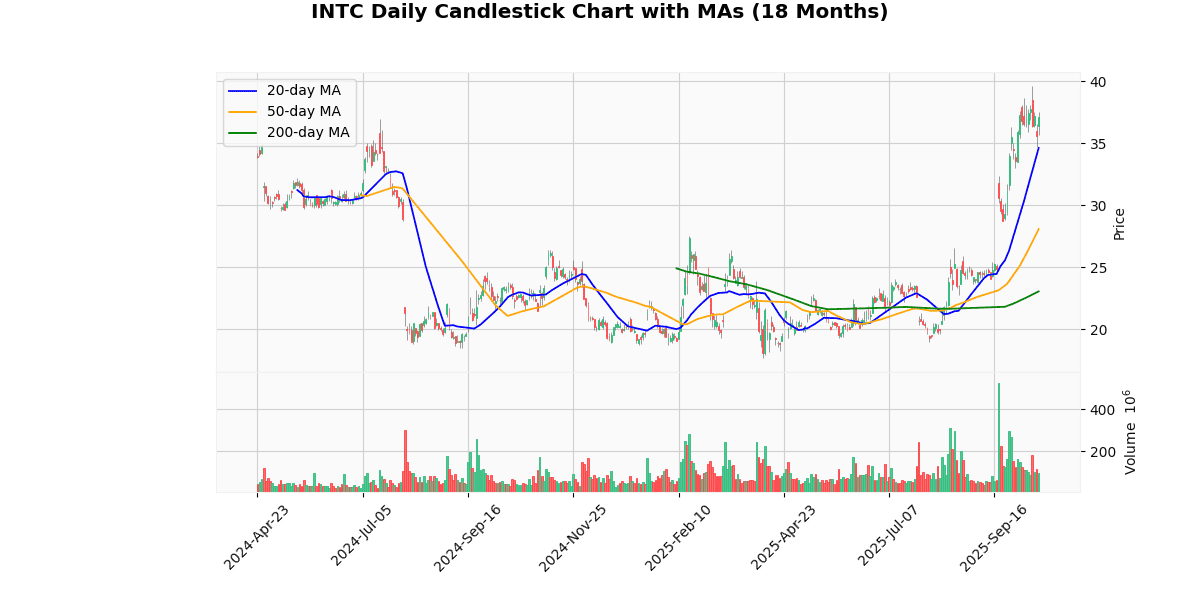
The current price of the asset at $37.15 indicates a robust upward trend when compared to its moving averages: 20-day MA at $34.62, 50-day MA at $28.08, and 200-day MA at $23.07. This pattern suggests a strong bullish momentum as the price is consistently higher than all key moving averages, which are also in ascending order from the 200-day to the 20-day MA. Such alignment typically reinforces positive market sentiment and could attract further buying interest. The significant gap between the current price and the longer-term 200-day MA highlights the rapid appreciation in value over recent months, potentially signaling over-extension and the possibility of a corrective pullback. However, the sustained elevation above the shorter-term 20-day MA indicates ongoing immediate-term strength. Investors should monitor for any signs of reversal but may find continued upward movement in the near term.
Recent Ratings
| Date | Status | Outer | Rating | Price |
|---|---|---|---|---|
| 2025-10-13 00:00:00 | Downgrade | BofA Securities | Neutral → Underperform | $34 |
| 2025-10-08 00:00:00 | Downgrade | HSBC Securities | Hold → Reduce | $24 |
| 2025-09-25 00:00:00 | Upgrade | Seaport Research Partners | Sell → Neutral | |
| 2025-09-22 00:00:00 | Upgrade | Erste Group | Sell → Hold |
Constellation Energy Corporation (CEG) (3.69%)
Recent News (Last 24 Hours)
In recent financial news, the stock market has shown varied responses to different sector developments. Notably, nuclear stocks such as NuScale and Oklo exhibited mixed trading patterns following an announcement by the Army, as reported by Barrons.com. This sector-specific news could influence investor sentiment towards these companies, potentially affecting their stock performance in the near term.
Technical Analysis
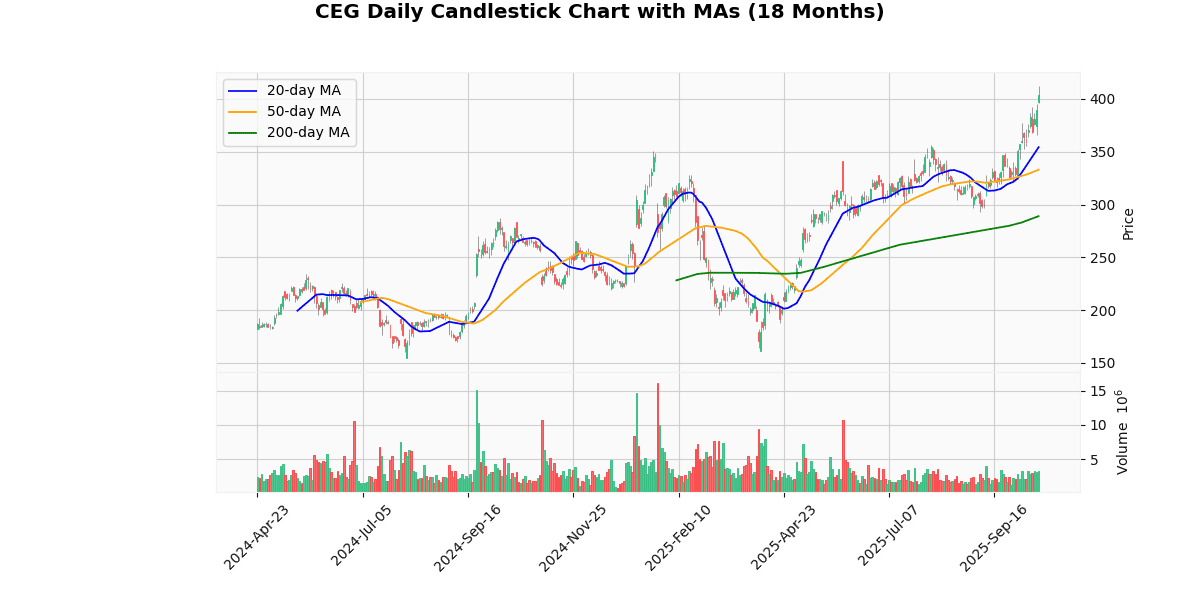
The current price of the asset at $403.95 indicates a strong upward trend when compared to its moving averages: 20-day MA at $354.26, 50-day MA at $332.97, and 200-day MA at $288.99. This positioning above all key moving averages suggests robust bullish momentum in the short, medium, and long term. The significant gap between the current price and the 200-day MA highlights a potentially overheated market, suggesting that the price has appreciated rapidly over a relatively short period. Investors might view this as a strength in the current market sentiment, driving further interest and investment. However, the steep rise could also raise concerns about sustainability and the possibility of a corrective pullback if the asset is perceived as overvalued. Overall, the market positioning indicates strong buyer confidence, but caution is advised considering the extended distance from long-term averages.
Recent Ratings
| Date | Status | Outer | Rating | Price |
|---|---|---|---|---|
| 2025-10-08 00:00:00 | Upgrade | Seaport Research Partners | Neutral → Buy | $407 |
| 2025-09-22 00:00:00 | Initiated | Scotiabank | Sector Outperform | $401 |
| 2025-08-20 00:00:00 | Initiated | Melius | Buy | $462 |
| 2025-06-13 00:00:00 | Initiated | Raymond James | Outperform | $326 |
Marvell Technology Inc (MRVL) (3.10%)
Recent News (Last 24 Hours)
In recent financial news, Marvell Technology, Inc. (MRVL) has been highlighted as a noteworthy stock in the semiconductor sector. Stifel has increased its price target for Marvell while maintaining a “Buy” rating, signaling confidence in the company’s growth prospects and operational performance. This adjustment could potentially enhance investor sentiment and influence Marvell’s stock price positively.
Overall, these reports could contribute to increased investor interest in Marvell, potentially leading to stock price appreciation as market perceptions align with the positive outlook presented by analysts and financial news sources.
Technical Analysis
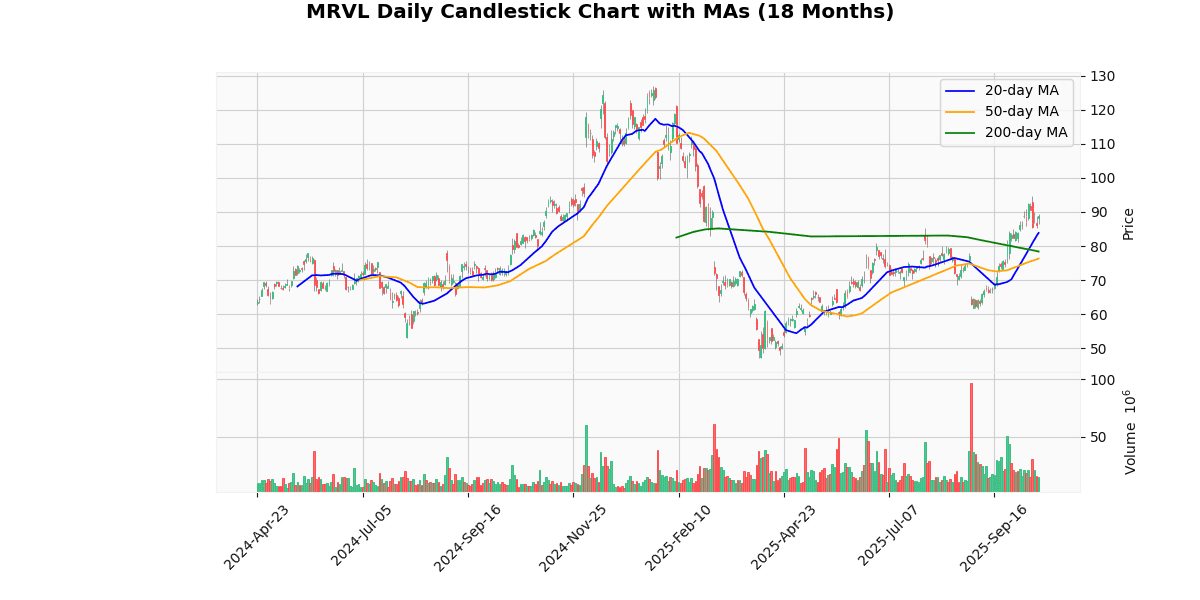
The current price of the asset at $88.89 indicates a robust upward trend when compared to its moving averages (MAs). Specifically, the price is significantly above the 20-day MA of $83.84, the 50-day MA of $76.31, and the 200-day MA of $78.38. This positioning above all key MAs suggests strong bullish momentum in the short, medium, and long term. The substantial gap between the current price and the 50-day and 200-day MAs further underscores a solid uptrend, possibly driven by positive market sentiment or favorable fundamental developments. Investors might view these indicators as a confirmation of a continuing upward trajectory, potentially leading to increased buying pressure. However, vigilance is advised as the asset could be approaching overbought territory, increasing the risk of a corrective pullback.
Recent Ratings
| Date | Status | Outer | Rating | Price |
|---|---|---|---|---|
| 2025-10-01 00:00:00 | Downgrade | TD Cowen | Buy → Hold | $85 |
| 2025-08-29 00:00:00 | Reiterated | Needham | Buy | $85 → $80 |
| 2025-08-29 00:00:00 | Downgrade | BofA Securities | Buy → Neutral | $78 |
| 2025-07-10 00:00:00 | Initiated | Goldman | Neutral | $75 |
Thomson-Reuters Corp (TRI) (2.99%)
Technical Analysis
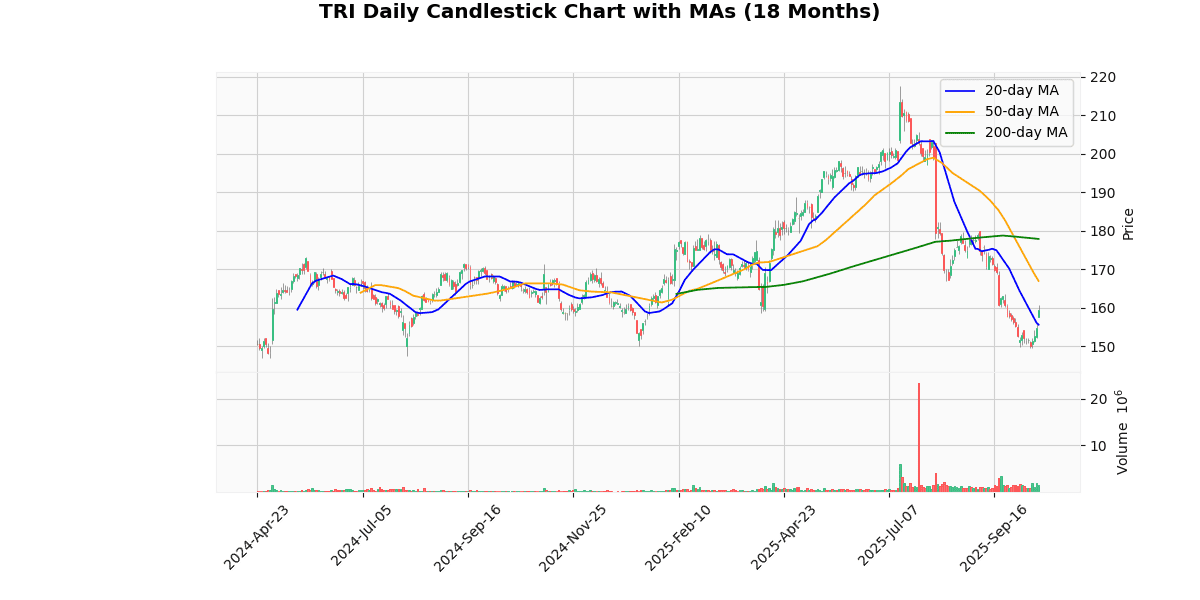
The current price of the asset, at $159.30, indicates a short-term uptrend as it is positioned above the 20-day moving average (MA20) of $155.58, suggesting recent bullish behavior. However, the price remains below both the 50-day and 200-day moving averages, at $166.95 and $177.85 respectively, signaling a broader bearish trend over the medium to long term. This discrepancy between the short-term gains and the longer-term downward trend could imply potential resistance near the higher moving averages. Investors might view the current price level as a consolidation point, with the MA50 and MA200 acting as key thresholds for future price movements. Overall, the asset appears to be in a corrective phase within a larger bearish context, warranting cautious optimism for short-term traders and potential reevaluation for long-term holders.
Recent Ratings
| Date | Status | Outer | Rating | Price |
|---|---|---|---|---|
| 2025-10-15 | Upgrade | Goldman | Neutral → Buy | $186 |
| 2025-09-09 00:00:00 | Upgrade | Wells Fargo | Equal Weight → Overweight | $212 |
| 2025-08-28 00:00:00 | Upgrade | TD Securities | Hold → Buy | |
| 2025-08-19 00:00:00 | Upgrade | CIBC | Neutral → Sector Outperform |
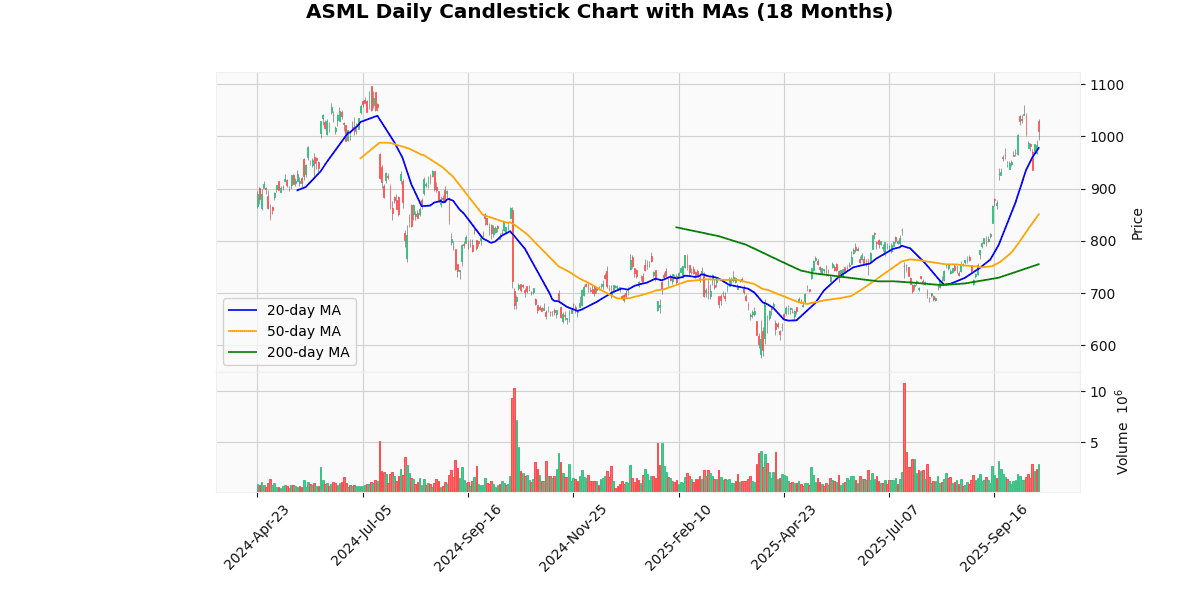
ASML Holding NV (ASML) (2.71%)
Recent News (Last 24 Hours)
In recent financial news, ASML Holding NV has demonstrated a robust performance, with its stock price rising due to strong order bookings and a positive outlook for 2026. Despite missing revenue expectations, ASML’s strong orders, particularly in the AI sector, have bolstered investor confidence, contributing to a rally in AI chip stocks such as Nvidia, AMD, and Broadcom. This surge is attributed to ASML’s Q3 2025 earnings, where it reported significant net sales and net income, highlighting its pivotal role in the AI technology supply chain.
However, concerns loom over ASML’s future growth due to geopolitical tensions, as indicated by warnings of a potential slowdown in China, which could impact the company’s business given China’s substantial role in the global tech landscape. Additionally, the ongoing U.S.-China tech war poses risks, with ASML caught in the crossfire due to restrictions on rare earth materials, crucial for semiconductor manufacturing.
Overall, while ASML’s immediate financial health appears strong, sustained growth may face challenges from global trade dynamics and geopolitical issues, which could influence investor sentiment and stock performance in the longer term.
Technical Analysis
The current price of the asset at $1009.81 indicates a robust upward trend when analyzed against its moving averages (MAs). The 20-day moving average (MA20) at $977.67, 50-day moving average (MA50) at $850.98, and the 200-day moving average (MA200) at $755.31 all suggest a consistent bullish momentum over short, medium, and long-term periods. The significant gap between these MAs and the current price highlights strong buying interest and positive investor sentiment.
The asset’s price standing well above the MA200 suggests a solid long-term upward trend, reinforcing the strength seen in shorter-term indicators. This positioning above all three key MAs typically indicates a potential continuation of the upward trend, barring any sudden market shifts or external negative influences. Investors might view these metrics as a confirmation of a stable upward trajectory, supporting strategies favoring long positions.
Recent Ratings
| Date | Status | Outer | Rating | Price |
|---|---|---|---|---|
| 2025-10-06 00:00:00 | Downgrade | New Street | Buy → Neutral | |
| 2025-09-29 00:00:00 | Upgrade | Mizuho | Neutral → Outperform | |
| 2025-09-22 00:00:00 | Upgrade | Morgan Stanley | Equal-Weight → Overweight | |
| 2025-09-22 00:00:00 | Upgrade | Erste Group | Hold → Buy |
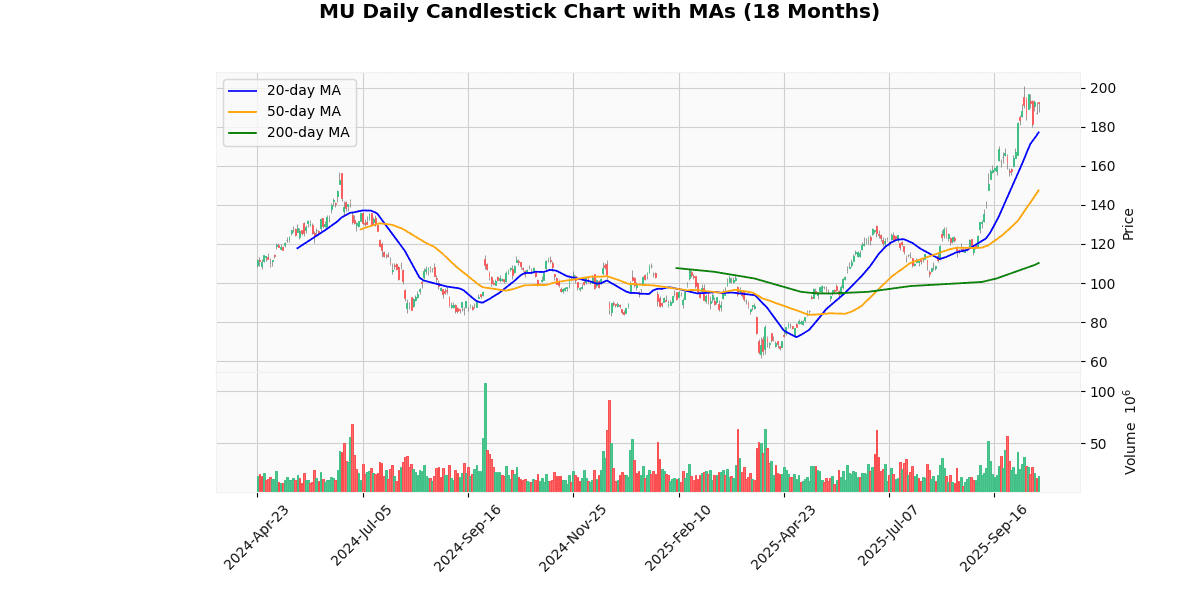
Micron Technology Inc (MU) (2.61%)
Recent News (Last 24 Hours)
In recent financial news, Micron Technology Inc. (MU) has been a focal point, receiving an upgrade from Morgan Stanley to an ‘Overweight’ rating with an increased price target. This adjustment suggests a bullish outlook on Micron’s performance, potentially driven by favorable market dynamics or internal operational efficiencies. Additionally, Micron has been highlighted as an outlier in terms of money flows, indicating strong investor interest and possible capital inflows that could further buoy the stock price.
Furthermore, the broader semiconductor sector is facing geopolitical tensions, as evidenced by the emerging ‘Splinternet’ between the US and China over AI chips. This divide could impact global supply chains and market access, potentially affecting companies like Micron that are deeply integrated into these networks.
With Pure Storage showing a significant 69% increase over three months, the tech sector, particularly storage and memory, appears robust, which could have positive spillover effects on companies like Micron. Analysts are also speculating whether Micron’s stock price could reach as high as $270 in 2025, reflecting a strong market confidence.
Overall, these developments suggest a potentially positive trajectory for Micron’s stock, supported by favorable analyst upgrades and a strong sectoral performance, albeit tempered by geopolitical risks that could introduce volatility to market conditions.
Technical Analysis
The analysis of the provided price metrics indicates a robust upward trend in the asset’s value. The current price of $191.94 significantly surpasses all listed moving averages: 20-day MA at $177.06, 50-day MA at $147.44, and 200-day MA at $110.21. This pattern suggests a strong bullish momentum, as the current price is not only higher than the short-term 20-day moving average but also substantially exceeds the medium and long-term averages. The considerable gap between these moving averages and the current price highlights a sustained positive sentiment in the market, potentially driven by favorable fundamental or sector-specific developments. Investors might view these indicators as a confirmation of a continuing uptrend, though caution is warranted as such steep inclines could also hint at overbought conditions, possibly leading to a future price correction.
Recent Ratings
| Date | Status | Outer | Rating | Price |
|---|---|---|---|---|
| 2025-10-14 00:00:00 | Downgrade | New Street | Buy → Neutral | |
| 2025-10-13 00:00:00 | Upgrade | BNP Paribas Exane | Underperform → Outperform | $270 |
| 2025-10-08 00:00:00 | Reiterated | UBS | Buy | $195 → $225 |
| 2025-10-07 00:00:00 | Initiated | Itau BBA | Outperform | $249 |
Worst 10 Performers
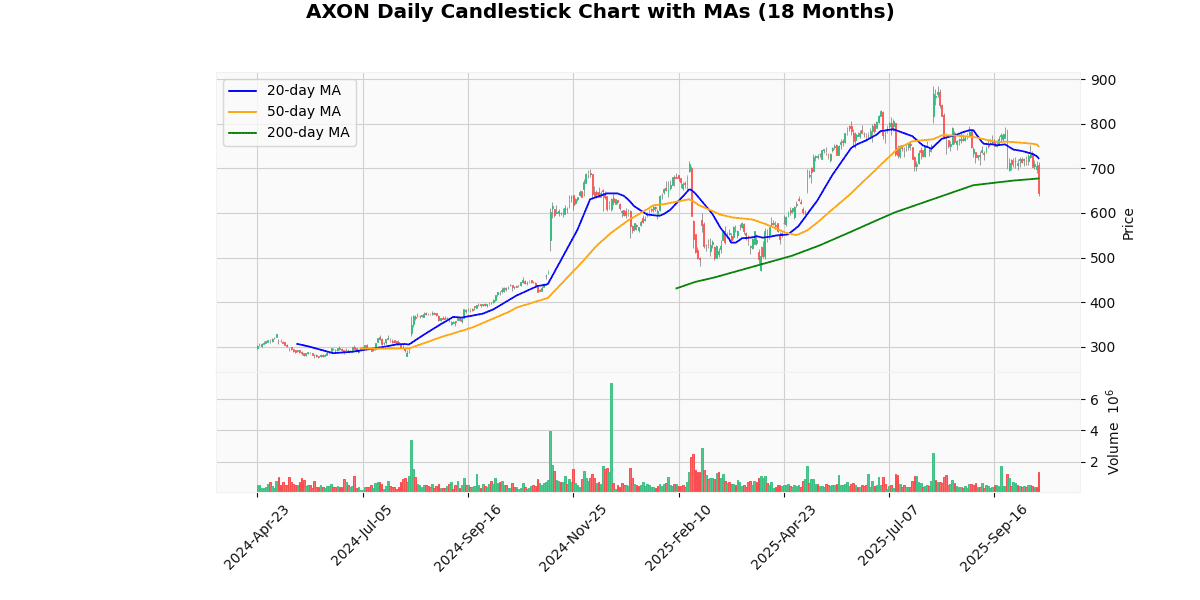
Axon Enterprise Inc (AXON) (-8.47%)
Recent News (Last 24 Hours)
In recent financial news, one insurer has notably underperformed, becoming one of the worst-performing stocks in the S&P 500 as of October 15, 2025. This significant downturn in stock performance could potentially influence investor sentiment and market stability within the insurance sector, possibly triggering a reassessment of risk and valuation models by investors and analysts.
In other news, Axon Enterprise, Inc. (AXON) has been actively enhancing its market presence in the counter-drone technology arena through a new partnership with TYTAN. This strategic move, announced on October 15, could bolster Axon’s competitive edge in the security technology market, potentially impacting its stock positively if the partnership yields innovative solutions that meet market demands.
Additionally, Axon’s current market trends and performance have prompted financial analysts to scrutinize whether it remains a viable buy. Such evaluations are crucial as they influence investor decisions and could lead to increased trading volumes or price adjustments based on the perceived future trajectory of the company.
Overall, these developments could have varied impacts on the respective companies’ stock performances, influencing investor strategies and market dynamics in the sectors of insurance and security technology.
Technical Analysis
The current price of the asset at $644.99 indicates a bearish trend as it is positioned below all key moving averages: the 20-day MA at $722.74, the 50-day MA at $749.58, and the 200-day MA at $677.43. This alignment suggests that the asset has been experiencing a consistent downward trajectory over both short and long-term periods. The significant gap between the current price and the 20-day and 50-day moving averages highlights strong recent selling pressure. Additionally, the fact that the price is also below the 200-day moving average further confirms a longer-term bearish outlook. Investors might view these indicators as a signal of ongoing weakness, potentially influencing a cautious or bearish market sentiment. This setup could be opportune for those looking to enter short positions or for current holders to consider strategic exits or wait for potential reversal signals.
Recent Ratings
| Date | Status | Outer | Rating | Price |
|---|---|---|---|---|
| 2025-09-24 00:00:00 | Initiated | Piper Sandler | Overweight | $893 |
| 2025-08-05 00:00:00 | Upgrade | Craig Hallum | Hold → Buy | $900 |
| 2025-07-16 00:00:00 | Initiated | UBS | Neutral | $820 |
| 2025-07-08 00:00:00 | Initiated | Wolfe Research | Outperform |
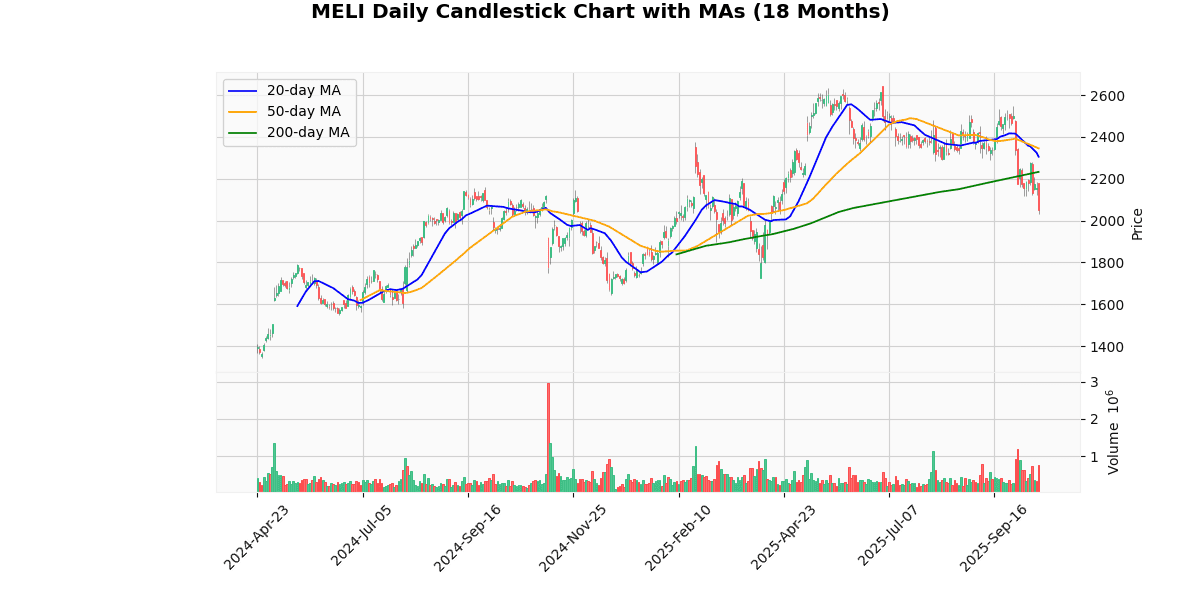
MercadoLibre Inc (MELI) (-5.07%)
Technical Analysis
The current price of the asset at $2048.35 shows a significant downtrend when compared to its moving averages (MAs). The 20-day MA at $2305.12 and the 50-day MA at $2345.6 both suggest that the asset has been performing better in the recent past, indicating a bearish shift in the short term. The 200-day MA at $2232.87, while lower than the 20-day and 50-day MAs, still sits above the current price, reinforcing the bearish outlook over a longer period. This positioning below all three key MAs suggests that the asset is currently out of favor with investors, and there may be continued downward pressure on the price. Investors should monitor for potential support levels or signs of reversal if considering entry points, but the prevailing trend is decidedly downward.
Recent Ratings
| Date | Status | Outer | Rating | Price |
|---|---|---|---|---|
| 2025-08-01 00:00:00 | Initiated | Daiwa Securities | Buy | $3000 |
| 2025-07-28 00:00:00 | Initiated | Scotiabank | Sector Outperform | $3500 |
| 2025-06-05 00:00:00 | Downgrade | Jefferies | Buy → Hold | $2800 |
| 2025-04-15 00:00:00 | Initiated | The Benchmark Company | Buy | $2500 |
Atlassian Corporation (TEAM) (-4.18%)
Recent News (Last 24 Hours)
In recent financial news, Atlassian Corporation (NASDAQ: TEAM) has experienced significant movements that could impact its stock performance. On October 15, 2025, Artisan Mid Cap Fund announced its decision to exit its position in Atlassian, as reported by Insider Monkey. The specific reasons behind this decision were not detailed in the summary provided, but such a move by a major institutional investor could suggest concerns about the company’s future growth prospects or valuation, potentially leading to negative investor sentiment.
Conversely, on the same day, Wells Fargo initiated coverage on Atlassian with an “Overweight” rating and a price target of $216. This optimistic outlook from a major financial institution highlights a positive assessment of Atlassian’s market position and future growth trajectory, potentially countering any negative impact from the Artisan Mid Cap Fund’s exit.
These contrasting actions by significant financial entities could lead to increased volatility in Atlassian’s stock as the market digests the implications of these developments. Investors should monitor further disclosures and market reactions to better understand the potential long-term impacts on Atlassian’s stock value.
Technical Analysis
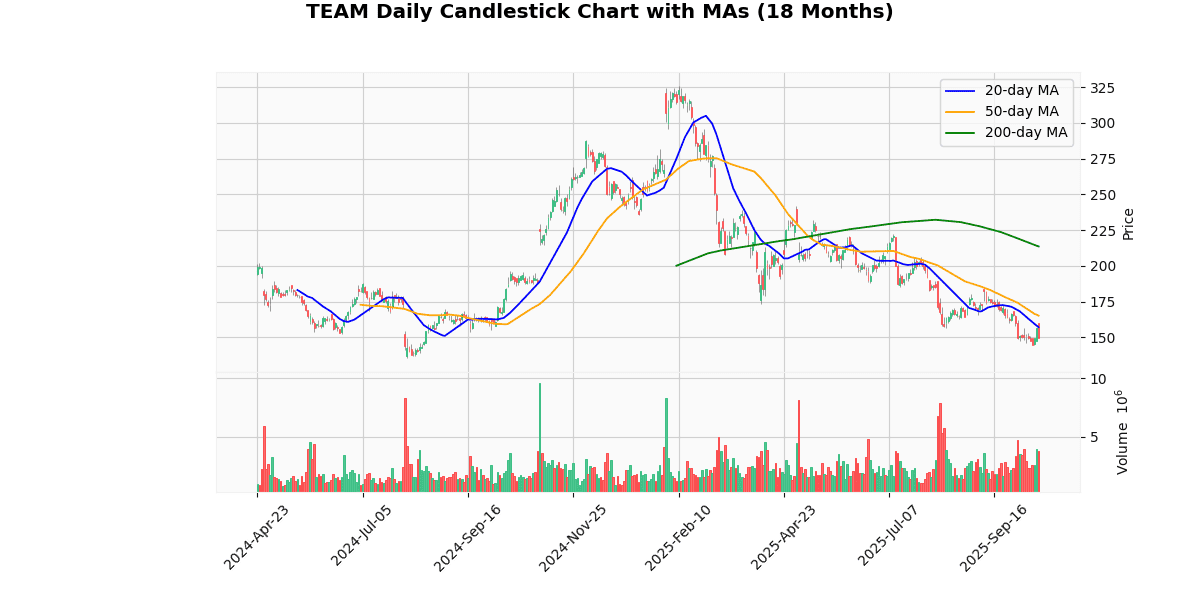
The current price of the asset at $149.84 indicates a bearish trend when analyzed against its moving averages (MAs). It is trading below the 20-day MA of $157.09, the 50-day MA of $165.17, and significantly below the 200-day MA of $213.56. This positioning suggests a sustained downward momentum over the short, medium, and long term. The substantial gap between the current price and the 200-day MA highlights a strong bearish sentiment in the market, potentially indicating that the asset has been over-sold or that investors have major concerns about its underlying value or market conditions. Traders might view these levels as resistance points; any approach towards these MAs could attract selling pressure, reinforcing the downtrend unless new bullish catalysts emerge.
Recent Ratings
| Date | Status | Outer | Rating | Price |
|---|---|---|---|---|
| 2025-09-23 00:00:00 | Initiated | BofA Securities | Neutral | $200 |
| 2025-09-11 00:00:00 | Initiated | Guggenheim | Buy | $225 |
| 2025-08-08 00:00:00 | Reiterated | BMO Capital Markets | Outperform | $225 → $200 |
| 2025-07-16 00:00:00 | Downgrade | CapitalOne | Overweight → Equal Weight | $211 |
Booking Holdings Inc (BKNG) (-3.77%)
Recent News (Last 24 Hours)
KAYAK, a leading travel search engine, has announced the launch of its new AI Mode, a conversational travel search feature, strategically timed to coincide with the upcoming holiday season. This innovative feature is designed to enhance user experience by simplifying the process of searching for travel options through natural language interactions. The introduction of AI Mode could potentially increase user engagement and retention rates by offering a more intuitive and personalized search process.
From a financial perspective, this development is likely to positively impact KAYAK’s stock. The enhancement in user experience can lead to higher traffic and usage rates, potentially boosting revenue from increased bookings and advertising. Additionally, the timing of the release—just before the holiday season—positions KAYAK to capitalize on the typically high travel activity period, potentially leading to a significant uptick in quarterly earnings. Investors should monitor the adoption rate of the AI Mode and its impact on KAYAK’s market share within the competitive online travel agency sector.
Technical Analysis
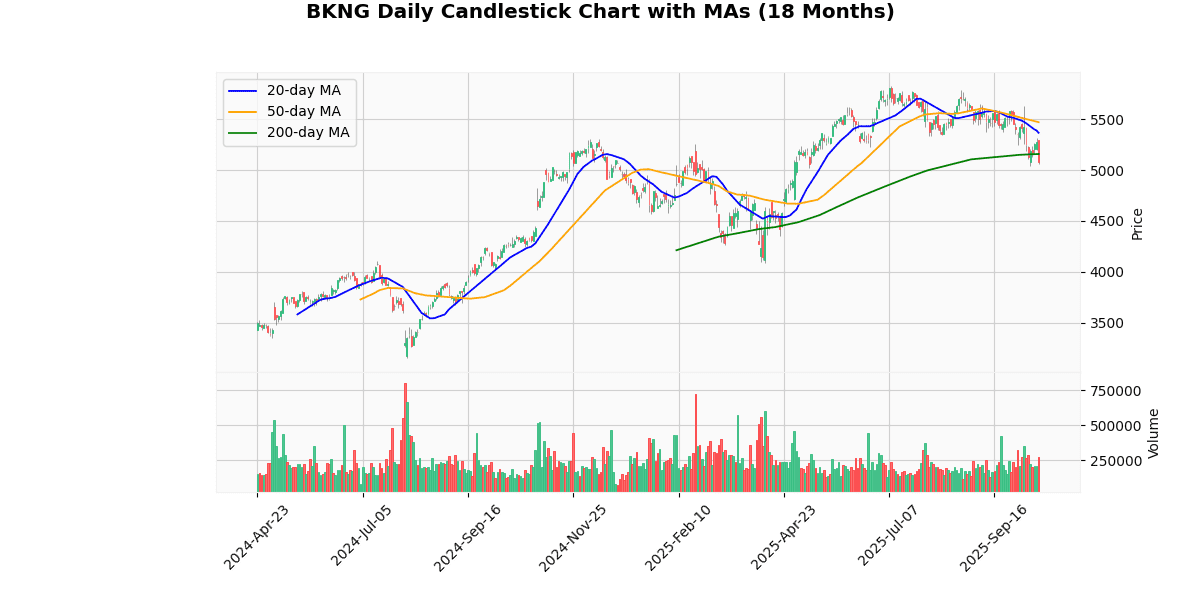
The current price of 5080.86 indicates a bearish trend as it is positioned below all key moving averages: the 20-day MA at 5365.74, the 50-day MA at 5470.12, and the 200-day MA at 5157.9. This alignment suggests that the asset has been experiencing a consistent downward pressure in both the short and medium term. The fact that the current price is also below the 200-day MA, a key indicator of long-term market sentiment, further underscores a potential bearish outlook. Investors might view this as a signal of weakening momentum and possibly a more cautious approach to this asset. Market participants should monitor for any potential support levels or signs of reversal, but the prevailing data points towards a continuation of the current downtrend.
Recent Ratings
| Date | Status | Outer | Rating | Price |
|---|---|---|---|---|
| 2025-09-30 00:00:00 | Initiated | Mizuho | Neutral | $5975 |
| 2025-08-05 00:00:00 | Upgrade | Erste Group | Hold → Buy | |
| 2025-07-30 00:00:00 | Downgrade | Wedbush | Outperform → Neutral | $5900 |
| 2025-04-04 00:00:00 | Upgrade | BTIG Research | Neutral → Buy | $5500 |
Honeywell International Inc (HON) (-2.93%)
Recent News (Last 24 Hours)
In recent financial news, Qnity, a new entrant in the semiconductor industry, has been highlighted as a potential standout in the sector. In an interview with TheStreet, Qnity’s CEO Jon Kemp discussed the company’s innovative strategies and growth prospects. This coverage could significantly influence investor sentiment and potentially drive Qnity’s stock prices up as market participants often react positively to strong leadership and innovative business models in high-growth industries.
Additionally, upcoming financial events could also impact market movements. Schaeffer’s Research pointed out that the week ahead includes crucial Dow earnings and a new Consumer Price Index (CPI) reading. These events are likely to cause fluctuations in the stock market as investors adjust their portfolios based on corporate performance and inflation data, which could indirectly affect stocks like Qnity if broader market sentiment shifts.
Investors should monitor these developments closely, as they could have implications for both sector-specific stocks and the broader market environment.
Technical Analysis
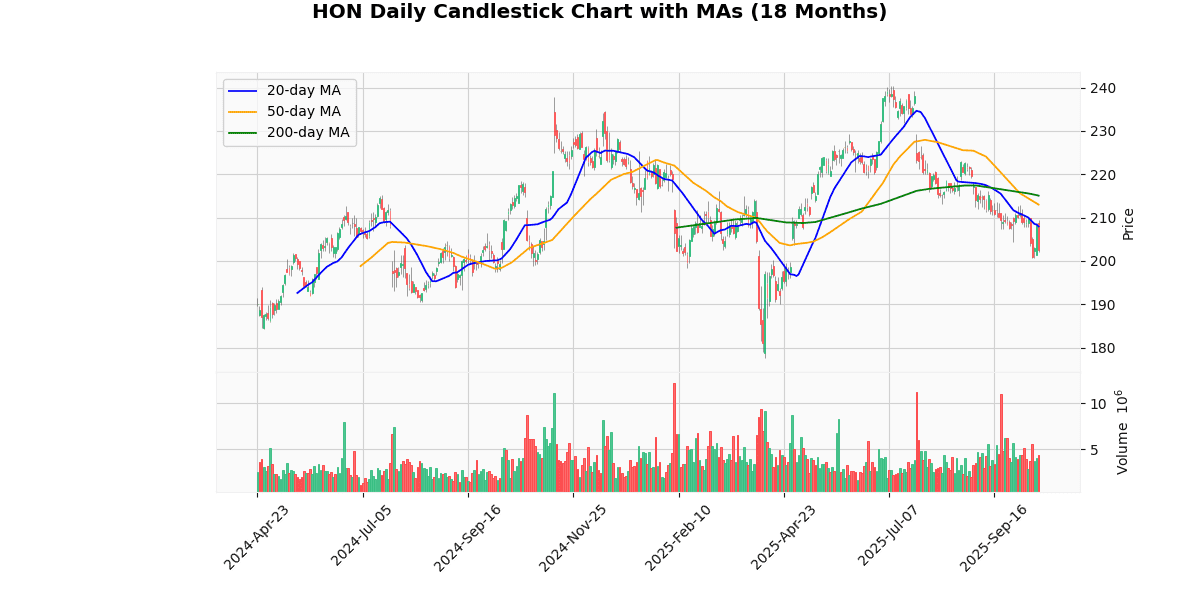
The current price of the asset at $202.5 reflects a bearish trend when analyzed against its moving averages (MAs). The price is positioned below the 20-day MA of $207.97, the 50-day MA of $213.00, and significantly below the 200-day MA of $215.08. This positioning indicates a sustained downward momentum over short, medium, and long-term periods. The gap between the current price and these MAs suggests that the asset is potentially undervalued or experiencing a strong sell-off, which could be due to various market factors or negative sentiment. Investors might view the current levels as a consolidation point if they believe the downturn is temporary. However, the consistent decline across all three key MAs could also signal a more cautious approach, advising against immediate bullish positions until a reversal pattern is evident.
Recent Ratings
| Date | Status | Outer | Rating | Price |
|---|---|---|---|---|
| 2025-05-07 00:00:00 | Upgrade | BofA Securities | Neutral → Buy | $250 |
| 2025-02-07 00:00:00 | Upgrade | Deutsche Bank | Hold → Buy | $236 → $260 |
| 2024-12-11 00:00:00 | Upgrade | HSBC Securities | Hold → Buy | $290 |
| 2024-10-28 00:00:00 | Downgrade | Wolfe Research | Outperform → Peer Perform |
Roper Technologies Inc (ROP) (-2.74%)
Recent News (Last 24 Hours)
In recent financial news, Nvidia has received an upgrade from Wall Street analysts, signaling a positive outlook on the company’s stock performance. This upgrade reflects analysts’ increased confidence in Nvidia’s market position and future growth prospects, potentially driven by advancements in its core businesses such as gaming and AI technologies. On the other hand, Ibotta has been downgraded, indicating concerns or potential challenges in its business model or market conditions that could impact its stock negatively. These analyst calls are crucial for investors as they can significantly influence market perceptions and stock movements. The upgrade for Nvidia might attract more investors, boosting its stock price, while the downgrade for Ibotta could lead to a decline in its share value. Investors and stakeholders in these companies should consider these analyst ratings when making investment decisions. For further details, refer to the original article on The Fly or follow the provided link to Yahoo Finance.
Technical Analysis
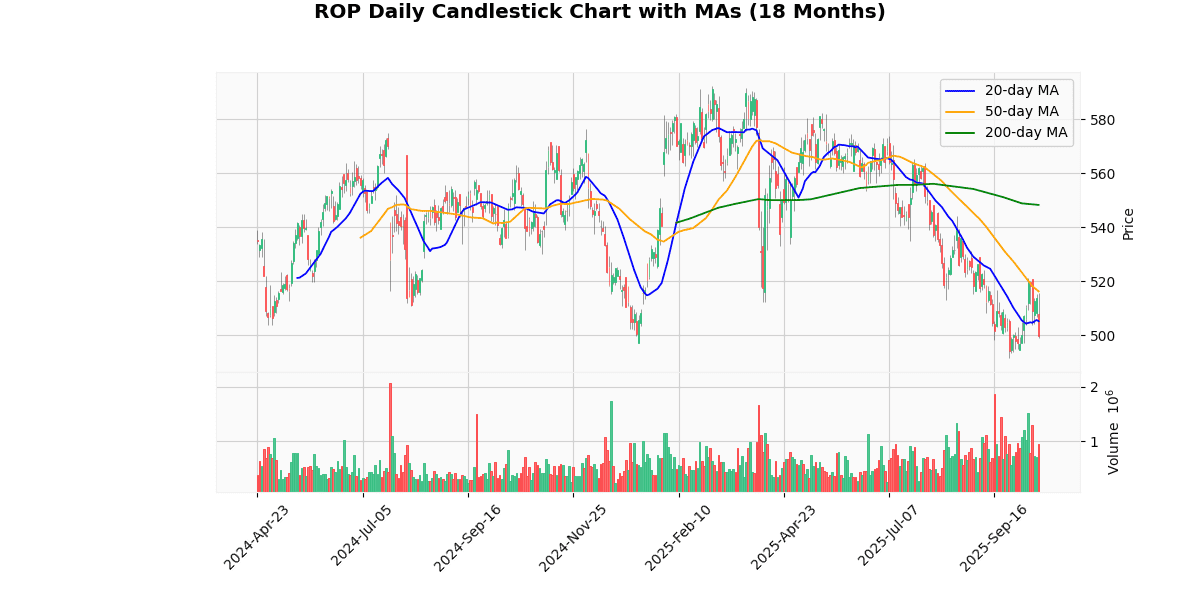
The current price of the asset at $499.73 exhibits a downward trend when compared to its moving averages across several time frames. Specifically, it is trading below the 20-day moving average (MA20) of $505.21, the 50-day moving average (MA50) of $516.26, and significantly below the 200-day moving average (MA200) of $548.28. This positioning suggests a bearish sentiment in the short to medium term, as the asset is not only underperforming relative to recent historical averages but also showing a consistent decline over a longer period. The gap between the current price and the MA200 highlights a potentially entrenched negative trend, signaling caution for investors. Market participants might view these indicators as a confirmation of ongoing bearish momentum, potentially influencing further sell-offs unless countered by positive market catalysts.
Recent Ratings
| Date | Status | Outer | Rating | Price |
|---|---|---|---|---|
| 2025-10-15 | Downgrade | JP Morgan | Neutral → Underweight | $541 |
| 2025-08-20 00:00:00 | Initiated | Citigroup | Buy | $626 |
| 2025-05-05 00:00:00 | Initiated | William Blair | Outperform | |
| 2025-03-27 00:00:00 | Initiated | Stifel | Buy | $685 |
Synopsys Inc (SNPS) (-1.77%)
Recent News (Last 24 Hours)
Synopsys, Inc. (SNPS) has recently been in the spotlight with several key developments that could influence its stock performance. Firstly, the company’s AI-based EDA tools are reportedly gaining significant traction, as highlighted in a recent Zacks article. This development positions Synopsys at the forefront of innovation in the semiconductor design space, potentially serving as a major growth catalyst.
Additionally, Synopsys has received regulatory approval to divest its Optical and PowerArtist businesses, according to Insider Monkey. This strategic move could streamline operations and optimize the company’s focus on core competencies, potentially enhancing profitability.
In international news affecting the sector, Chinese chip equipment supplier SiCarrier has launched its own EDA software, as reported by the South China Morning Post. This could introduce new competition in the EDA market, possibly impacting Synopsys’ market share and competitive edge.
Overall, these developments suggest a dynamic period for Synopsys, with potential impacts on its market position and stock valuation driven by innovation, strategic business adjustments, and evolving competitive landscapes.
Technical Analysis
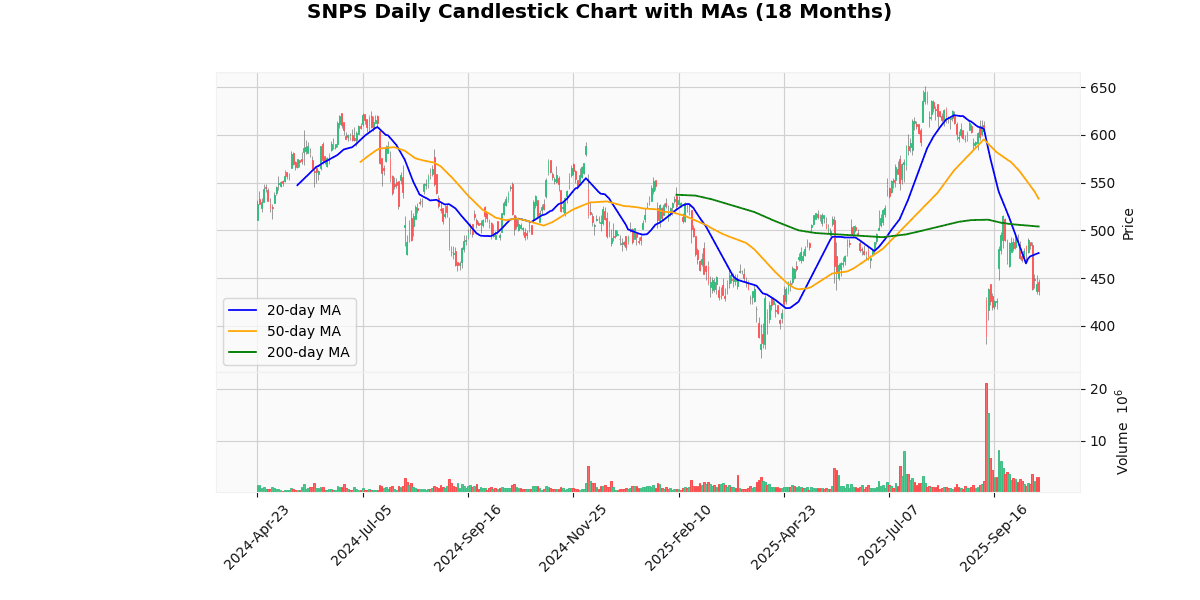
The current price of the asset stands at $435.9, which is positioned below all key moving averages: 20-day MA at $476.21, 50-day MA at $533.2, and 200-day MA at $504.01. This configuration indicates a bearish trend in the short to medium term, as the price is consistently underperforming relative to historical averages. The significant gap between the current price and the 50-day MA suggests a strong downward momentum, which might deter bullish investors until signs of stabilization or reversal are evident. Additionally, the fact that the current price is also below the 200-day MA reinforces the bearish sentiment, highlighting a potential long-term downtrend. Investors might consider this an opportune moment to evaluate defensive strategies unless upcoming market activities suggest a shift in the prevailing trend.
Recent Ratings
| Date | Status | Outer | Rating | Price |
|---|---|---|---|---|
| 2025-09-10 00:00:00 | Reiterated | Needham | Buy | $660 → $550 |
| 2025-09-10 00:00:00 | Downgrade | Rosenblatt | Buy → Neutral | $605 |
| 2025-09-10 00:00:00 | Downgrade | Robert W. Baird | Outperform → Neutral | $535 |
| 2025-09-10 00:00:00 | Downgrade | BofA Securities | Buy → Underperform | $525 |
Linde Plc (LIN) (-1.70%)
Recent News (Last 24 Hours)
As of the latest update, there have been no significant news developments within the past 24 hours that directly impact the stock market. The absence of fresh news can lead to a period of low volatility and stable trading conditions for stocks, as investors may not have new data to prompt significant changes in market positions. However, it is essential for investors to remain vigilant and consider broader market trends and upcoming economic indicators that could influence stock movements. In the absence of immediate news, the focus may shift to long-term fundamentals and external economic factors, such as interest rate decisions, geopolitical events, or shifts in consumer behavior, which could eventually impact market sentiment and trading activity. Investors are advised to stay informed through reliable financial news sources and adjust their strategies accordingly to navigate the current market landscape effectively.
Technical Analysis
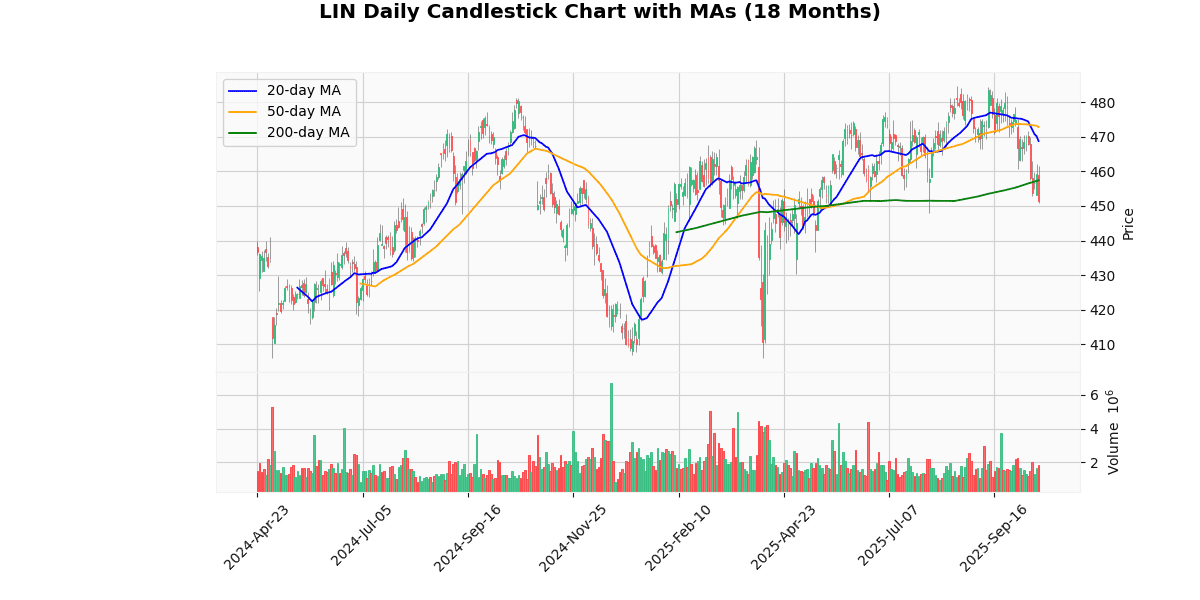
The current price of the asset at $451.42 is positioned below all key moving averages: the 20-day MA at $468.78, the 50-day MA at $472.88, and the 200-day MA at $457.43. This positioning indicates a bearish trend in the short to medium term. The fact that the price is under the 20-day and 50-day MAs suggests recent weakness and a potential continuation of downward momentum. Moreover, the price sitting below the 200-day MA further confirms a longer-term downtrend. Investors might view these indicators as bearish signals, suggesting that the asset could face further declines unless there is a significant shift in market conditions or external factors that could drive up the price. Overall, the asset appears to be in a bearish market phase, warranting caution among buyers.
Recent Ratings
| Date | Status | Outer | Rating | Price |
|---|---|---|---|---|
| 2025-06-30 00:00:00 | Upgrade | Citigroup | Neutral → Buy | $535 |
| 2025-06-13 00:00:00 | Initiated | RBC Capital Mkts | Outperform | $576 |
| 2025-01-13 00:00:00 | Upgrade | TD Cowen | Hold → Buy | |
| 2024-04-18 00:00:00 | Upgrade | Mizuho | Neutral → Buy | $510 |
PayPal Holdings Inc (PYPL) (-1.69%)
Recent News (Last 24 Hours)
On October 15, 2025, significant news surrounding PayPal Holdings, Inc. (NASDAQ: PYPL) emerged, potentially impacting its stock performance. Firstly, a Decrypt article reported that Paxos minted and then burned $300 trillion in PayPal stablecoins, an event highlighting the volatility and regulatory complexities in the cryptocurrency space where PayPal is increasingly active. This could affect investor sentiment as it underscores both the potential and risks in the fintech’s expansion into digital currencies.
Overall, these events are likely to influence PayPal’s market perception, potentially affecting its stock volatility and investor interest in the short to medium term.
Technical Analysis
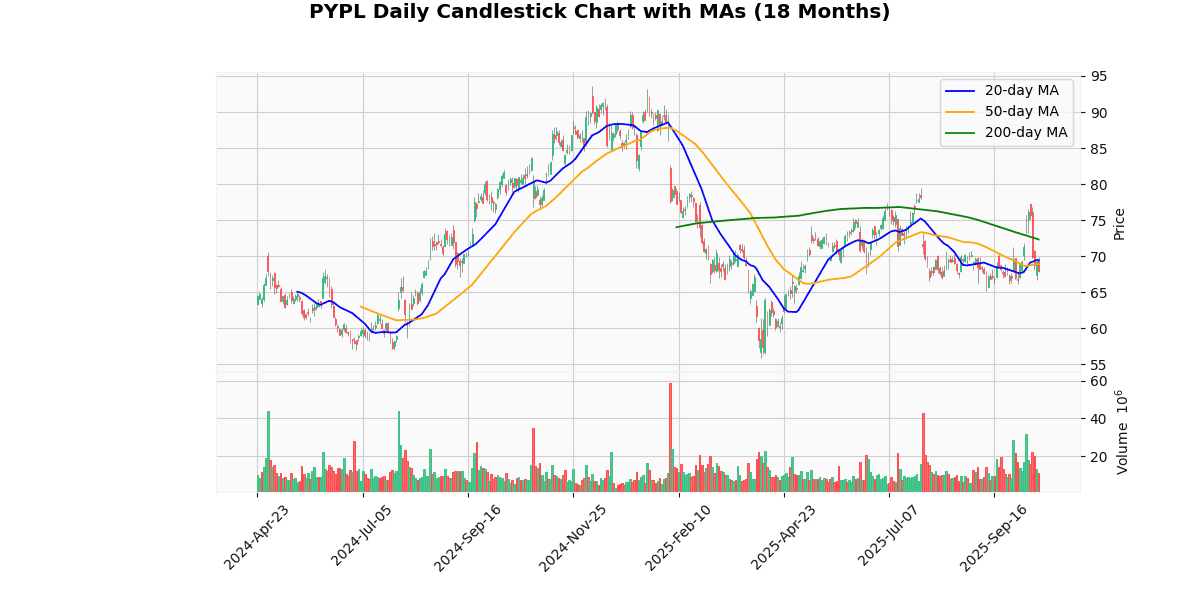
The current price of the asset at $67.98 is positioned below all key moving averages: 20-day MA at $69.44, 50-day MA at $68.92, and 200-day MA at $72.33. This positioning indicates a bearish trend in the short to medium term, as the price is consistently trading below these averages. The fact that the price is also below the 200-day MA suggests a longer-term downtrend or potential resistance in regaining higher price levels. The descending order of the moving averages further confirms the bearish sentiment, with shorter-term averages trading below longer-term ones, typically a signal of ongoing downward momentum. Investors might view these indicators as a sign of caution, potentially adjusting their positions to mitigate risk or waiting for signs of a reversal before increasing exposure.
Recent Ratings
| Date | Status | Outer | Rating | Price |
|---|---|---|---|---|
| 2025-10-13 00:00:00 | Downgrade | Goldman | Neutral → Sell | $70 |
| 2025-10-03 00:00:00 | Downgrade | Wolfe Research | Outperform → Peer Perform | |
| 2025-07-17 00:00:00 | Resumed | Deutsche Bank | Hold | $75 |
| 2025-07-14 00:00:00 | Upgrade | Seaport Research Partners | Sell → Neutral |
Adobe Inc (ADBE) (-1.58%)
Technical Analysis
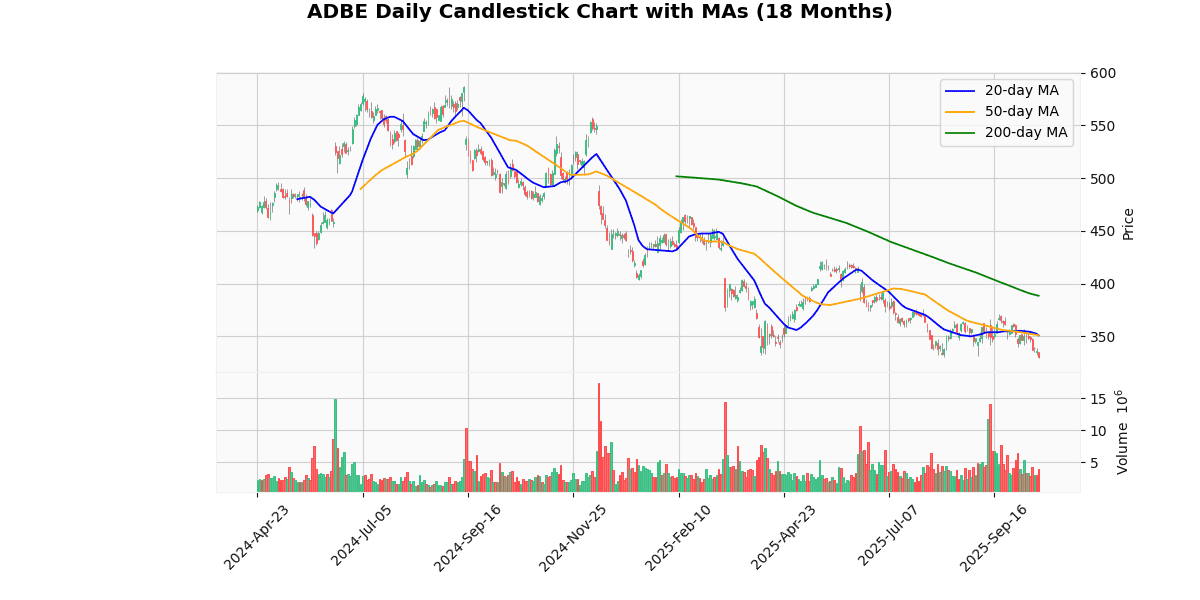
The current price of $330.63 indicates a bearish trend as it is positioned below all key moving averages: the 20-day MA at $350.96, the 50-day MA at $351.1, and significantly below the 200-day MA at $388.49. This alignment suggests a sustained downward momentum over both short and long-term periods. The proximity of the 20-day and 50-day MAs, both hovering around the $351 mark, indicates a recent consolidation phase, potentially signaling a resistance level near this area. The substantial gap between the current price and the 200-day MA highlights a longer-term depreciation in value, which could be indicative of underlying bearish sentiments or external market pressures. Investors might view this as a cautious zone, with potential reevaluation of asset stability and growth prospects before making further commitments.
Recent Ratings
| Date | Status | Outer | Rating | Price |
|---|---|---|---|---|
| 2025-09-24 00:00:00 | Downgrade | Morgan Stanley | Overweight → Equal-Weight | $450 |
| 2025-09-12 00:00:00 | Reiterated | BMO Capital Markets | Outperform | $450 → $405 |
| 2025-08-11 00:00:00 | Downgrade | Melius | Hold → Sell | $310 |
| 2025-07-02 00:00:00 | Downgrade | Rothschild & Co Redburn | Neutral → Sell | $280 |
Disclaimer
The content on MarketsFN.com is provided for educational and informational purposes only. It does not constitute financial advice, investment recommendations, or trading guidance. All investments involve risks, and past performance does not guarantee future results. You are solely responsible for your investment decisions and should conduct independent research and consult a qualified financial advisor before acting. MarketsFN.com and its authors are not liable for any losses or damages arising from your use of this information.


