Nasdaq, Inc., founded by Gordon S. Macklin in 1971 and headquartered in New York, NY, is a multifaceted holding company primarily known for its global trading, clearing, and exchange technology services. The company operates through three main segments: Capital Access Platforms, Financial Technology, and Market Services. The Capital Access Platforms segment focuses on providing tools and services that enhance the ability of corporate issuers and investors to navigate capital markets effectively, promote sustainability, and uphold governance standards. The Financial Technology segment is dedicated to improving the liquidity, transparency, and integrity of the global economy through advanced market infrastructure. Meanwhile, the Market Services segment handles a range of trading activities including equity derivatives, cash equity trading, and fixed income and commodities trading. Nasdaq’s comprehensive offerings make it a pivotal entity in the financial and technological landscapes of global markets.
Nasdaq has recently reported a strong performance for the second quarter of 2025, with significant news impacting its stock. On July 24, 2025, Nasdaq announced double-digit net revenue growth across all divisions, reflecting robust momentum (GlobeNewswire). This was complemented by their Q2 earnings and revenues surpassing estimates, which led to an adjustment in their expense view (Zacks). Additionally, Nasdaq declared a quarterly dividend of $0.27 per share, underscoring its financial health and commitment to shareholder returns (GlobeNewswire).
Moreover, Nasdaq’s strategic movements include extending its exclusive Nasdaq-100 Futures license with CME Group through 2039, promising sustained revenue from derivatives trading (PR Newswire). These developments, combined with a positive analyst report from Morningstar, suggest a strong outlook for Nasdaq, potentially influencing its stock positively as it demonstrates growth, operational efficiency, and strategic foresight in its operations.
## Price Chart

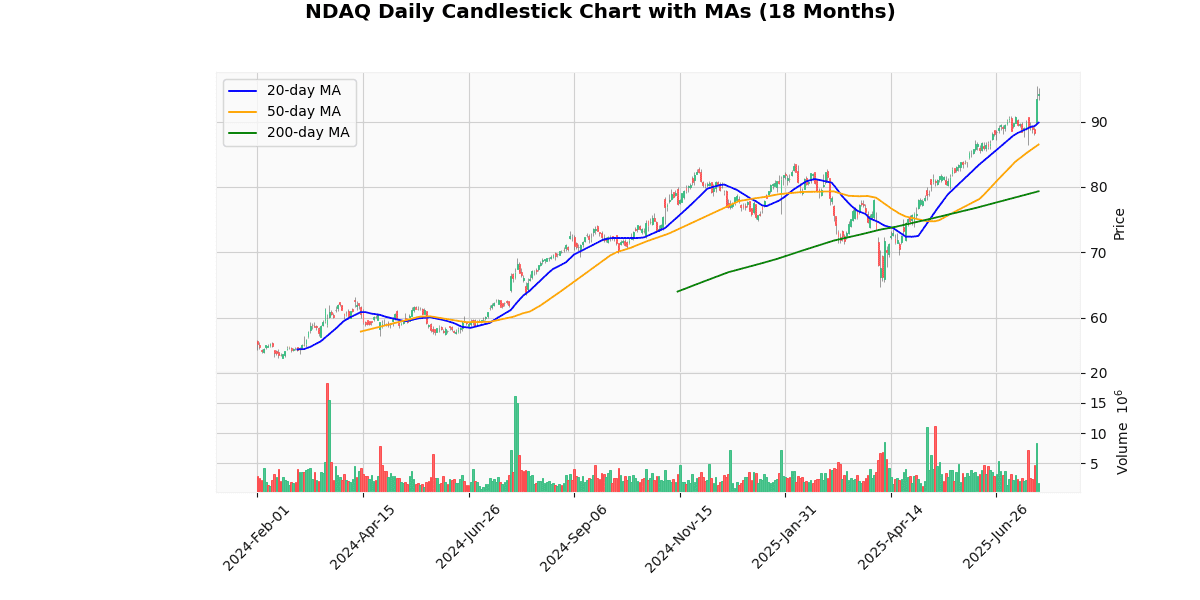
The price metrics indicate a strong upward trend for the asset, with the current price of $94.23 nearing its 52-week and YTD highs of $95.49. This proximity to the high suggests a potential resistance level. The asset has shown significant growth from its 52-week low of $61.64, marking a 52.87% increase, and from the YTD low of $64.64, with a 45.78% rise.
The asset’s performance relative to its moving averages further underscores its bullish trend, with current prices 4.89%, 8.96%, and 18.77% above the 20-day, 50-day, and 200-day moving averages, respectively. This indicates sustained positive momentum over short, medium, and long-term periods.
## Earnings Trend Table
| Date | Estimate EPS | Reported EPS | Surprise % |
|---|---|---|---|
| 2025-07-24 | 0.81 | 0.85 | 4.42 |
| 2025-04-24 | 0.77 | 0.79 | 2.43 |
| 2025-01-29 | 0.75 | 0.76 | 1.38 |
| 2024-10-24 | 0.69 | 0.74 | 6.58 |
| 2024-07-25 | 0.64 | 0.69 | 7.40 |
| 2024-04-25 | 0.65 | 0.63 | -3.65 |
| 2024-01-31 | 0.71 | 0.72 | 1.64 |
| 2023-10-18 | 0.68 | 0.71 | 3.95 |
The Relative Strength Index (RSI) at 70.96 approaches the overbought threshold of 70, suggesting potential for a price pullback or stabilization. Conversely, the MACD of 1.45 points to continued bullish momentum, as it is positive and indicates that the short-term price trend is stronger than the long-term trend.
## Dividend Payments Table
| Date | Dividend |
|---|---|
| 2025-06-13 | 0.27 |
| 2025-03-14 | 0.24 |
| 2024-12-06 | 0.24 |
| 2024-09-13 | 0.24 |
| 2024-06-14 | 0.24 |
| 2024-03-13 | 0.22 |
| 2023-12-07 | 0.22 |
| 2023-09-14 | 0.22 |
Overall, while the asset shows strong upward momentum, the proximity to its high and elevated RSI could signal a near-term consolidation or minor correction before further movements.


