# NASDAQ100 Technical Analysis Recap
The NASDAQ100 index, symbolized as NDX, is a major stock market index comprising 100 of the largest non-financial companies listed on the NASDAQ stock exchange. It includes top technology and biotech firms, reflecting significant sectors like technology, retail, and telecommunications. Renowned for its high-profile constituents like Apple, Google, and Amazon, the NASDAQ100 is a barometer of innovation-driven industry performance.
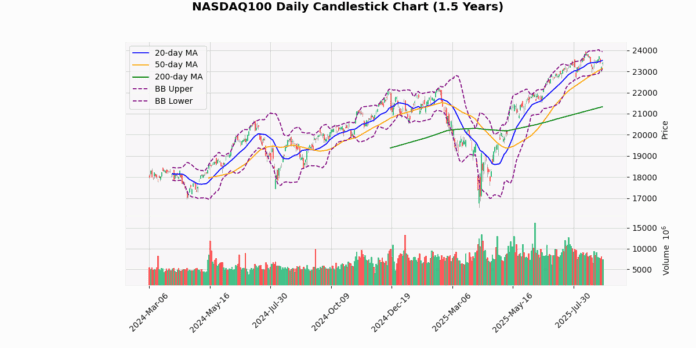
The NASDAQ100 index is currently priced at 23,414.84, showing a modest increase of 0.79% today. The index is trading below its 20-day moving average (MA20) of 23,517.28 but above its 50-day (MA50) and 200-day (MA200) moving averages, which are 23,143.51 and 21,327.77, respectively. This positioning indicates a short-term consolidation but a stronger upward trend in the medium to long term.
The Bollinger Bands show the index near the middle band (23,517.28), with the upper and lower bands at 23,925.68 and 23,108.88, respectively. The proximity to the middle band suggests a neutral market position without extreme volatility. The relatively narrow band range indicates a potential for upcoming volatility as the market decides its direction.
The Relative Strength Index (RSI) at 51.69 is neutral, suggesting that the index is neither overbought nor oversold. This aligns with the current consolidation phase of the index.
The Moving Average Convergence Divergence (MACD) at 89.31 is currently below its signal line at 142.12, indicating a bearish crossover. This could suggest a potential downward momentum in the short term unless the index reverses this trend.
The index’s Average True Range (ATR) of 265.29 points to moderate daily volatility. The 3-day price range is between 22,977.88 and 23,607.54, showing recent fluctuations within a relatively contained range.
Year-to-date, the index has moved significantly from its low at 16,542.2 to a high of 23,969.28, reflecting a strong bullish trend over the longer term despite recent pullbacks.
In summary, while the NASDAQ100 shows a robust long-term uptrend, short-term indicators like the MACD suggest potential bearish pressure. Investors should watch for either a stabilization above the MA20 or a further decline which might test the lower Bollinger Band for more definitive directional cues.
## Technical Metrics
| Metric | Value |
|---|---|
| Current Price | 23414.8 |
| Today’s Change (%) | 0.79 |
| 20-day MA | 23517.3 |
| % from 20-day MA | -0.44 |
| 50-day MA | 23143.5 |
| % from 50-day MA | 1.17 |
| 200-day MA | 21327.8 |
| % from 200-day MA | 9.79 |
| Bollinger Upper | 23925.7 |
| % from BB Upper | -2.14 |
| Bollinger Lower | 23108.9 |
| % from BB Lower | 1.32 |
| RSI (14) | 51.69 |
| MACD | 89.31 |
| MACD Signal | 142.12 |
| 3-day High | 23607.5 |
| % from 3-day High | -0.82 |
| 3-day Low | 22977.9 |
| % from 3-day Low | 1.9 |
| 52-week High | 23969.3 |
| % from 52-week High | -2.31 |
| 52-week Low | 16542.2 |
| % from 52-week Low | 41.55 |
| YTD High | 23969.3 |
| % from YTD High | -2.31 |
| YTD Low | 16542.2 |
| % from YTD Low | 41.55 |
| ATR (14) | 265.29 |
The technical outlook for the NASDAQ100 index suggests a relatively balanced market position with a slight bearish inclination in the short term. The index is currently trading at 23414.84, slightly below the 20-day moving average (MA20) of 23517.28 but above the 50-day (MA50) and 200-day (MA200) moving averages, indicating a mixed sentiment in the short-term versus a stronger bullish trend in the medium to long term.
The Bollinger Bands show the index trading near the middle band (23517.28), with recent price action between the upper (23925.68) and lower (23108.88) bands, suggesting moderate volatility. The Relative Strength Index (RSI) at 51.69 points to a neutral market without significant overbought or oversold conditions. However, the Moving Average Convergence Divergence (MACD) below its signal (89.31 vs. 142.12) could hint at potential bearish momentum ahead.
The Average True Range (ATR) of 265.29 reflects ongoing volatility, which traders should consider when planning entry or exit points. Potential support and resistance levels are observed at the recent 3-day low of 22977.88 and high of 23607.54, respectively. The proximity to the year-to-date and 52-week highs suggests that reaching new highs could face resistance, while substantial gains over the year indicate strong underlying market support.
Overall, investors might remain cautious, watching for either a stronger bullish signal above MA20 or bearish trends if prices decline towards the lower Bollinger Band. The market sentiment appears cautiously optimistic but warrants close monitoring of the aforementioned technical indicators for more definitive trading signals.


