Neogen Corporation (NEOG) Post Earning Analysis
Neogen Corp. specializes in developing, manufacturing, and marketing products for food and animal safety. Founded in 1981 and based in Lansing, Michigan, the company operates through two segments: Food Safety, which offers diagnostic kits to detect contaminants in the food industry, and Animal Safety, providing consumables for veterinarians and animal health distributors. Neogen focuses on ensuring safety and sanitation in food production and animal health.
Recent news concerning Neogen Corporation (NEOG) indicates a mixed financial landscape. On October 9, 2025, Neogen’s stock experienced volatility due to various reports on its fiscal performance. Despite missing Q1 earnings estimates as reported by Zacks, the company’s stock traded up, as highlighted by StockStory, possibly due to exceeding Q3 expectations in another report. Barrons.com noted a spike in Neogen’s stock following the earnings release, which also announced cost-cutting measures including layoffs. This suggests that while the earnings did not meet all expectations, investor reaction might be buoyed by strategic adjustments aimed at financial improvement. Additionally, Business Wire provided details on Neogen’s first-quarter results, further painting a picture of a company in the midst of significant operational adjustments. This series of reports could indicate a period of restructuring for Neogen, potentially impacting its stock as investors react to both missed targets and strategic realignments.
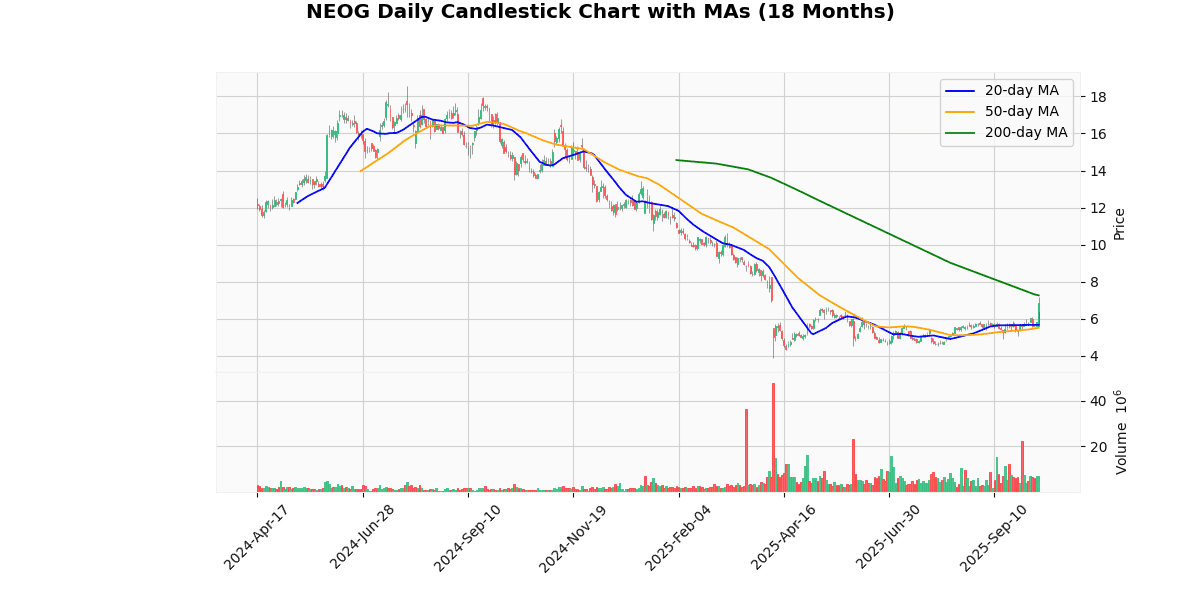
The current price of the asset at $6.83 represents a significant increase of 17.44% today, indicating a strong upward movement in the short term. This recent surge brings the price closer to the week’s high of $7.17, though it remains substantially below the 52-week high of $16.79, emphasizing a longer-term downward trend over the past year.
The asset’s price is currently above both the 20-day and 50-day moving averages by approximately 20.25% and 23.76% respectively, suggesting a bullish trend in the shorter term. However, it is below the 200-day moving average by 6.02%, indicating bearish sentiment in the longer term.
The RSI at 70.76 points towards potential overbought conditions, hinting that the recent price rise might slow down or reverse. Similarly, the MACD at 0.15, although positive, suggests a modest bullish momentum which might not sustain a prolonged rally.
Year-to-date, the asset has recovered significantly from its low of $3.87, yet remains well below the year’s high of $13.41, reflecting volatility and a lack of consistent growth through the year. The wide range between the 52-week high and low also underscores this volatility and uncertain market sentiment surrounding this asset.
Price Chart


Neogen Corporation (NASDAQ: NEOG), based in Lansing, Michigan, disclosed its financial results for the first quarter of fiscal year 2026, ending August 31, 2025. The company reported a total revenue of $209.2 million, marking a 3.6% decrease from $217.0 million in the same quarter the previous year. Despite this overall decline, core revenue slightly rose by 0.3% when adjusted for foreign currency effects and divestitures.
Net income for the quarter was significantly improved at $36.3 million, or $0.17 per diluted share, a recovery from a net loss of $12.6 million, or $0.06 loss per diluted share, in Q1 2025. This turnaround was largely due to a non-cash gain from the sale of the Cleaners and Disinfectants business. Adjusted net income, however, fell by 34.7% to $9.4 million, or $0.04 per diluted share.
Adjusted EBITDA was $35.5 million with a margin of 17.0%, down from $43.7 million and a margin of 20.1% in the previous year, reflecting lower gross margins and increased operating expenses. Gross margin also decreased to 45.4% from 48.4%.
Segment-wise, the Food Safety segment saw revenue decrease by 4.6% to $152.1 million, while the Animal Safety segment slightly declined by 0.8% to $57.1 million. The company has reaffirmed its full-year revenue outlook for fiscal 2026, projecting revenues between $820 million to $840 million and adjusted EBITDA between $165 million to $175 million.
Earnings Trend Table
| Earnings Date | Date | Estimate EPS | Reported EPS | Surprise % |
|---|---|---|---|---|
| 2025-04-09 07:00:00-04:00 | 2025-04-09 | 0.11 | 0.10 | -9.09 |
| 2025-01-10 07:02:00-05:00 | 2025-01-10 | 0.10 | 0.11 | 13.79 |
| 2024-10-10 06:53:00-04:00 | 2024-10-10 | 0.09 | 0.07 | -17.65 |
| 2024-07-30 07:00:00-04:00 | 2024-07-30 | 0.12 | 0.10 | -13.04 |
| 2024-04-09 07:00:00-04:00 | 2024-04-09 | 0.14 | 0.12 | -14.29 |
| 2024-01-09 07:00:00-05:00 | 2024-01-09 | 0.14 | 0.11 | -21.43 |
| 2023-10-10 07:00:00-04:00 | 2023-10-10 | 0.13 | 0.11 | -12.00 |
| 2023-07-27 07:00:00-04:00 | 2023-07-27 | -0.04 | 0.14 | 500.00 |
Over the last eight quarters, the company’s earnings per share (EPS) trends reveal a somewhat volatile pattern with occasional significant surprises. Notably, the most dramatic shift occurred in the quarter ending July 2023, where the reported EPS of $0.14 vastly exceeded the estimate of -$0.04, resulting in a 500% surprise. This suggests a substantial underestimation by analysts or an extraordinary positive development within the company.
Following this peak, the company experienced a decline in its ability to meet or exceed EPS estimates. From October 2023 to April 2025, the company consistently underperformed relative to estimates, except for January 2025, where it slightly surpassed expectations with a 13.79% surprise. This period is characterized by a recurring trend of negative surprises, where the reported EPS was lower than expected, with declines ranging from -9.09% to -21.43%.
The data indicates a potential issue with either forecasting accuracy or operational consistency. The high variability in surprise percentages, particularly the extreme positive surprise followed by consistent underperformance, could be indicative of volatile market conditions, significant operational changes, or internal challenges affecting financial outcomes. This trend warrants careful monitoring and may require strategic adjustments to enhance predictability and performance stability.
The most recent rating changes for the company Outer reflect a dynamic shift in market analysts’ perspectives over a span of approximately three years.
-
William Blair – Downgrade (2025-07-29): William Blair adjusted its stance on Outer from “Outperform” to “Market Perform” on July 29, 2025. This change indicates a shift in expectation, suggesting that the firm no longer perceives the stock to outperform the broader market, though specific target prices were not disclosed. This downgrade could reflect changes in market conditions, company performance, or sector challenges.
-
Guggenheim – Initiation (2024-12-19): On December 19, 2024, Guggenheim initiated coverage on Outer with a “Buy” rating and set a target price of $15. This initiation into Guggenheim’s coverage likely reflects a positive outlook on the company’s growth prospects or market position at that time.
-
Wells Fargo – Initiation (2023-06-16): Wells Fargo began its coverage of Outer with an “Overweight” rating and a target price of $22 on June 16, 2023. The “Overweight” rating suggests that Wells Fargo expects the stock to perform better than the average returns of the sector or the broader market, indicating a strong bullish stance on the company’s future performance.
-
William Blair – Upgrade (2022-11-22): Earlier, on November 22, 2022, William Blair upgraded Outer from “Market Perform” to “Outperform.” This upgrade reflects a positive revision of the firm’s expectations for Outer, signaling confidence in the company’s potential to exceed market performance during that period, although no specific price target was provided.
These rating changes illustrate a trajectory of varying confidence levels in Outer’s market performance, influenced by evolving market dynamics, financial performance, and potentially sector-specific developments. The transition from an upgrade in 2022 to a downgrade in 2025 particularly highlights the fluctuating nature of analyst assessments over time.
As of the latest available data, the current price of the stock stands at $6.83. This price is notably lower compared to the average target price suggested by recent analyst ratings. Specifically, Guggenheim initiated coverage with a “Buy” rating and a target price of $15 as of December 2024, while Wells Fargo rated the stock as “Overweight” with a more optimistic target price of $22 in June 2023. These target prices suggest a substantial upside potential from the current market price.
However, the outlook from William Blair has shifted over time; they upgraded the stock from “Market Perform” to “Outperform” in November 2022 but later downgraded it back to “Market Perform” in July 2025, though no specific target price was provided during the downgrade. This mixed sentiment from analysts indicates variability in performance expectations and market conditions affecting the stock’s future valuation. The absence of specific details on earnings per share (EPS) and dividend trends in the provided data limits a comprehensive financial analysis. However, the disparity between the current price and analyst target prices is a critical point for potential investors to consider.
Disclaimer: The information provided here is for educational and informational purposes only and should not be interpreted as financial advice, investment recommendations, or trading guidance. Markets involve risk, and past performance is not indicative of future results. You should always conduct your own research and consult with a qualified financial advisor before making any investment decisions. By acting, you accept full responsibility for your choices.


