Nikkei Hits Record High as Shenzhen Component Gains 2.06
Note: This analysis covers the Asian trading session close for October 21, 2025. All times are in US Eastern Time (ET).
📊 Asian Indices Performance
| Index | Price | Daily Change (%) |
|---|---|---|
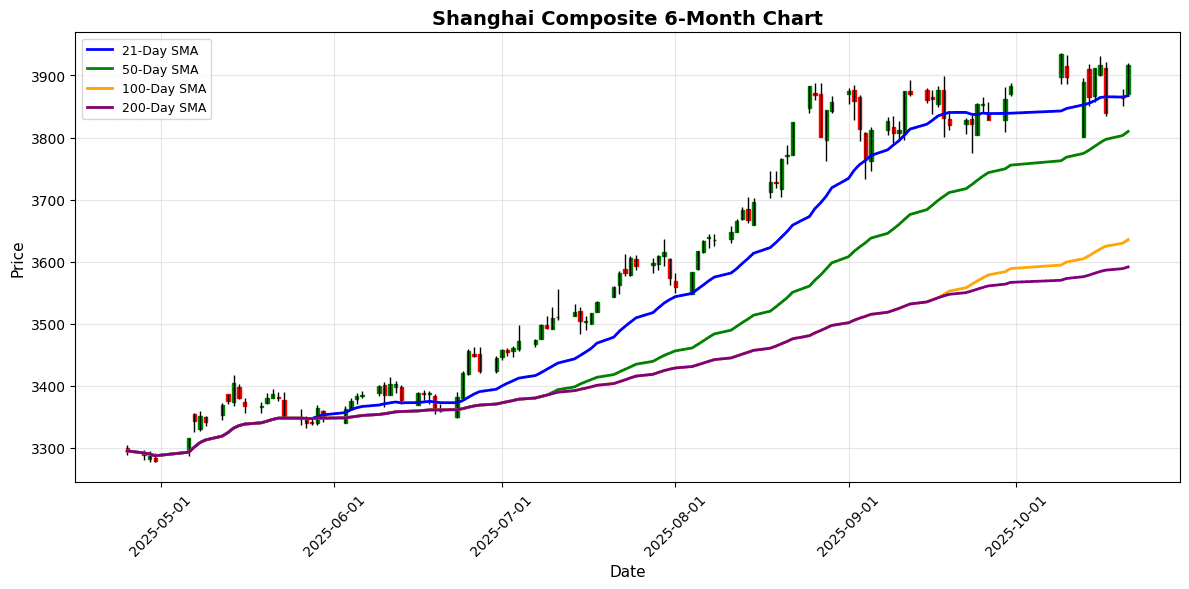
| Shanghai Composite | 3916.33 | +1.36 |
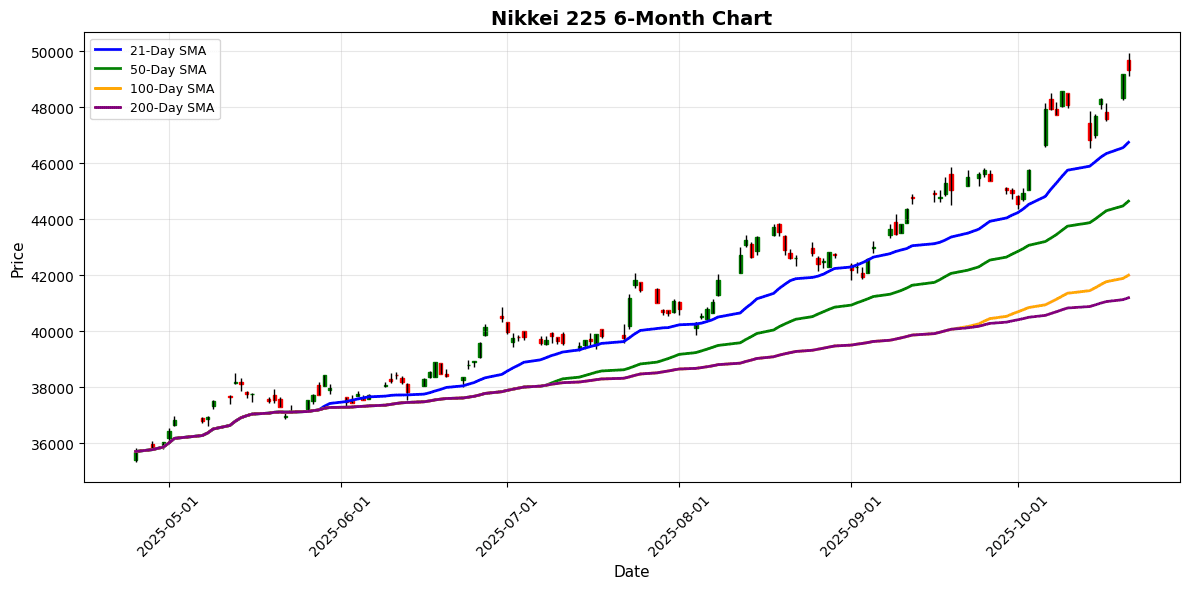
| Nikkei 225 | 49316.06 | +0.27 |
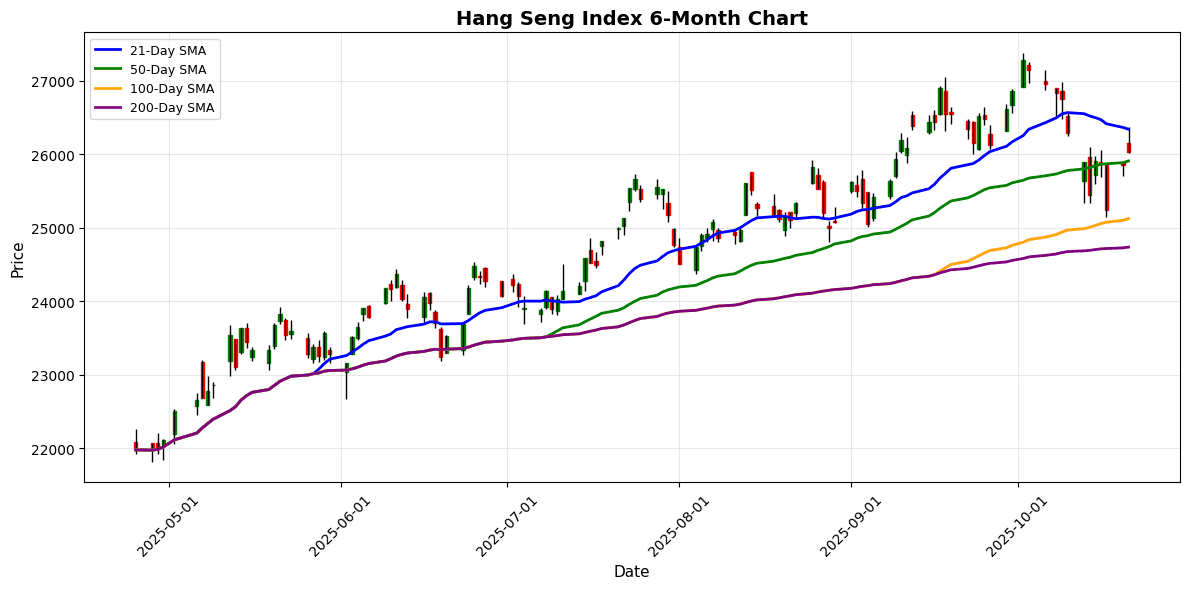
| Hang Seng Index | 26027.55 | +0.65 |
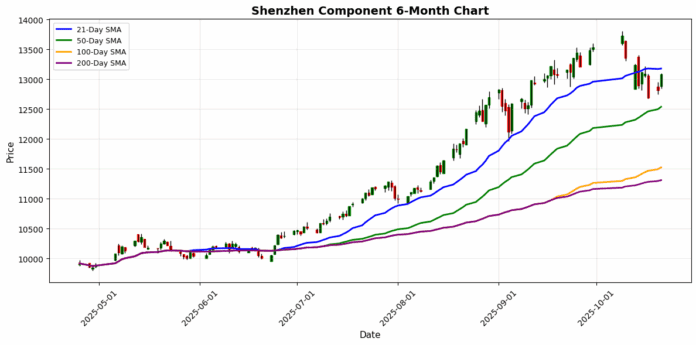
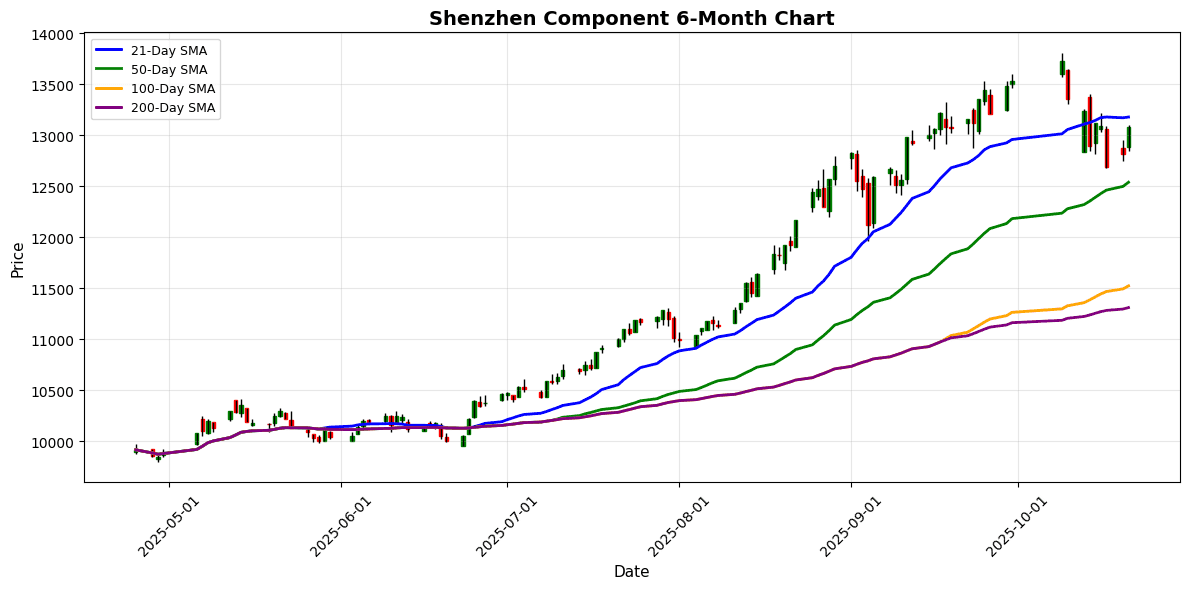
| Shenzhen Component | 13077.32 | +2.06 |
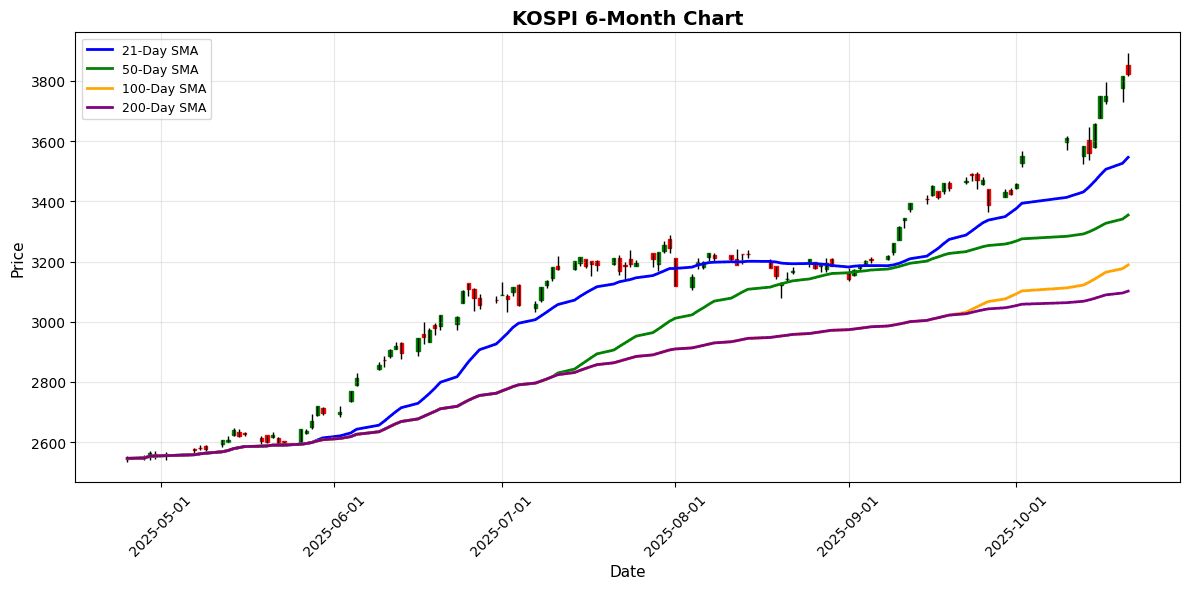
| KOSPI | 3823.84 | +0.24 |
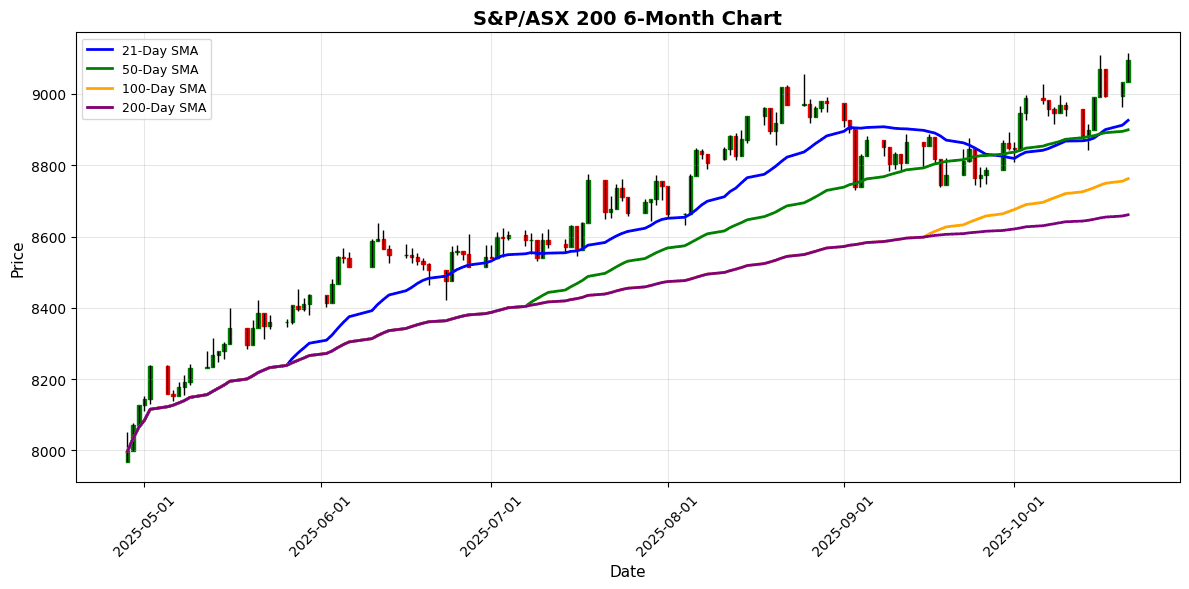
| S&P/ASX 200 | 9094.70 | +0.70 |
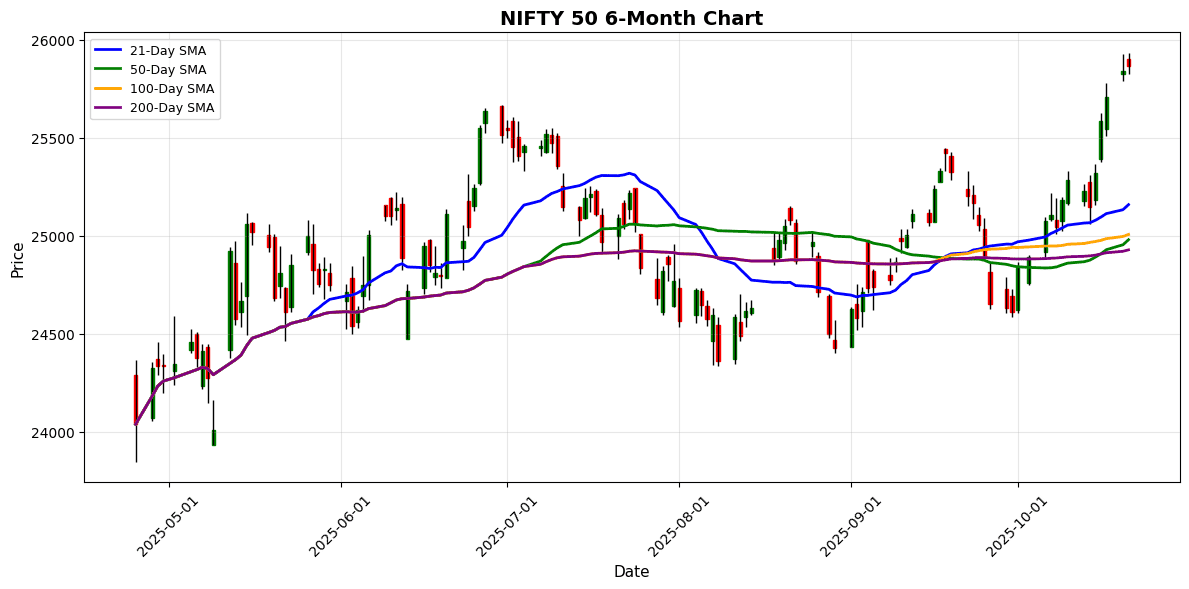
| NIFTY 50 | 25868.60 | +0.10 |
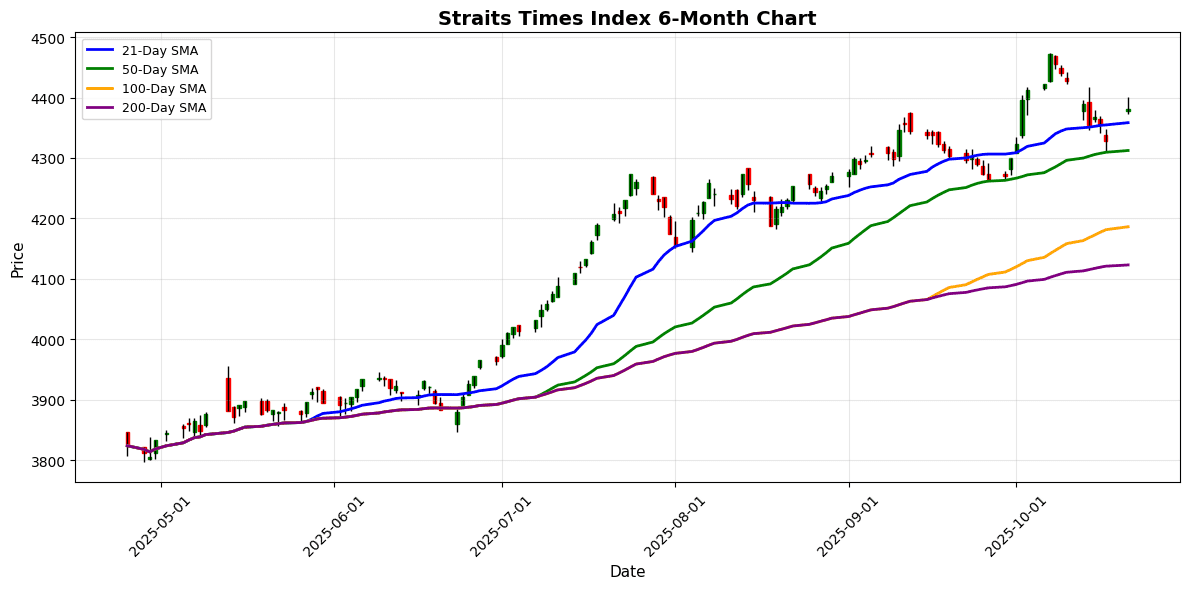
| Straits Times Index | 4381.05 | +1.20 |
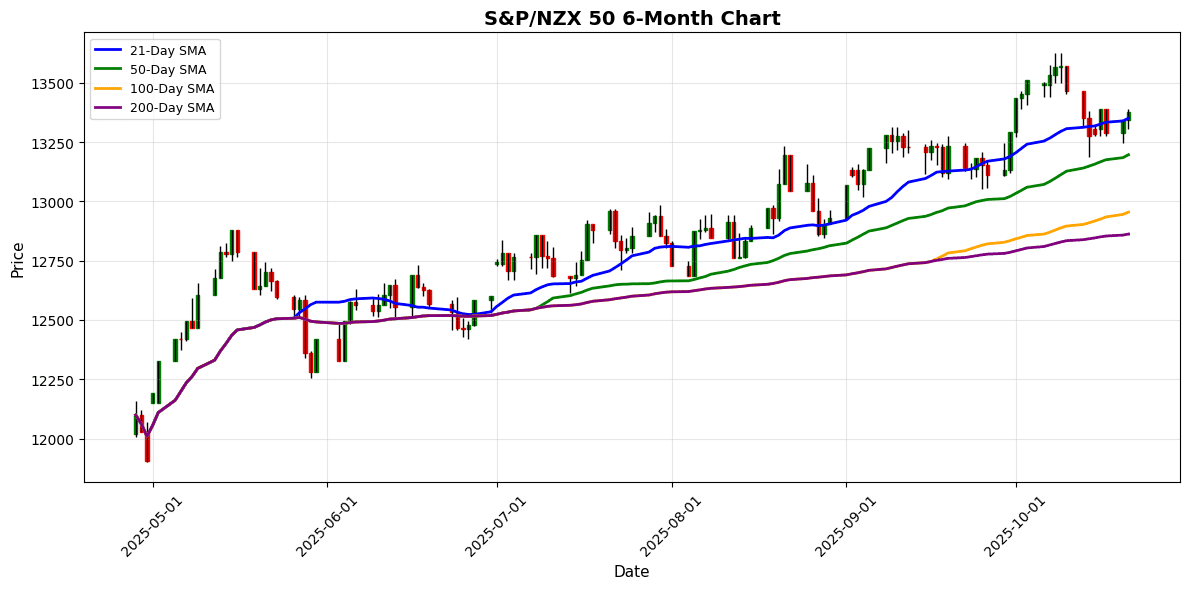
| S&P/NZX 50 | 13377.85 | +0.25 |
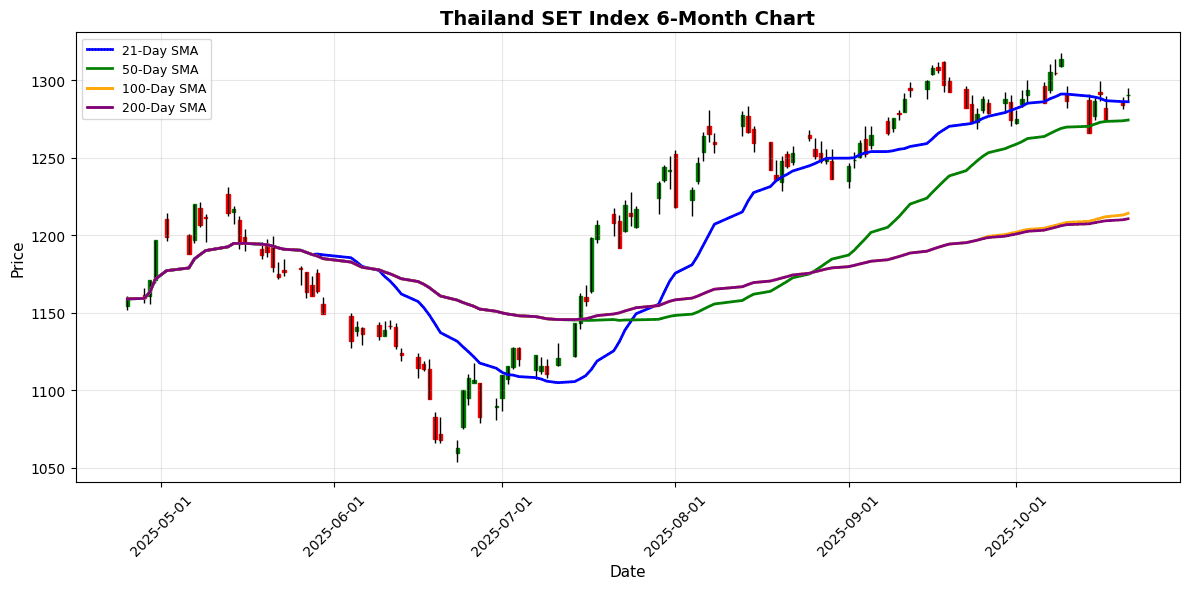
| Thailand SET Index | 1290.72 | +0.49 |
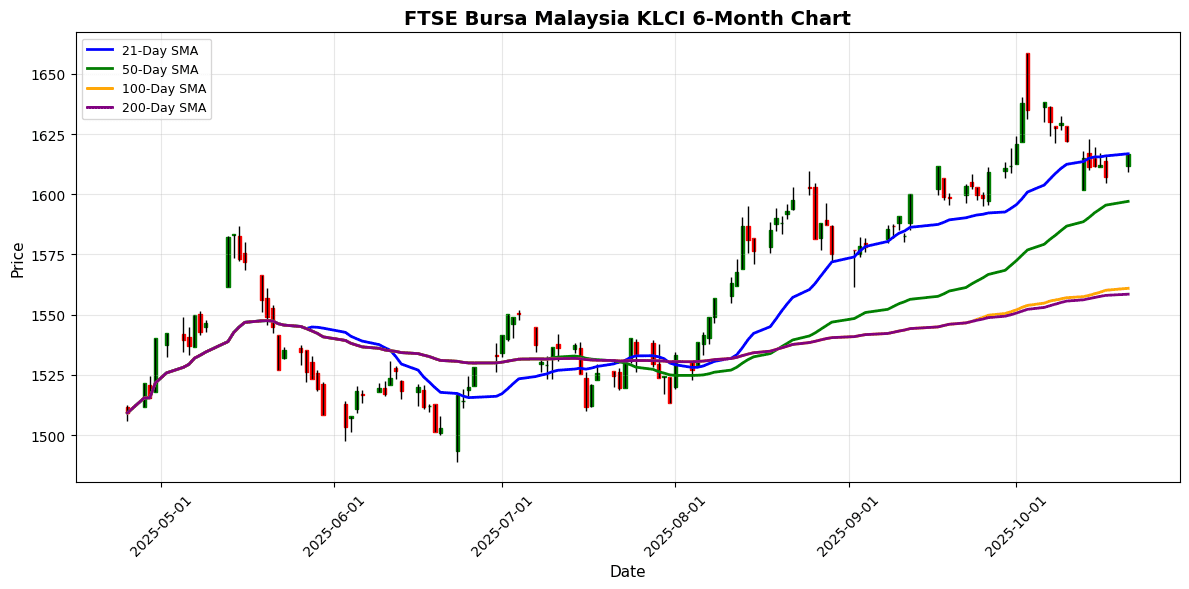
| FTSE Bursa Malaysia KLCI | 1616.83 | +0.60 |
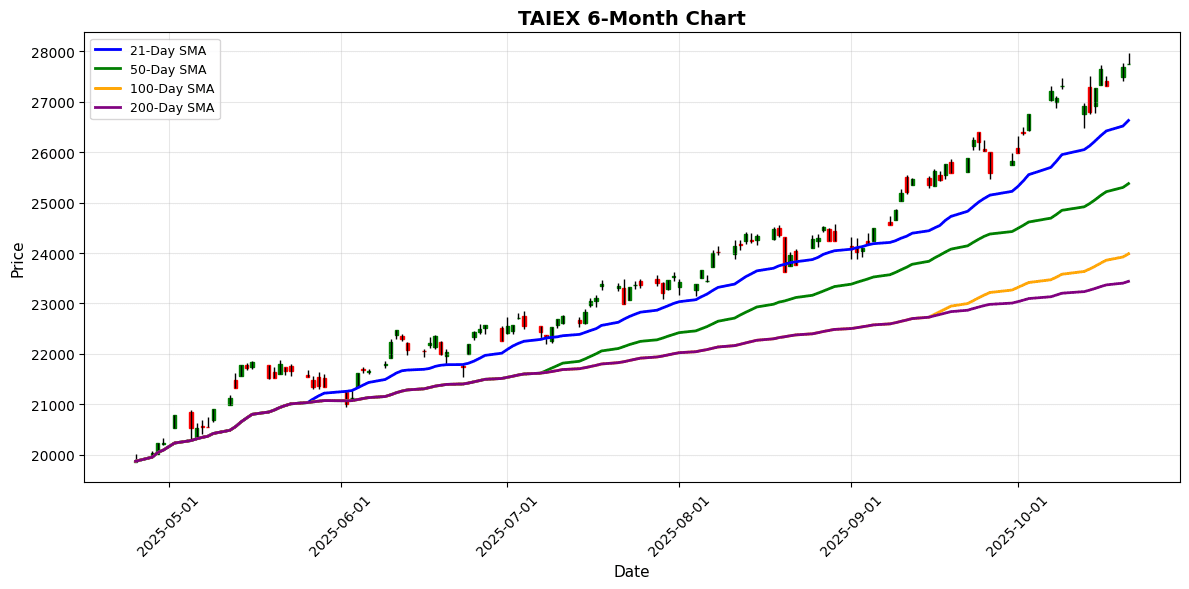
| TAIEX | 27752.41 | +0.23 |
📰 Market Commentary
On October 21, 2025, Asian markets exhibited a generally positive sentiment, buoyed by significant developments in Japan and China, while also reflecting regional economic dynamics.
The Nikkei 225 index in Japan reached an all-time high, closing at 49,316.06, a 0.27% increase, following the appointment of a new Prime Minister, Sanae Takaichi. This political shift has sparked optimism about potential economic reforms and stimulus measures aimed at revitalizing growth. The ruling Liberal Democratic Party’s collaboration with the Japan Innovation Party to legislate a “second capital” plan for Osaka further fueled investor confidence, suggesting a proactive approach to urban and economic development.
In China, the Shanghai Composite rose by 1.36% to 3,916.33, driven by positive revisions in GDP forecasts from major overseas banks. Goldman Sachs, for instance, raised its 2025 GDP growth estimate from 4.8% to 4.9%, indicating that China is on track to meet its growth target of around 5%. This optimism was further supported by ChangXin Memory Technologies’ plans for a substantial IPO in Shanghai, which could enhance China’s position in the global semiconductor market.
The Hong Kong market also reflected positive momentum, with the Hang Seng Index climbing 0.65% to 26,027.55. The Airport Authority’s announcement regarding Hong Kong International Airport’s role as a central hub for the Greater Bay Area positions the city favorably for future economic expansion, particularly as Chinese companies seek global opportunities.
Despite these gains, some sectors faced headwinds. Australian critical metal stocks experienced a retreat after an initial surge, influenced by a recent $8.5 billion U.S. minerals deal. This volatility highlights the ongoing challenges within commodity markets, particularly in light of fluctuating global demand.
Overall, the market sentiment across Asia is characterized by cautious optimism, with indices generally trending upward. The focus remains on the potential for economic reforms in Japan, strengthened growth prospects in China, and the strategic positioning of Hong Kong as a financial and logistical hub. Investors are keenly monitoring these developments, which could significantly influence market trajectories in the coming months.
📅 Economic Calendar – Asian Session
All times are in US Eastern Time (ET)
| Date | Time | Cur | Imp | Event | Actual | Forecast |
|---|---|---|---|---|---|---|
| 2025-10-20 | 19:50 | 🇯🇵 | Medium | Adjusted Trade Balance | -0.11T | |
| 2025-10-20 | 19:50 | 🇯🇵 | Medium | Exports (YoY) (Sep) | 4.6% | |
| 2025-10-20 | 19:50 | 🇯🇵 | Medium | Trade Balance (Sep) | 22.0B |
On October 21, 2025, key economic data from Japan released on October 20 has significant implications for traders. The Adjusted Trade Balance came in at -0.11 trillion JPY, aligning closely with the forecast, indicating stability in Japan’s trade dynamics despite ongoing global economic pressures.
In terms of exports, the year-on-year growth for September was reported at 4.6%, matching expectations. This consistent performance in exports suggests resilience in Japan’s external demand, which could bolster confidence in the manufacturing sector.
Additionally, the Trade Balance for September showed a surplus of 22.0 billion JPY, surpassing the forecast. This positive deviation could signal stronger-than-anticipated economic activity, potentially leading to upward adjustments in GDP growth forecasts.
Market implications for Asian indices are noteworthy. The alignment of the Adjusted Trade Balance and exports with forecasts may limit volatility in the JPY, while the stronger-than-expected Trade Balance could support bullish sentiment in Japanese equities. Traders should monitor how these data points influence broader market trends in Asia, particularly in export-driven sectors.
📈 Individual Index Charts
Shanghai Composite
Nikkei 225
Hang Seng Index
Shenzhen Component
KOSPI
S&P/ASX 200
NIFTY 50
Straits Times Index
S&P/NZX 50
Thailand SET Index
FTSE Bursa Malaysia KLCI
TAIEX
💱 FX, Commodities & Crypto
In recent trading sessions, FX pairs exhibited notable volatility. The USD/JPY rose by 0.82%, driven by expectations of continued monetary policy divergence between the U.S. and Japan. Conversely, the AUD/USD and NZD/USD fell by 0.46% and 0.56%, respectively, influenced by weaker commodity prices and risk aversion. The USD/CNY remained stable, reflecting ongoing trade tensions and economic adjustments.
In commodities, gold prices declined by 2.06%, pressured by a stronger dollar and rising interest rates, while crude oil prices increased by 0.91%, supported by supply constraints and geopolitical tensions.
In the cryptocurrency market, both Bitcoin and Ethereum experienced declines of 2.68% and 2.97%, respectively. These movements were primarily driven by regulatory concerns and market sentiment shifts, reflecting broader risk-off behavior among investors.
Currency Pairs
| Currency Pair | Price | Daily Change (%) |
|---|---|---|
| USD/JPY | 151.91 | +0.82 |
| USD/CNY | 7.12 | -0.01 |
| USD/SGD | 1.30 | +0.32 |
| AUD/USD | 0.65 | -0.46 |
| NZD/USD | 0.57 | -0.56 |
| USD/INR | 87.97 | +0.14 |
Commodities
| Commodity | Price | Daily Change (%) |
|---|---|---|
| Gold | 4268.80 | -2.06 |
| Crude Oil | 58.05 | +0.91 |
Cryptocurrencies
| Crypto | Price | Daily Change (%) |
|---|---|---|
| Bitcoin | 107626.84 | -2.68 |
| Ethereum | 3862.71 | -2.97 |
Disclaimer
The content on MarketsFN.com is provided for educational and informational purposes only. It does not constitute financial advice, investment recommendations, or trading guidance. All investments involve risks, and past performance does not guarantee future results. You are solely responsible for your investment decisions and should conduct independent research and consult a qualified financial advisor before acting. MarketsFN.com and its authors are not liable for any losses or damages arising from your use of this information.


