Park Aerospace Corp. (PKE) Post Earning Analysis
Park Aerospace Corp., founded in 1954 by Jerry Shore and Anthony Chiesa, specializes in advanced composite materials used in aerospace industries. Operating across North America, Asia, and Europe, the company is headquartered in Westbury, NY. Park Aerospace is known for its innovative solutions and hot-melt advanced composite materials, catering to a global clientele in the aerospace sector.
Park Aerospace Corp. (PKE) recently disclosed its financial results for the second quarter of fiscal year 2026, emphasizing strong financial performance and strategic initiatives. The announcement, covered extensively by GuruFocus.com and GlobeNewswire, highlighted the company’s success in navigating market challenges and bolstering its financial health. The detailed earnings call, as reported on October 9, 2025, revealed positive outcomes that are likely to influence investor confidence and potentially impact the stock’s performance positively.
Prior to the earnings disclosure, on October 6, 2025, Park Aerospace had announced the date for the release of these results and the corresponding conference call, which set the stage for the subsequent detailed earnings discussion. The anticipation built around this event was likely a factor in maintaining investor interest and market stability for PKE stock leading up to the disclosure.
In related industry news, SIFCO’s stock saw a significant surge of 69.3% over three months, as reported by Zacks on October 7, 2025. While not directly related to Park Aerospace, this trend in a fellow aerospace sector company could reflect broader market movements or sector-specific dynamics that might also affect Park Aerospace’s market environment and investor sentiment.
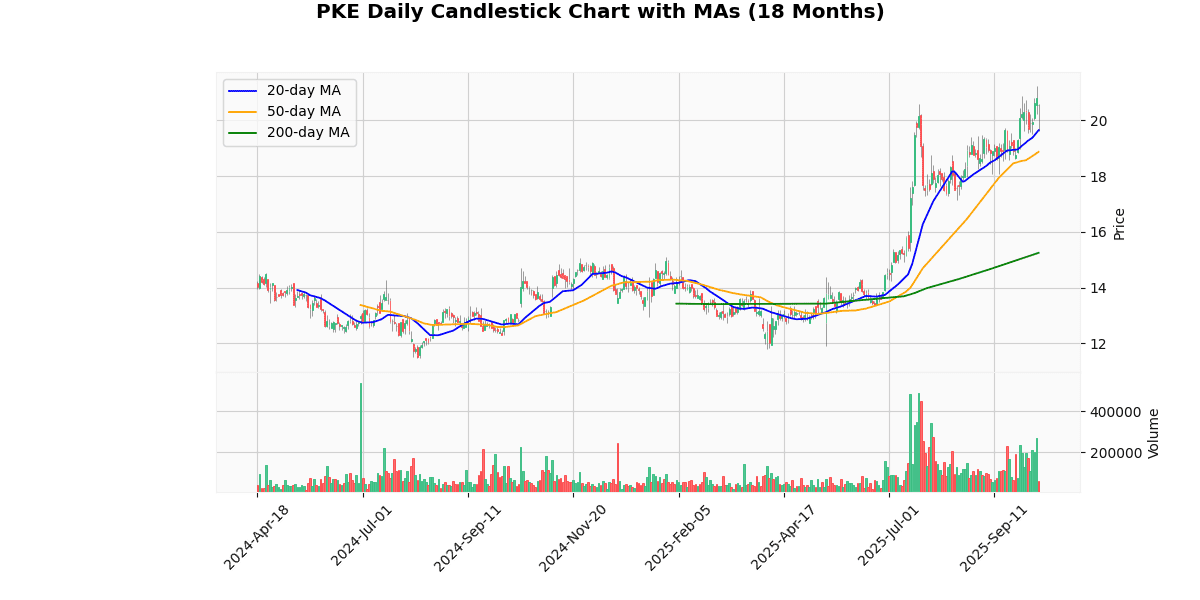
The price metrics indicate a generally positive trend for the asset, currently priced at $20.5575 with no change today. The price is nearing its 52-week and year-to-date (YTD) high of $21.25, reflecting a slight -3.26% difference from this peak. This proximity to the high suggests a strong performance, particularly given the substantial 74.22% increase from both the 52-week and YTD lows of $11.8.
The asset has shown significant growth over longer periods, as demonstrated by its performance above the moving averages: 4.61% above the 20-day MA, 8.9% above the 50-day MA, and an impressive 34.79% above the 200-day MA. Such figures indicate sustained upward momentum.
The week’s range between $19.51 and $21.25, with the current price closer to the high, coupled with a Relative Strength Index (RSI) of 63.37, suggests that the asset is somewhat overbought but not excessively so. The Moving Average Convergence Divergence (MACD) of 0.5 further supports the bullish momentum, albeit indicating that caution might be warranted as the market could be nearing overbought conditions.
Overall, the asset appears to be on a strong bullish trend with potential for continued growth, though it is approaching a critical resistance level near its 52-week and YTD highs.
Price Chart

Park Aerospace Corp. (NYSE: PKE) reported its financial outcomes for the second quarter of fiscal year 2026 on October 9, 2025. The results showed a slight decline in net sales, with Q2 2026 sales totaling $16,381,000 compared to $16,709,000 in Q2 2025, marking a 1.96% decrease. However, the company saw a 6.38% increase from Q1 2026, and a 3.58% rise in sales for the first six months of FY 2026 compared to the same period in FY 2025.
Net earnings for Q2 2026 improved significantly to $2,404,000, up 16.33% from $2,066,000 in Q2 2025. The earnings for the first half of FY 2026 also rose by 46.6% year-over-year. Adjusted EBITDA for the quarter increased by 6.08% to $3,401,000 and by 9.46% for the six-month period.
Earnings per share (EPS) for Q2 2026 were $0.12, showing a 20% increase from $0.10 in Q2 2025. The EPS for the first six months also saw a significant rise of 53.33% compared to the same period last year.
The company’s total assets decreased to $116,448,000 as of August 31, 2025, from $122,108,000 on March 2, 2025. Total liabilities and shareholders’ equity also saw declines during this period. No dividends or share repurchases were announced in the report.
Dividend Payments Table
| Date | Dividend |
|---|---|
| 2025-10-01 | 0.125 |
| 2025-07-01 | 0.125 |
| 2025-04-02 | 0.125 |
| 2025-01-03 | 0.125 |
| 2024-10-01 | 0.125 |
| 2024-07-01 | 0.125 |
| 2024-04-01 | 0.125 |
| 2024-01-02 | 0.125 |
The dividend data from the last eight quarters, spanning from January 2024 to October 2025, exhibits a consistent trend in the dividend payouts. Throughout this period, dividends have been maintained at a steady rate of $0.125 per quarter. This uniformity in dividend payments suggests a stable financial approach by the company, possibly reflecting a solid operating performance and a commitment to returning value to shareholders consistently.
This consistency might also indicate that the company’s management is confident in its cash flow stability, allowing for predictable returns to its investors. The lack of fluctuation in dividend amounts could be seen as a positive signal to conservative investors seeking reliability and predictability in their income streams. However, for growth-oriented investors, the constant dividend might suggest a plateau in growth prospects, as increased profits are not leading to raised dividends. Overall, the data portrays a picture of financial stability and a conservative approach to shareholder distribution policy.
The most recent rating changes for the company by Needham can be summarized and analyzed as follows:
- June 30, 2016 – Reiteration by Needham: Needham reiterated its rating on the stock with a ‘Buy’ status but lowered the target price from $21 to $18. This adjustment in the target price suggests a recalibration of expectations, possibly due to operational challenges or market conditions impacting the company’s projected financial performance. The reduction in target price, despite maintaining a ‘Buy’ rating, indicates some level of caution amidst generally positive outlook.
- October 8, 2015 – Reiteration by Needham: Needham once again reiterated a ‘Buy’ rating on the company. However, the target price was decreased from $27 to $21. This significant reduction in the target price could reflect changes in the company’s market environment or financial health, which might have affected its growth prospects or profitability outlook, yet Needham continued to see value in the stock.
- July 2, 2014 – Upgrade by Needham: This date marks an upgrade from ‘Hold’ to ‘Buy’ with a set target price of $33. This upgrade likely indicates a strong conviction in the company’s improved fundamentals or potential market opportunities that could drive the stock’s performance. Setting the target at $33 suggests a robust confidence level in the company’s ability to outperform.
- May 10, 2013 – Upgrade by Needham: Earlier in the timeline, Needham upgraded the stock from ‘Hold’ to ‘Buy’ and set a target price of $27. This change likely stemmed from positive developments within the company or favorable market dynamics that enhanced its investment appeal. The initiation of a ‘Buy’ rating here sets a positive trajectory in the subsequent years.
Overall, the series of ratings and price target changes by Needham indicate a generally positive outlook on the company with periodic adjustments to the target prices reflecting the evolving business landscape and internal company performance. The firm’s continuous engagement and adjustments in their ratings demonstrate active monitoring and response to the company’s financial health and market conditions.
The current price of the stock is $20.56, which shows a downward trend when compared to the historical target prices set by Needham over the years. Originally, in 2013, the target price was set at $27 upon upgrading the stock to “Buy.” This target was maintained in 2014 but was then adjusted downward to $21 in 2015, and further reduced to $18 in 2016, each time reaffirming a “Buy” rating. These adjustments suggest a recalibration of expectations by Needham, possibly due to changing market conditions or company performance not meeting earlier forecasts.
Disclaimer: The information provided here is for educational and informational purposes only and should not be interpreted as financial advice, investment recommendations, or trading guidance. Markets involve risk, and past performance is not indicative of future results. You should always conduct your own research and consult with a qualified financial advisor before making any investment decisions. By acting, you accept full responsibility for your choices.


