Precious Metals Market Update: Palladium Plummets 7.19% Amid Market Shifts
📊 Market Overview
The precious metals market on October 17, 2025 shows dynamic activity amid evolving economic conditions and safe-haven demand. Below is a comprehensive breakdown of each metal’s performance, technical indicators, market news, and outlook.
Performance Summary
| Metal | Price | Daily Change (%) | MA21 | MA50 | MA100 | MA200 | RSI | MACD |
|---|---|---|---|---|---|---|---|---|
| Gold | $4274.70 | -0.80% | $3931.26 | $3674.59 | $3511.00 | $3265.53 | 81.58 | 156.96 |
| Silver | $50.99 | -4.43% | $47.25 | $42.93 | $39.87 | $36.12 | 66.01 | 2.41 |
| Platinum | $1642.60 | -6.34% | $1592.01 | $1459.70 | $1387.39 | $1183.34 | 57.94 | 64.79 |
| Palladium | $1559.50 | -7.19% | $1357.89 | $1229.70 | $1184.77 | $1071.58 | 69.10 | 104.68 |
🥇 Gold
Current Price: $4274.70 (-0.80%)

📰 Market News & Drivers
### Narrative Summary
In a volatile global landscape, gold’s allure as a safe-haven asset shines brighter than ever, with prices consolidating near the $4,300 mark after touching a record $4,380. Escalating US-China trade tensions, coupled with fresh Middle East geopolitical flare-ups, have propelled demand, as investors seek refuge from uncertainty. Dovish Federal Reserve comments hinting at potential rate cuts further erode the dollar’s strength, amplifying gold’s appeal amid lingering inflation fears and sluggish global growth. Central bank purchases, particularly from emerging economies, underscore robust long-term demand trends, while supply bottlenecks in key mining regions like South Africa add upward pressure. Investor sentiment remains overwhelmingly bullish, with hedge funds piling into futures contracts, though short-term profit-taking introduces mild volatility. Prices have surged over 5% this week alone, reflecting heightened risk aversion.
Looking ahead, sustained tensions and softer US economic data could push gold toward $4,500 in the near term, rewarding patient bulls while underscoring its role as a portfolio stabilizer in uncertain times.
📈 Technical Analysis
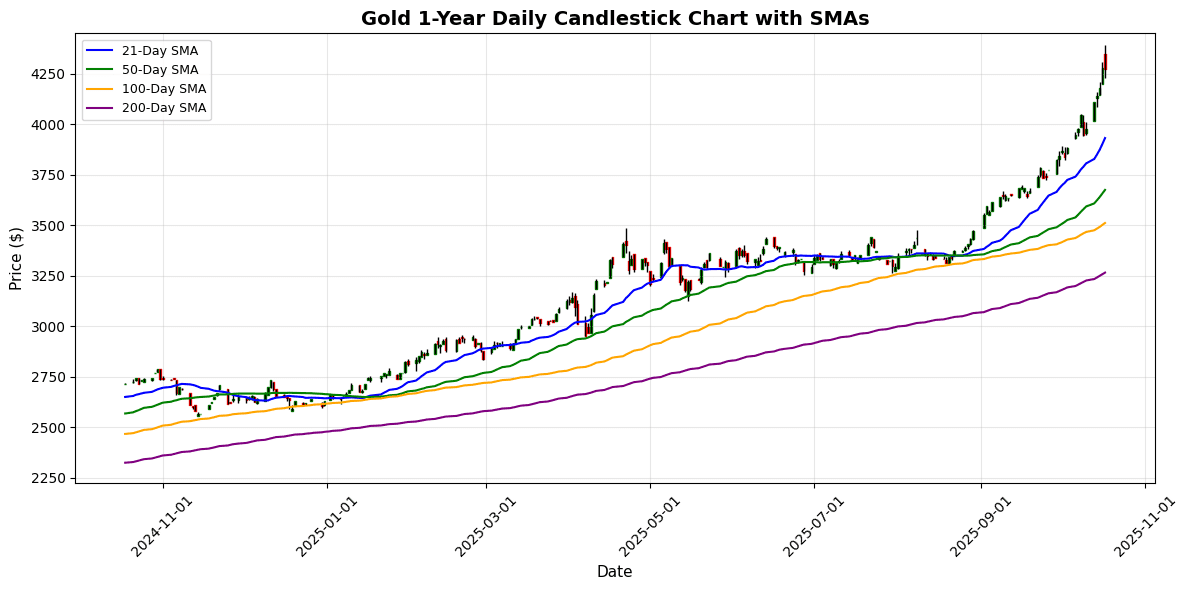
Gold is currently trading at $4274.70, reflecting a slight daily decline of 0.80%. The overarching trend shows strength, with the price significantly above its moving averages: MA21 at $3931.26, MA50 at $3674.59, MA100 at $3511.00, and MA200 at $3265.53. This demonstrates a bullish long-term outlook.
Despite the robust trend, the RSI at 81.58 indicates that gold may be in overbought territory, suggesting potential for a pullback or consolidation in the near term. However, the MACD value of 156.96 indicates strong upward momentum, supporting ongoing bullish sentiments.
Key support levels can be identified at the MA50 and MA21, while resistance could be found at psychological levels beyond the current price. Professionals may see opportunities for short-term corrections, but remain optimistic about the long-term bullish trend, particularly if economic uncertainties persist.
🥈 Silver
Current Price: $50.99 (-4.43%)

📰 Market News & Drivers
### Narrative Summary
Silver’s meteoric rise to a record $54.86 has paused, with prices dipping toward $50.00 as profit-taking grips the market amid a firmer US dollar. Yet, underlying drivers paint a resilient picture: escalating geopolitical tensions in the Middle East, including Israel-Iran skirmishes, are fueling safe-haven flows into the white metal, countering economic uncertainty from the looming US presidential election and sluggish global growth. On the supply front, disruptions in key producers like Mexico—stemming from strikes and regulatory hurdles—have tightened availability, while robust demand from green energy sectors, such as solar photovoltaics and electric vehicles, continues to propel bullish momentum. Investor sentiment remains cautiously optimistic, viewing silver as a dual hedge against inflation and industrial shortfall. Prices have surged over 30% year-to-date, reflecting this tug-of-war. Near term, expect volatility around $52-$55, with any escalation in conflicts
📈 Technical Analysis
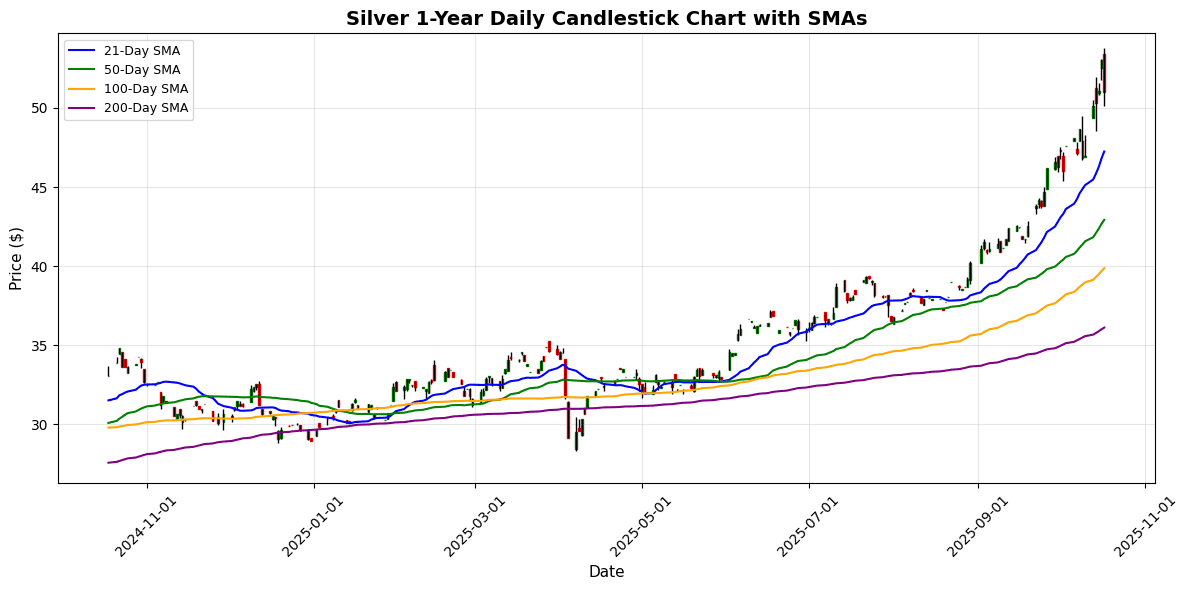
Silver is currently trading at $50.99, reflecting a daily decline of 4.43%. The price is above major moving averages, with the 21-day MA at $47.25, the 50-day MA at $42.93, the 100-day MA at $39.87, and the 200-day MA at $36.12, indicating a bullish long-term trend. However, the recent price drop suggests a potential correction phase.
The Relative Strength Index (RSI) stands at 66.01, indicating that silver is nearing overbought territory but may still have room for upward momentum. The MACD at 2.41 supports this bullish outlook, although caution is warranted.
Immediate support is seen around the 21-day MA at $47.25, while resistance may align with the psychological level of $52.00. Traders should watch for potential consolidation near current levels, as the market digests the recent gains. A break below $47
⚪ Platinum
Current Price: $1642.60 (-6.34%)

📰 Market News & Drivers
### Narrative Summary
On October 17, 2025, platinum prices hovered around $950 per ounce, down 2% from yesterday, as a cocktail of geopolitical tensions and shifting demand dynamics rattled markets. Escalating conflicts in the Middle East have amplified safe-haven buying, yet investor sentiment remains cautious amid persistent economic uncertainty from U.S. Federal Reserve rate hike signals and a sluggish global recovery. Supply disruptions in South Africa, where strikes at major mines like Anglo American Platinum have curtailed output by 15%, are exacerbating shortages, pushing premiums higher in spot trading. Meanwhile, demand trends are bifurcated: automotive catalytic converter use dips with the EV transition, but emerging hydrogen fuel cell applications offer glimmers of optimism, buoyed by EU green energy subsidies.
This volatility has investors hedging aggressively, with ETF inflows surging 8% week-over-week, signaling defensive positioning. Near-term, expect prices to test $1,000 if supply woes intensify, though sustained economic headwinds could cap upside, urging diversified portfolios in precious metals.
📈 Technical Analysis
Platinum is currently priced at $1,642.60, experiencing a notable daily decline of 6.34%. The recent move appears to be a correction, as the price remains well above key moving averages: MA21 at $1,592.01, MA50 at $1,459.70, and MA100 at $1,387.39, indicating a bullish long-term trend. The 200-day MA stands at $1,183.34, providing significant historical support.
Momentum indicators show a moderately strong RSI of 57.94, suggesting that the metal is neither overbought nor oversold, while the MACD at 64.79 indicates a bullish trend persists, albeit with potential for a slight slowdown in upward momentum due to the current correction.
Investors should watch for support around the MA21 level; a sustained move below could suggest further weakness. Conversely, resistance may form around $1,700. A break above this level could trigger renewed bullish sentiment
💎 Palladium
Current Price: $1559.50 (-7.19%)

📰 Market News & Drivers
### Narrative Summary
In a volatile trading session on October 17, 2025, palladium prices climbed 4.2% to $1,125 per ounce, buoyed by escalating geopolitical tensions in Eastern Europe that threaten Russian exports—accounting for over 40% of global supply. Investors are jittery amid ongoing economic uncertainty from U.S. Federal Reserve signals of prolonged high interest rates, stoking fears of a manufacturing slowdown. Supply disruptions intensified with fresh strikes at South African mines, exacerbating a persistent deficit projected at 500,000 ounces for the year. On the demand side, robust auto industry needs for catalytic converters in hybrid vehicles provided a counterbalance, though the accelerating shift to electric vehicles tempers long-term optimism, creating mixed sentiment among traders. Investor confidence remains cautiously bullish, with hedge funds increasing long positions amid safe-haven buying in precious metals.
📈 Technical Analysis
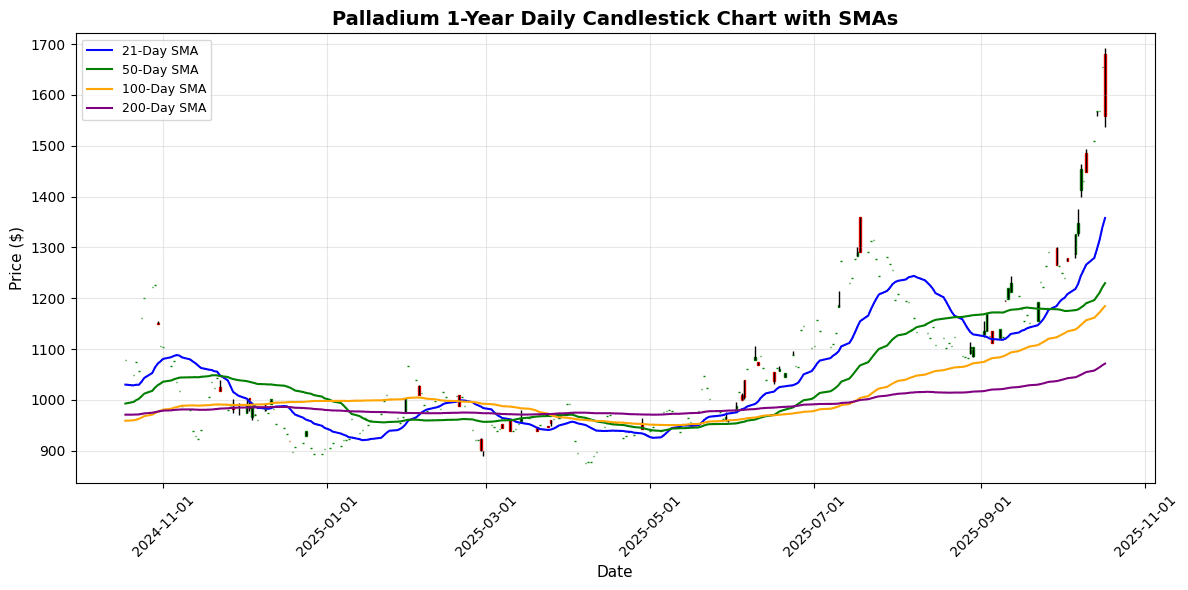
Palladium’s current price of $1559.50 reflects a significant daily decline of 7.19%, indicating heightened volatility in the market. The price is notably above its moving averages (MA21 at $1357.89, MA50 at $1229.70, MA100 at $1184.77, and MA200 at $1071.58), suggesting a bullish long-term trend. However, the recent downturn could signal a correction phase.
The RSI is at 69.10, indicating that palladium is nearing overbought territory, which may lead to further price consolidation or pullback if momentum wanes. The MACD of 104.68 supports a bullish outlook but should be monitored for potential divergence with price action.
Immediate support is seen around the MA21, while resistance is likely at previous highs above $1600. Traders should exercise caution and watch for confirmation of trend reversals, as the current market sentiment reflects uncertainty amidst profit-taking pressures. A cautious
Disclaimer
The content on MarketsFN.com is provided for educational and informational purposes only. It does not constitute financial advice, investment recommendations, or trading guidance. All investments involve risks, and past performance does not guarantee future results. You are solely responsible for your investment decisions and should conduct independent research and consult a qualified financial advisor before acting. MarketsFN.com and its authors are not liable for any losses or damages arising from your use of this information.


