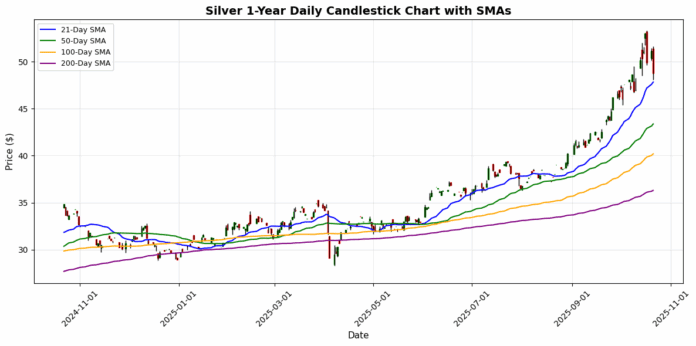
Silver Plummets 5.06% After Record Rally
📊 Market Overview
The precious metals market on October 21, 2025 shows dynamic activity amid evolving economic conditions and safe-haven demand. Below is a comprehensive breakdown of each metal’s performance, technical indicators, market news, and outlook.
Performance Summary
| Metal | Price | Daily Change (%) | MA21 | MA50 | MA100 | MA200 | RSI | MACD |
|---|---|---|---|---|---|---|---|---|
| Gold | $4284.00 | -1.83% | $3984.76 | $3709.45 | $3530.30 | $3281.79 | 71.91 | 163.47 |
| Silver | $48.78 | -5.06% | $47.84 | $43.38 | $40.19 | $36.31 | 55.55 | 2.10 |
| Platinum | $1583.40 | -4.14% | $1608.20 | $1470.15 | $1397.91 | $1189.91 | 51.11 | 49.13 |
| Palladium | $1459.50 | -5.06% | $1385.00 | $1242.33 | $1194.62 | $1077.05 | 57.46 | 88.40 |
🥇 Gold
Current Price: $4284.00 (-1.83%)

📰 Market News & Drivers
### Narrative Summary
In the volatile world of precious metals, gold’s recent dance near record highs—peaking above $4,380 before easing toward $4,300—reflects a delicate balance of relief and lingering caution. Easing US-China trade tensions have sparked profit-taking, tempering the metal’s safe-haven allure as investors reassess risks. Yet, beneath the surface, geopolitical flashpoints in the Middle East and broader economic uncertainty from potential Fed rate pauses sustain bullish undertones. Central bank demand surges, with nations like China and India stockpiling reserves amid currency volatility, while supply disruptions in key mining regions like South Africa exacerbate scarcity pressures. Investor sentiment remains cautiously optimistic, with ETF inflows signaling confidence in gold as an inflation hedge.
This tug-of-war implies near-term volatility: prices could rebound toward $4,400 if trade talks falter or recession signals intensify, rewarding patient bulls
📈 Technical Analysis
Gold is currently trading at $4284.00, showing a daily decline of 1.83%. The price is significantly above key moving averages (MA21: $3984.76, MA50: $3709.45, MA100: $3530.30, MA200: $3281.79), indicating a strong bullish trend in the medium to long term. The current resistance level is tested at $4300, while support can be identified around the MA21 at $3984.76.
The Relative Strength Index (RSI) at 71.91 suggests that gold is nearing overbought territory, which raises the potential for a price correction. However, the MACD reading of 163.47 reflects strong momentum. Traders should exercise caution and monitor for signs of reversal, such as a break below key support levels. A sustained move above $4300 could lead to further upside, while a break below $3984.76 may indicate a shift in momentum
🥈 Silver
Current Price: $48.78 (-5.06%)

📈 Technical Analysis
Silver is currently trading at $48.78, experiencing a significant daily decline of 5.06%. The recent price movement has brought the asset near its 21-day moving average (MA21) of $47.84, which could act as immediate support. A sustained hold above this level may provide bullish momentum, while a drop below it could signal further downside potential.
The longer-term moving averages, notably the MA50 at $43.38, MA100 at $40.19, and MA200 at $36.31, indicate a strong upward trend, suggesting that any retraction might be an opportunity for buyers looking for value. The relative strength index (RSI) at 55.55 indicates that silver is neither overbought nor oversold, reflecting a balanced momentum. The MACD at 2.10 suggests bullishness remains intact, albeit with caution due to the recent downturn. In summary, while short-term resistance should be monitored, the overall trend remains positive, supporting
⚪ Platinum
Current Price: $1583.40 (-4.14%)

📈 Technical Analysis
Platinum is currently priced at $1583.40, reflecting a daily decline of 4.14%. The recent drop has highlighted key technical levels, with the price testing important moving averages. The 21-day moving average (MA21) stands at $1608.20, indicating short-term resistance, while the 50-day MA at $1470.15 and the 100-day MA at $1397.91 signify potential support zones.
The Relative Strength Index (RSI) is at 51.11, indicating a neutral momentum, suggesting neither bullish nor bearish conditions dominate. However, the MACD at 49.13 implies a potential bearish crossover is in play if momentum continues to weaken.
Overall, the recent price action is precariously balanced, with current support at $1470.15 potentially offering a buying opportunity. A sustained breach below this level could trigger further declines, while a rally above $1608.20 may reinstate bullish sentiment. Traders should closely monitor these
💎 Palladium
Current Price: $1459.50 (-5.06%)

📈 Technical Analysis
Palladium is currently trading at $1459.50, reflecting a daily decline of 5.06%. The asset’s pricing is above key moving averages: MA21 at $1385.00, MA50 at $1242.33, MA100 at $1194.62, and MA200 at $1077.05, suggesting a generally bullish trend over the medium to long term. The RSI at 57.46 indicates that palladium is neither overbought nor oversold, suggesting a balanced market sentiment. However, traders should closely monitor the MACD, which stands at 88.40; this indicates strong momentum but may also foreshadow potential bearish corrections if the trend falters.
Immediate support is seen near the MA21, while resistance appears at recent highs around $1540. Overall, the outlook remains cautiously optimistic, but market participants should watch for a potential pullback from current levels given the recent volatility.
Disclaimer
The content on MarketsFN.com is provided for educational and informational purposes only. It does not constitute financial advice, investment recommendations, or trading guidance. All investments involve risks, and past performance does not guarantee future results. You are solely responsible for your investment decisions and should conduct independent research and consult a qualified financial advisor before acting. MarketsFN.com and its authors are not liable for any losses or damages arising from your use of this information.


